| Param | Original file | Final file |
|---|---|---|
| Filename | modeM0/AS1A10_102T09_9000004242_29466cztM0_level2.evt | modeM0/AS1A10_102T09_9000004242_29466cztM0_level2_quad_clean.evt |
| Size (bytes) | 594,826,560 | 58,829,760 |
| Size | 567.3 MB | 56.1 MB |
| Events in quadrant A | 2,425,058 | 380,614 |
| Events in quadrant B | 2,464,280 | 390,670 |
| Events in quadrant C | 2,922,135 | 364,267 |
| Events in quadrant D | 9,862,349 | 292,519 |
| Mode SS | |||
|---|---|---|---|
| Quadrant | BADHDUFLAG | Total packets | Discarded packets |
| A | 0 | 102 | 0 |
| B | 0 | 102 | 0 |
| C | 0 | 102 | 0 |
| D | 0 | 102 | 0 |
| Mode M9 | |||
|---|---|---|---|
| Quadrant | BADHDUFLAG | Total packets | Discarded packets |
| A | 0 | 10 | 0 |
| B | 0 | 10 | 0 |
| C | 0 | 10 | 0 |
| D | 0 | 10 | 0 |
| Mode M0 | |||
|---|---|---|---|
| Quadrant | BADHDUFLAG | Total packets | Discarded packets |
| A | 0 | 10431 | 1 |
| B | 0 | 10497 | 1 |
| C | 0 | 11903 | 1 |
| D | 0 | 32770 | 1 |
| Quadrant | Total seconds | Saturated seconds | Saturation percentage |
|---|---|---|---|
| A | 5029 | 43 | 0.855041% |
| B | 5029 | 52 | 1.034003% |
| C | 5029 | 238 | 4.732551% |
| D | 5029 | 2506 | 49.830980% |
Noise dominated data is calculated using 1-second bins in cleaned event files. If a bin has >2000 counts, and if more than 50% of those come from <1% of pixels, then it is considered to be noise-dominated and hence unusable.
| Quadrant | # 1 sec bins | Bins with >0 counts | Bins with >2000 counts | High rate bins dominated by noise | Noise dominated (total time) | Noise dominated (detector-on time) | Marked lightcurve |
|---|---|---|---|---|---|---|---|
| A | 6024 | 5030 | 1 | 1 | 0.02% | 0.02% | 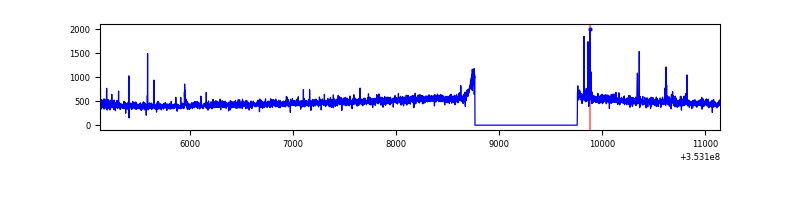 |
| B | 6024 | 5030 | 1 | 1 | 0.02% | 0.02% | 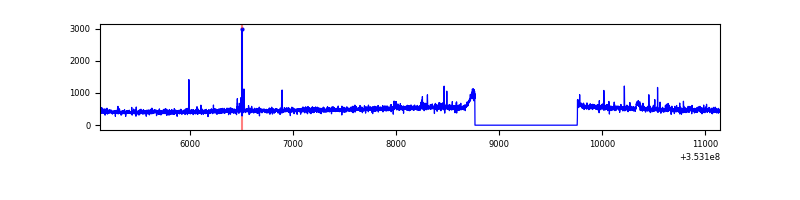 |
| C | 6024 | 5030 | 2 | 2 | 0.03% | 0.04% | 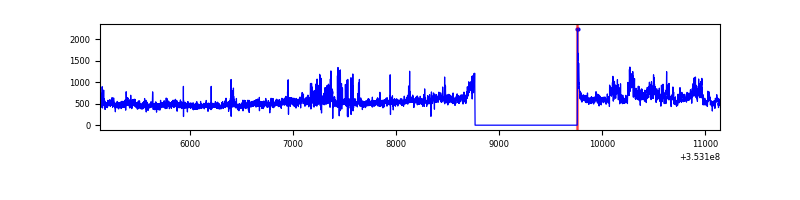 |
| D | 6024 | 5030 | 2369 | 2369 | 39.33% | 47.10% | 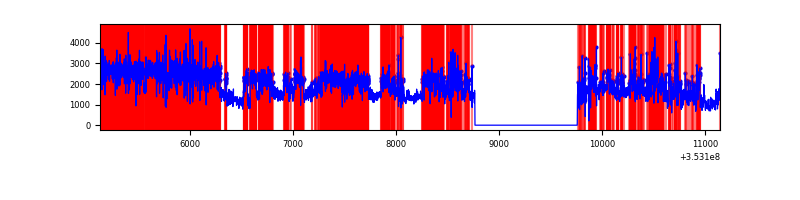 |
Top three noisy pixels from each quadrant. If the there are fewer than three noisy pixels in the level2.evt file, extra rows are filled as -1
| Pixel properties | Quadrant properties | ||||||
|---|---|---|---|---|---|---|---|
| Quadrant | DetID | PixID | Counts | Sigma | Mean | Median | Sigma |
| A | 0 | 13 | 26710 | 208.52 | 618 | 605 | 125.2 |
| A | 14 | 31 | 9753 | 73.07 | 618 | 605 | 125.2 |
| A | 13 | 254 | 9346 | 69.82 | 618 | 605 | 125.2 |
| B | 0 | 230 | 15465 | 123.9 | 617 | 601 | 120.0 |
| B | 12 | 111 | 14860 | 118.85 | 617 | 601 | 120.0 |
| B | 0 | 190 | 14579 | 116.51 | 617 | 601 | 120.0 |
| C | 3 | 233 | 417931 | 3026.31 | 583 | 587 | 137.9 |
| C | 14 | 238 | 141686 | 1023.16 | 583 | 587 | 137.9 |
| C | 14 | 254 | 69797 | 501.87 | 583 | 587 | 137.9 |
| D | 8 | 195 | 7223481 | 56703.19 | 521 | 506 | 127.4 |
| D | 1 | 52 | 489553 | 3839.21 | 521 | 506 | 127.4 |
| D | 7 | 80 | 72489 | 565.09 | 521 | 506 | 127.4 |
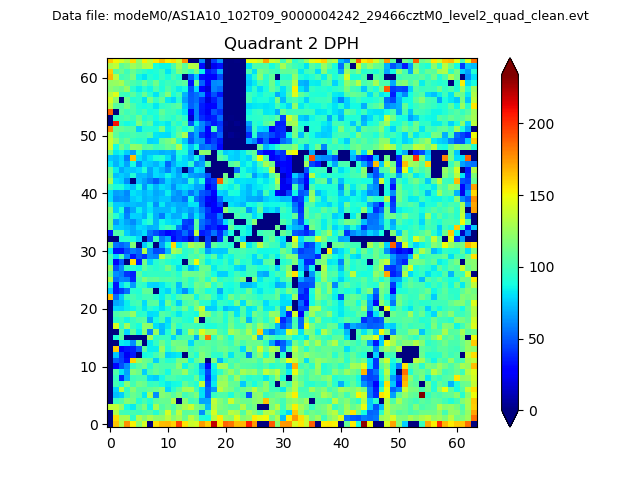
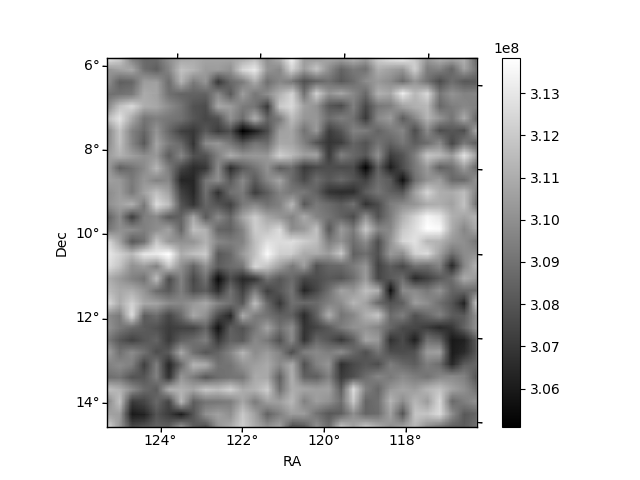
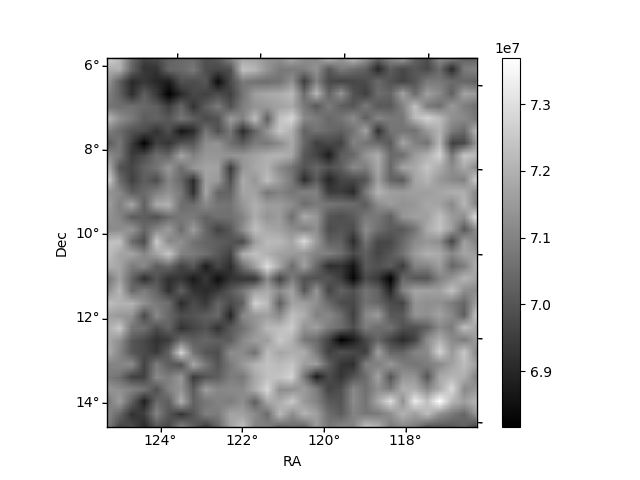
Histogram calculated using DETX and DETY for each event in the final _common_clean file
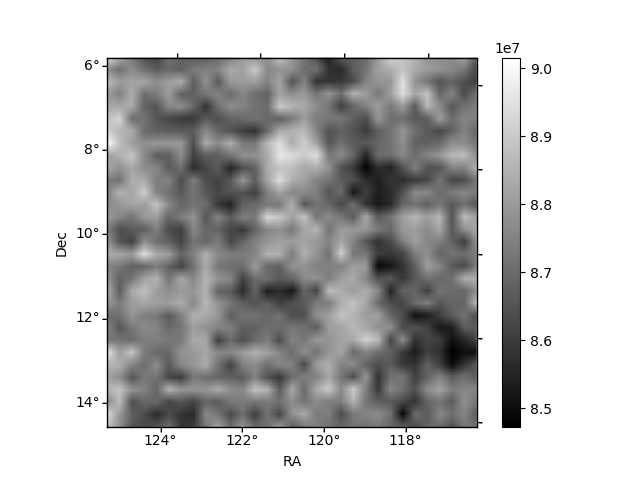
| Quadrant A | 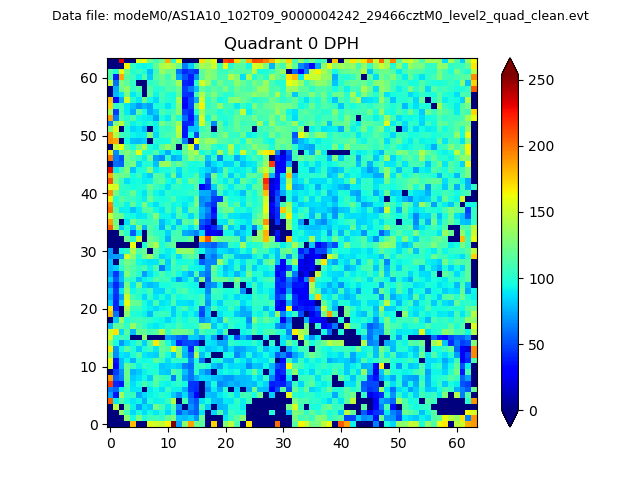 |
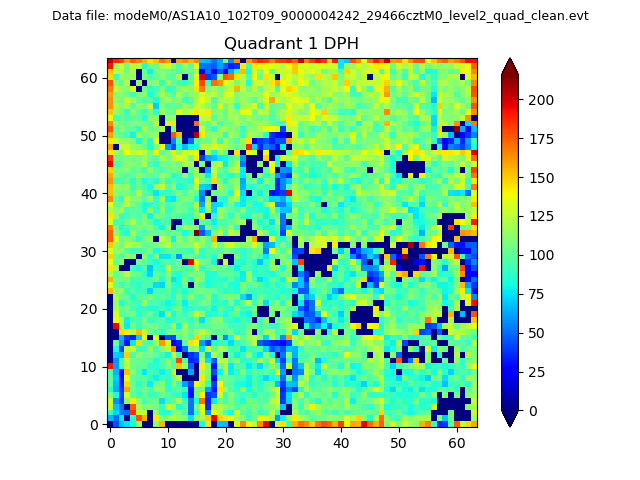 |
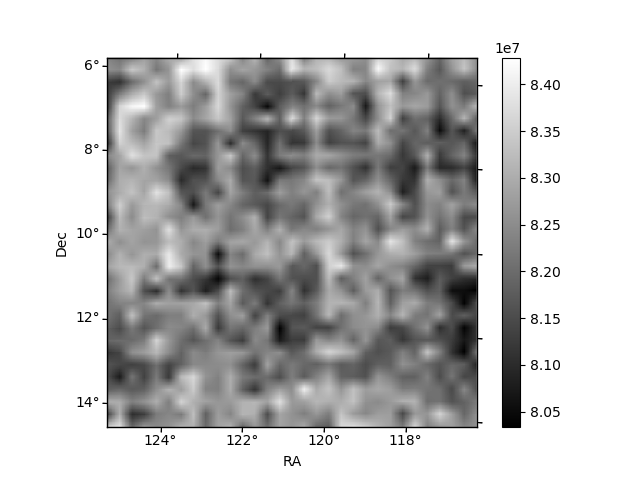
Quadrant B |
|---|---|---|---|
| Quadrant D | 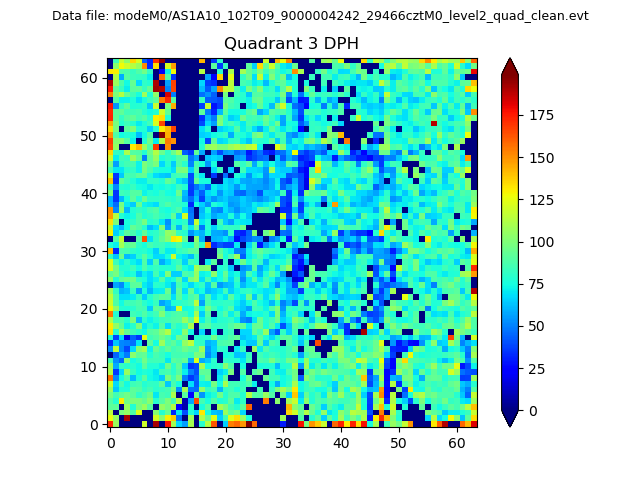 |
 |
Quadrant C |
| Plot type | Count rate plots | Images |
|---|---|---|
| Comparison with Poisson distribution Blue bars denote a histogram of data divided into 1 sec bins. Red curve is a Poisson curve with rate = median count rate of data. |
 |
 |
| Quadrant-wise count rates Data is divided into 100 sec bins |
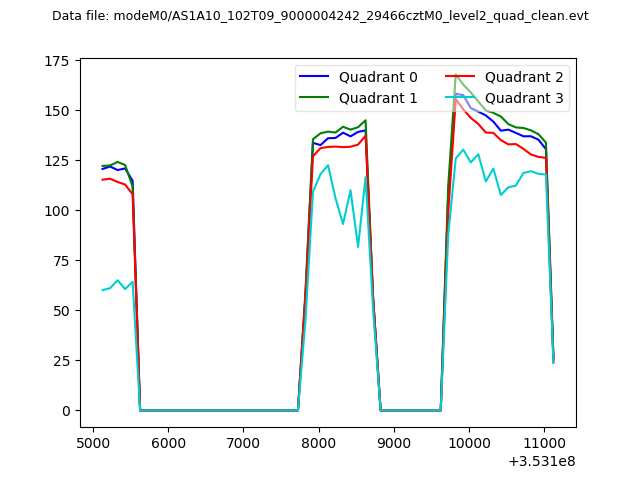 |
|
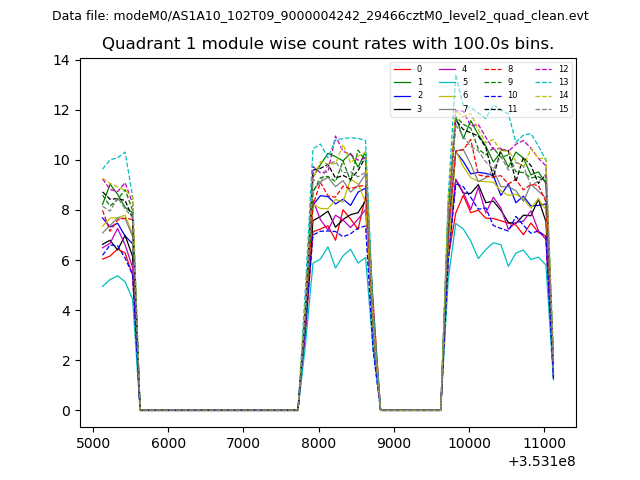
| Module-wise count rates for Quadrant A Data is divided into 100 sec bins |
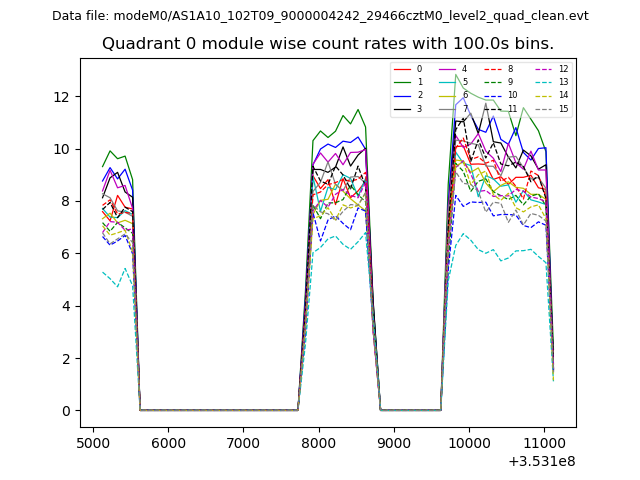 |
 |
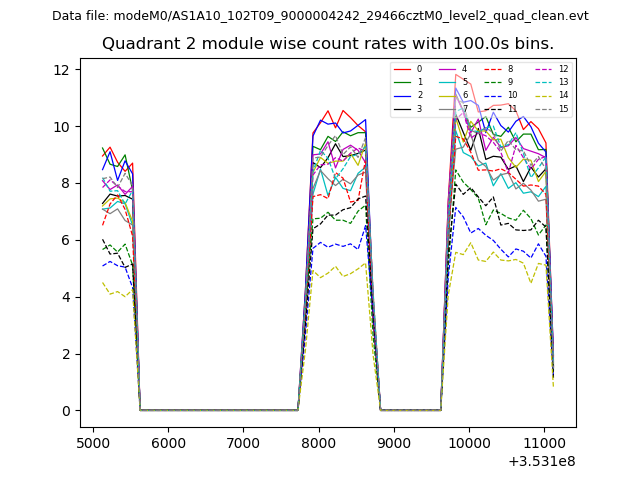
| Module-wise count rates for Quadrant B Data is divided into 100 sec bins |
 |
 |
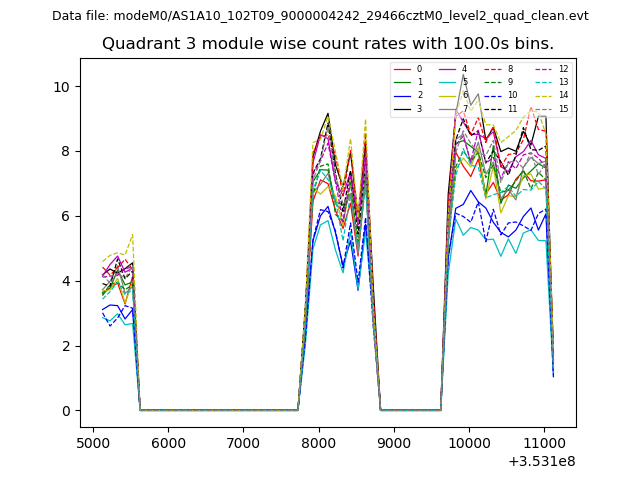
| Module-wise count rates for Quadrant C Data is divided into 100 sec bins |
 |
 |
| Module-wise count rates for Quadrant D Data is divided into 100 sec bins |
 |
 |
| Parameter | Plot |
|---|---|
| CZT HV Monitor | 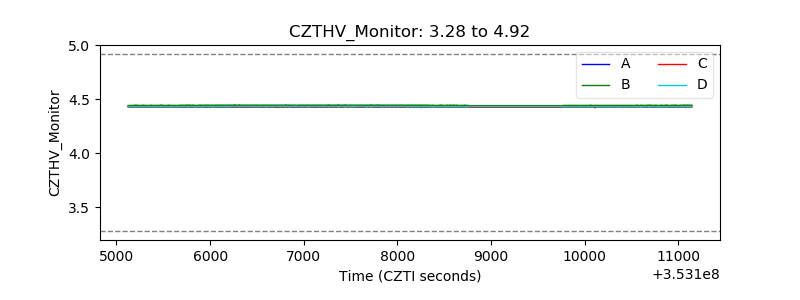 |
| D_VDD | 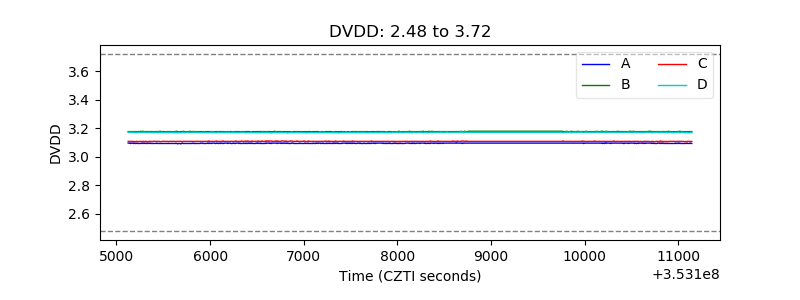 |
| Temperature 1 |  |
| Veto HV Monitor | 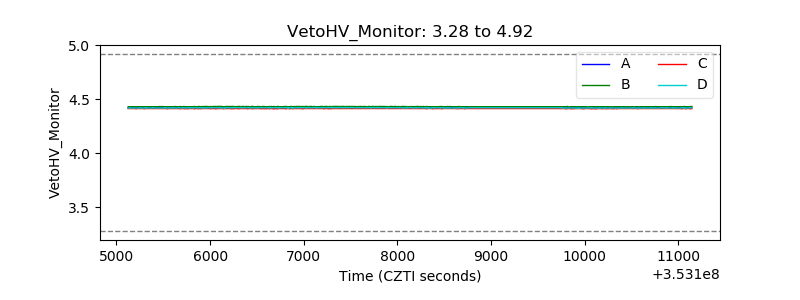 |
| Veto LLD | 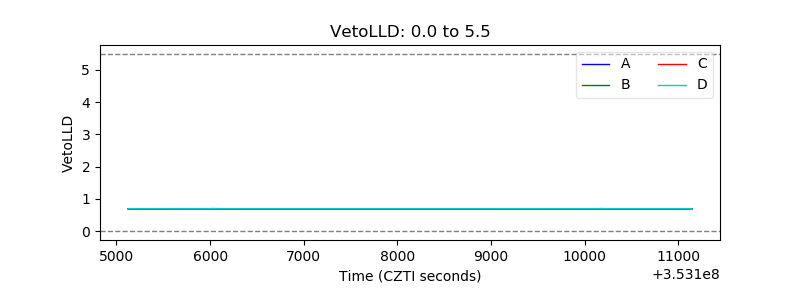 |
| Alpha Counter | 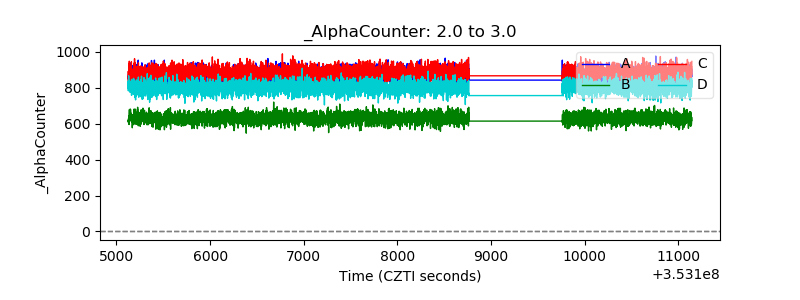 |
| _CPM_Rate | 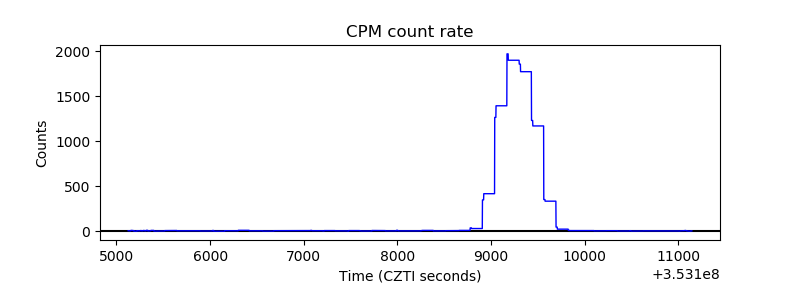 |
| CZT Counter | 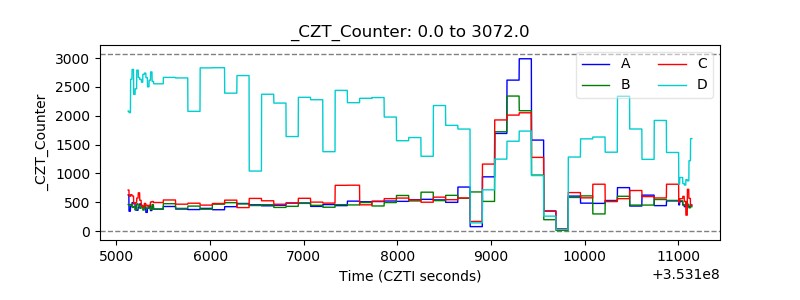 |
| +2.5 Volts monitor |  |
| +5 Volts monitor |  |
| _ROLL_ROT | 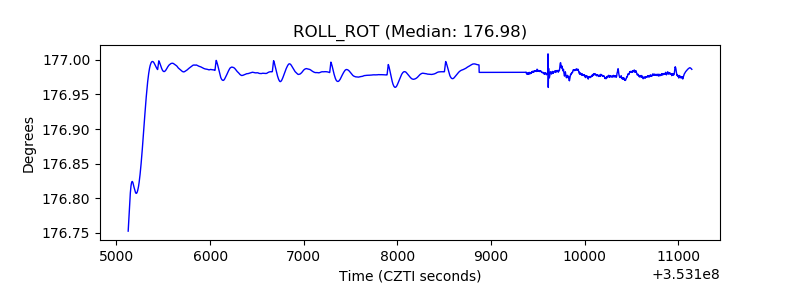 |
| _Roll_DEC |  |
| _Roll_RA | 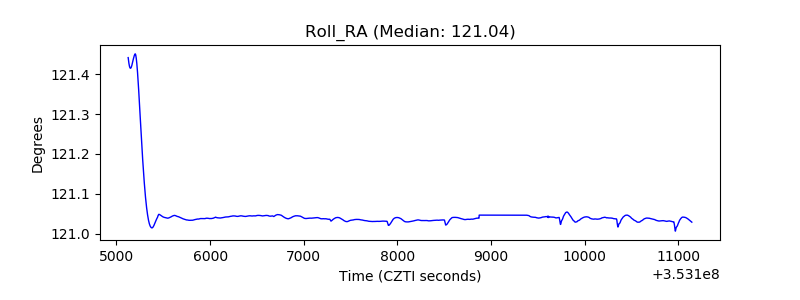 |
| Veto Counter | 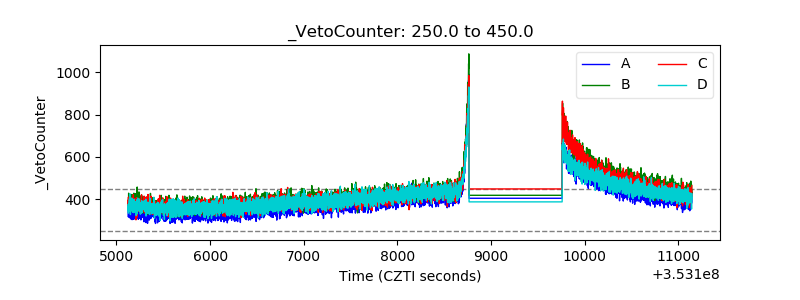 |