| Param | Original file | Final file |
|---|---|---|
| Filename | modeM0/AS1A10_102T09_9000004242_29471cztM0_level2.evt | modeM0/AS1A10_102T09_9000004242_29471cztM0_level2_quad_clean.evt |
| Size (bytes) | 1,236,674,880 | 115,191,360 |
| Size | 1.2 GB | 109.9 MB |
| Events in quadrant A | 5,668,474 | 739,479 |
| Events in quadrant B | 5,793,992 | 758,280 |
| Events in quadrant C | 6,735,616 | 698,039 |
| Events in quadrant D | 18,549,833 | 565,533 |
| Mode SS | |||
|---|---|---|---|
| Quadrant | BADHDUFLAG | Total packets | Discarded packets |
| A | 0 | 219 | 11 |
| B | 0 | 220 | 10 |
| C | 0 | 221 | 9 |
| D | 0 | 220 | 10 |
| Mode M9 | |||
|---|---|---|---|
| Quadrant | BADHDUFLAG | Total packets | Discarded packets |
| A | 0 | 27 | 0 |
| B | 0 | 27 | 0 |
| C | 0 | 27 | 0 |
| D | 0 | 27 | 0 |
| Mode M0 | |||
|---|---|---|---|
| Quadrant | BADHDUFLAG | Total packets | Discarded packets |
| A | 0 | 23341 | 612 |
| B | 0 | 23799 | 616 |
| C | 0 | 28097 | 703 |
| D | 0 | 65398 | 3037 |
| Quadrant | Total seconds | Saturated seconds | Saturation percentage |
|---|---|---|---|
| A | 10520 | 50 | 0.475285% |
| B | 10525 | 89 | 0.845606% |
| C | 10519 | 519 | 4.933929% |
| D | 10421 | 3711 | 35.610786% |
Noise dominated data is calculated using 1-second bins in cleaned event files. If a bin has >2000 counts, and if more than 50% of those come from <1% of pixels, then it is considered to be noise-dominated and hence unusable.
| Quadrant | # 1 sec bins | Bins with >0 counts | Bins with >2000 counts | High rate bins dominated by noise | Noise dominated (total time) | Noise dominated (detector-on time) | Marked lightcurve |
|---|---|---|---|---|---|---|---|
| A | 13539 | 10586 | 1 | 1 | 0.01% | 0.01% | 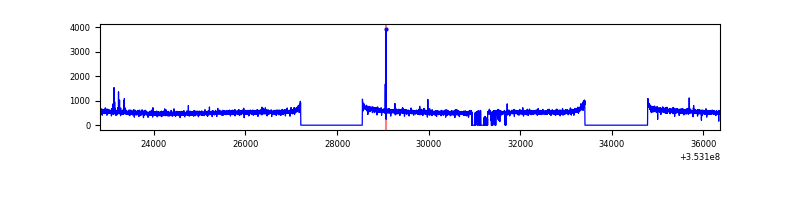 |
| B | 13540 | 10577 | 3 | 3 | 0.02% | 0.03% | 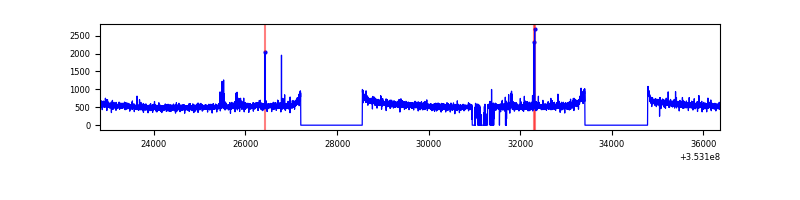 |
| C | 13540 | 10578 | 0 | 0 | 0.00% | 0.00% | 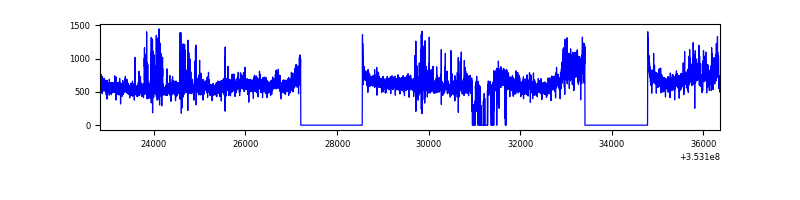 |
| D | 13540 | 10463 | 3540 | 3540 | 26.14% | 33.83% | 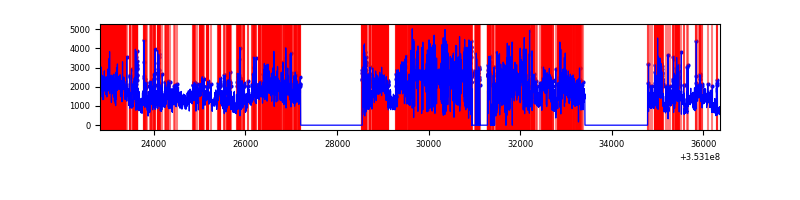 |
Top three noisy pixels from each quadrant. If the there are fewer than three noisy pixels in the level2.evt file, extra rows are filled as -1
| Pixel properties | Quadrant properties | ||||||
|---|---|---|---|---|---|---|---|
| Quadrant | DetID | PixID | Counts | Sigma | Mean | Median | Sigma |
| A | 12 | 96 | 28688 | 94.24 | 1463 | 1436 | 289.2 |
| A | 13 | 254 | 19680 | 63.09 | 1463 | 1436 | 289.2 |
| A | 3 | 137 | 12943 | 39.79 | 1463 | 1436 | 289.2 |
| B | 12 | 111 | 31837 | 111.24 | 1467 | 1437 | 273.3 |
| B | 11 | 111 | 29424 | 102.41 | 1467 | 1437 | 273.3 |
| B | 14 | 111 | 26809 | 92.85 | 1467 | 1437 | 273.3 |
| C | 3 | 233 | 894151 | 2846.35 | 1359 | 1372 | 313.7 |
| C | 14 | 238 | 347526 | 1103.61 | 1359 | 1372 | 313.7 |
| C | 14 | 254 | 170668 | 539.75 | 1359 | 1372 | 313.7 |
| D | 8 | 195 | 8499738 | 31043.72 | 1161 | 1131 | 273.8 |
| D | 7 | 80 | 4613902 | 16849.54 | 1161 | 1131 | 273.8 |
| D | 1 | 52 | 614523 | 2240.6 | 1161 | 1131 | 273.8 |
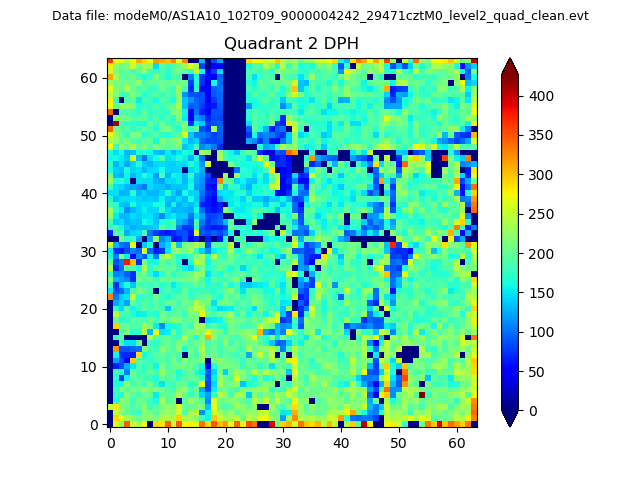
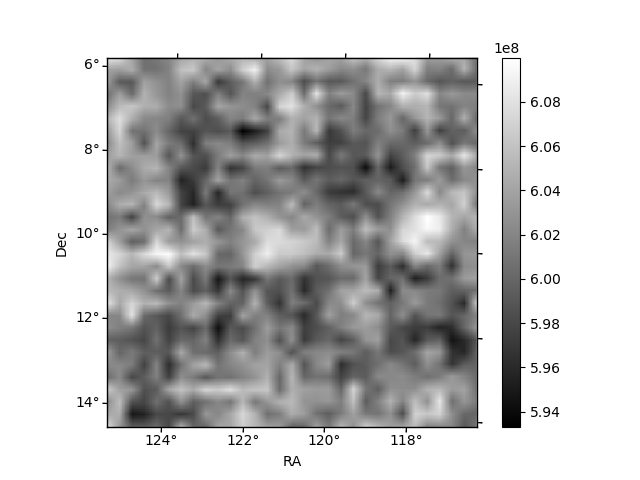
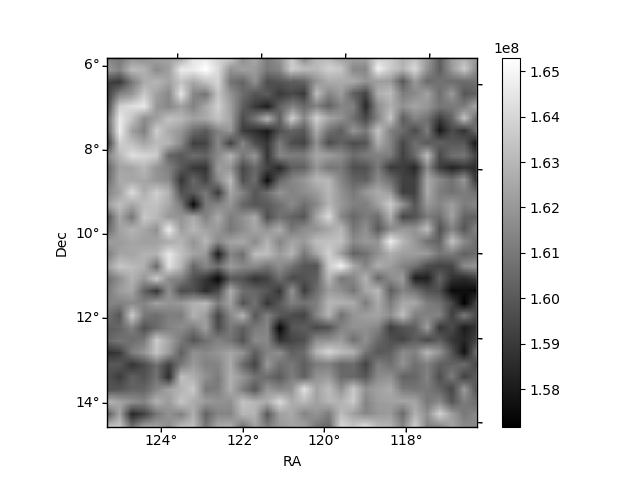
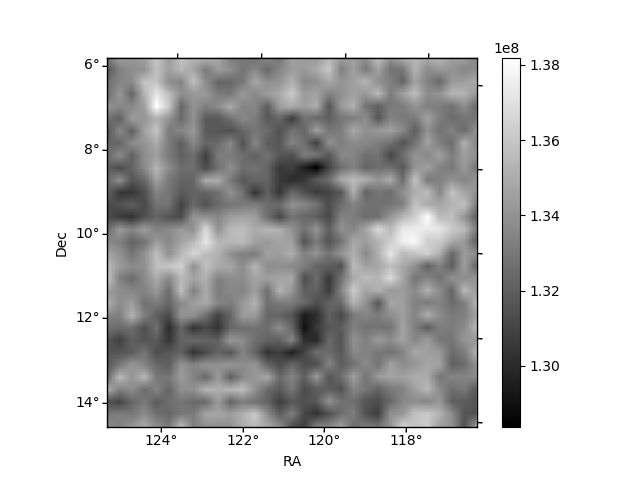
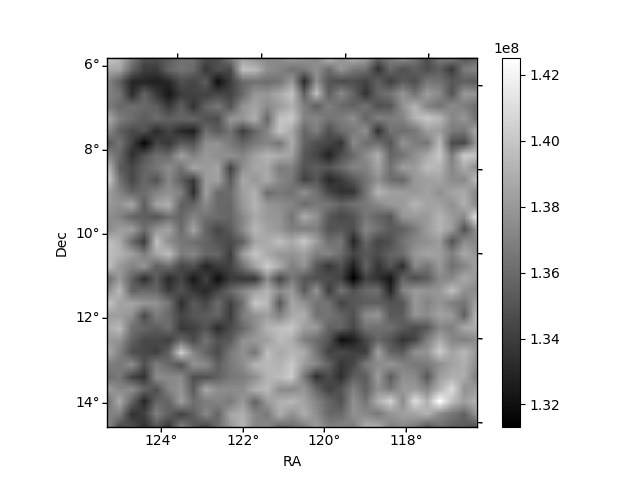
Histogram calculated using DETX and DETY for each event in the final _common_clean file
| Quadrant A | 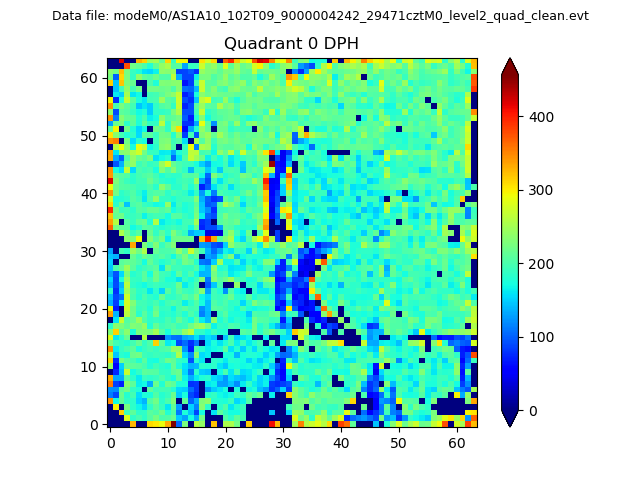 |
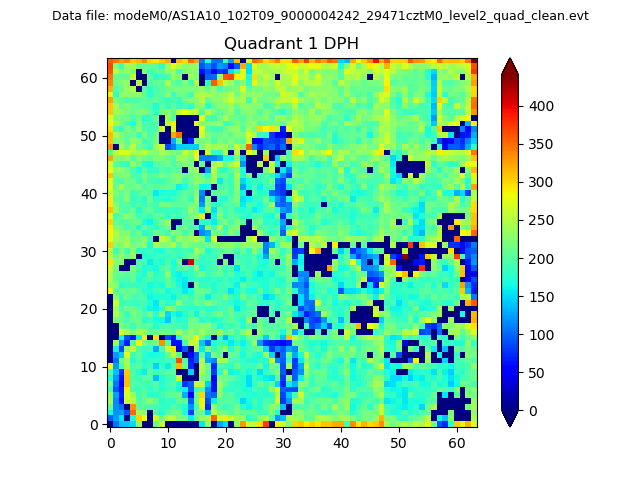 |
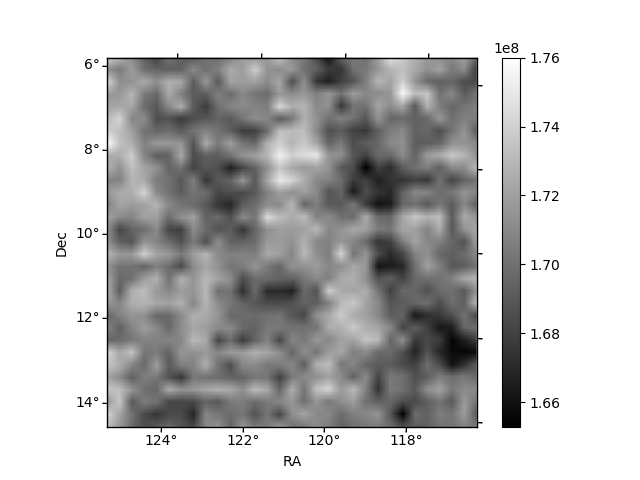
Quadrant B |
|---|---|---|---|
| Quadrant D | 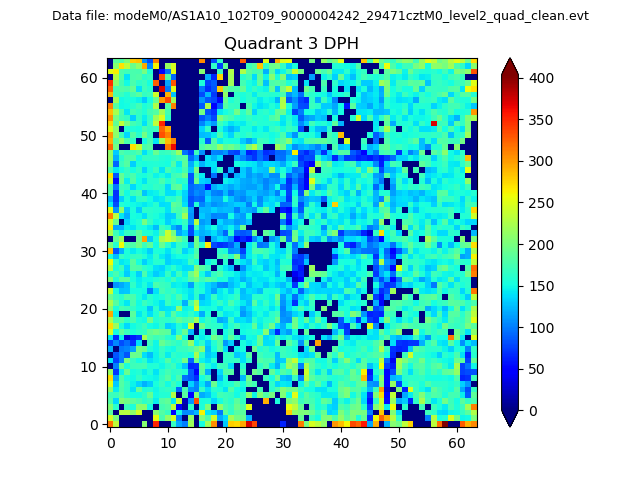 |
 |
Quadrant C |
| Plot type | Count rate plots | Images |
|---|---|---|
| Comparison with Poisson distribution Blue bars denote a histogram of data divided into 1 sec bins. Red curve is a Poisson curve with rate = median count rate of data. |
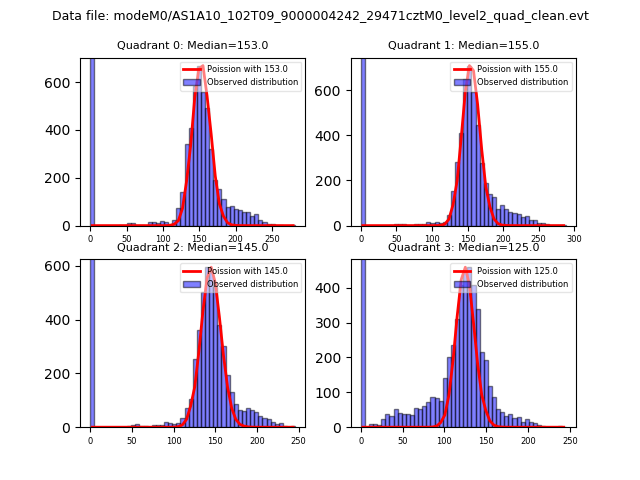 |
 |
| Quadrant-wise count rates Data is divided into 100 sec bins |
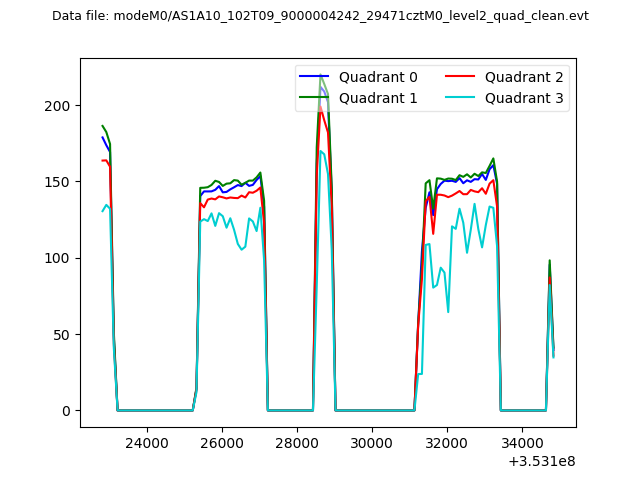 |
|
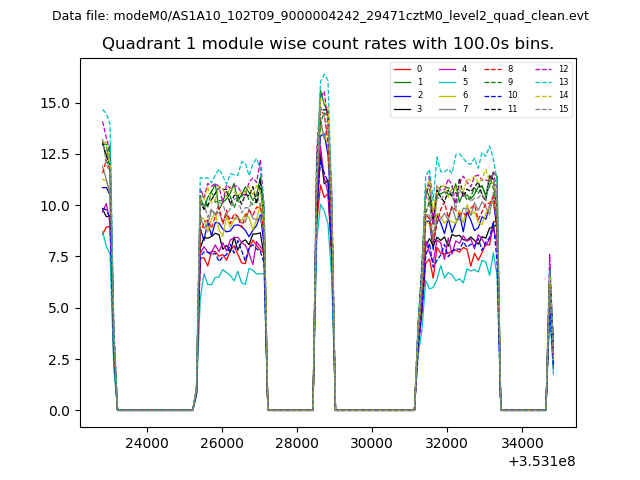
| Module-wise count rates for Quadrant A Data is divided into 100 sec bins |
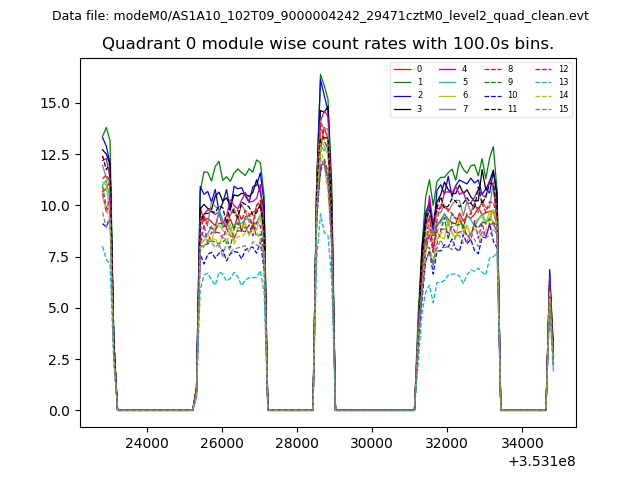 |
 |
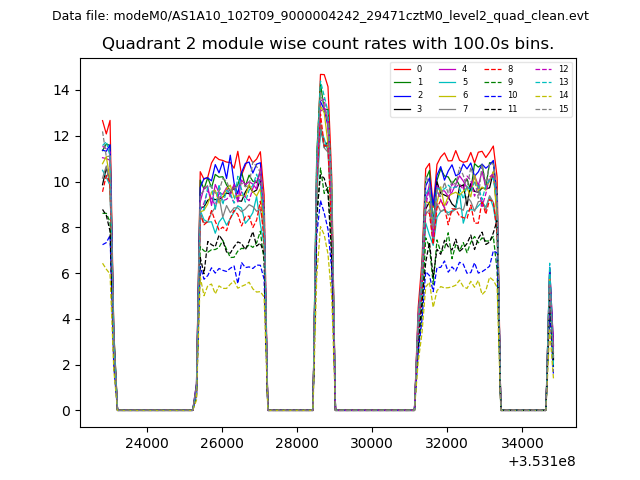
| Module-wise count rates for Quadrant B Data is divided into 100 sec bins |
 |
 |
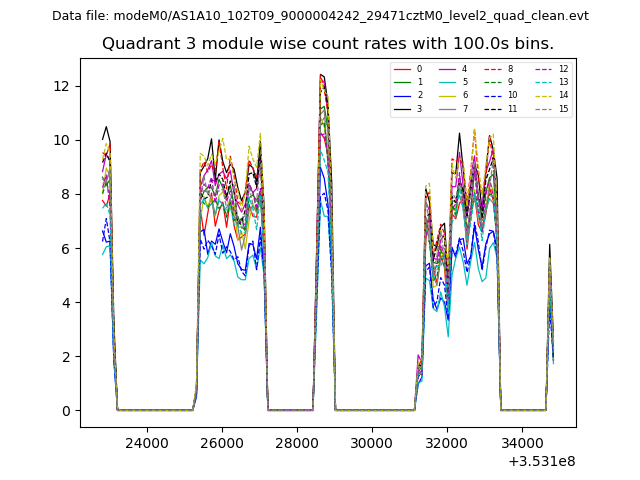
| Module-wise count rates for Quadrant C Data is divided into 100 sec bins |
 |
 |
| Module-wise count rates for Quadrant D Data is divided into 100 sec bins |
 |
 |
| Parameter | Plot |
|---|---|
| CZT HV Monitor | 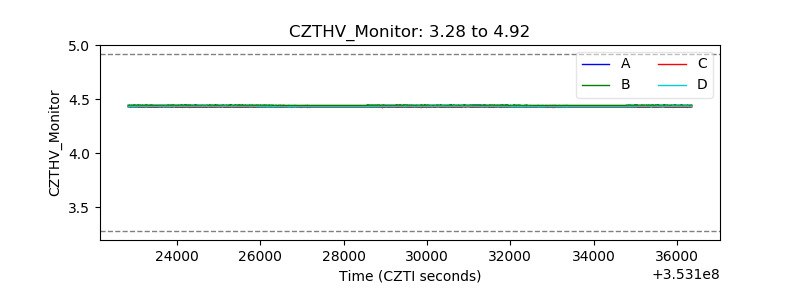 |
| D_VDD | 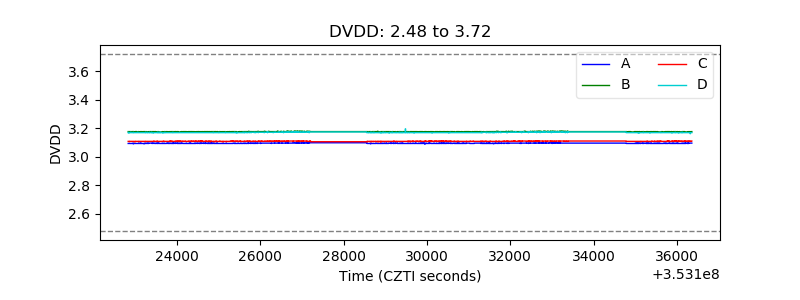 |
| Temperature 1 | 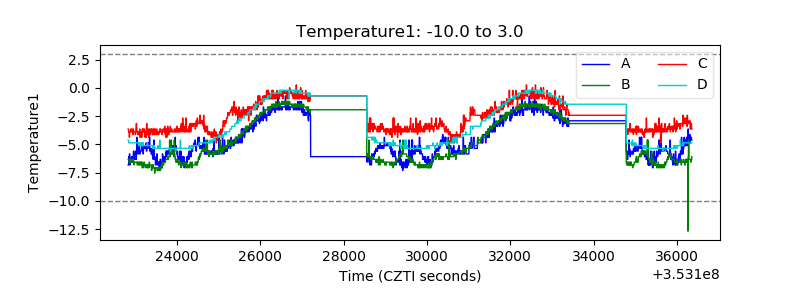 |
| Veto HV Monitor | 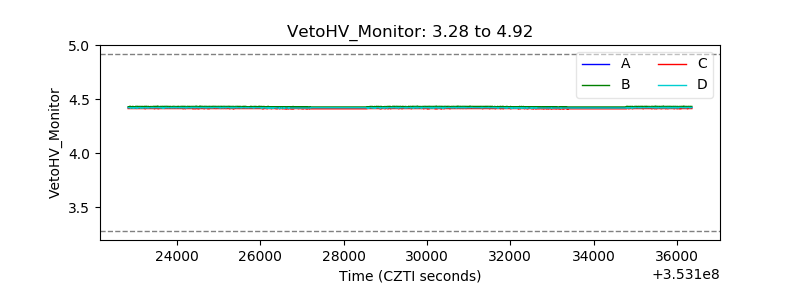 |
| Veto LLD | 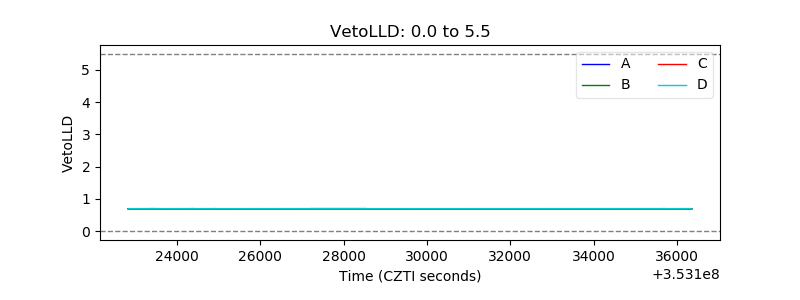 |
| Alpha Counter | 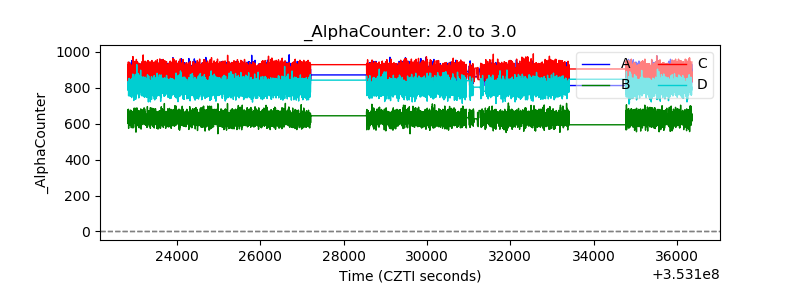 |
| _CPM_Rate | 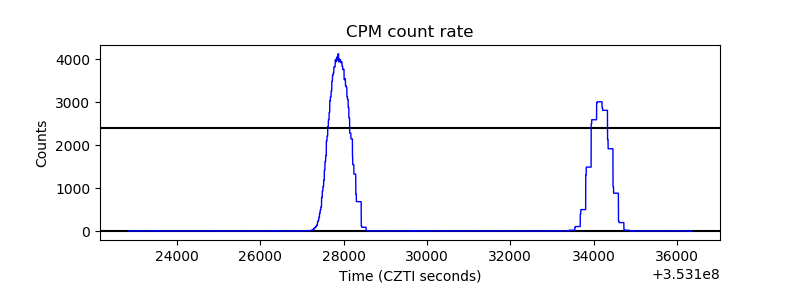 |
| CZT Counter | 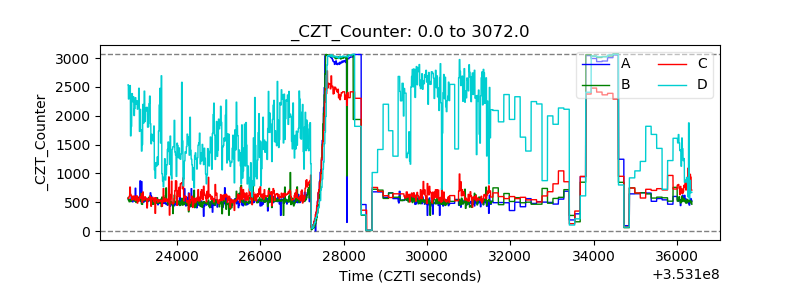 |
| +2.5 Volts monitor |  |
| +5 Volts monitor |  |
| _ROLL_ROT | 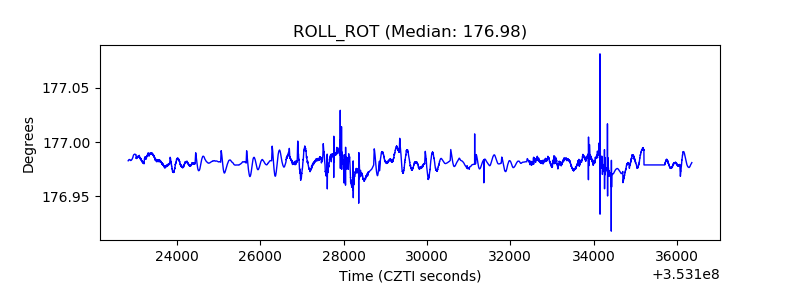 |
| _Roll_DEC | 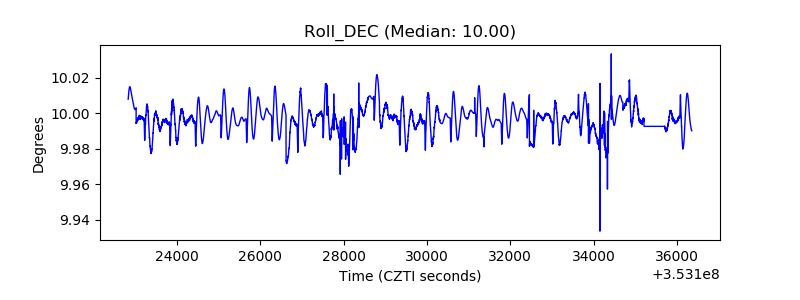 |
| _Roll_RA | 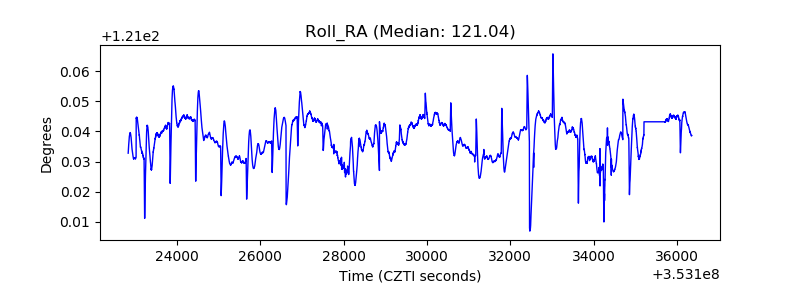 |
| Veto Counter | 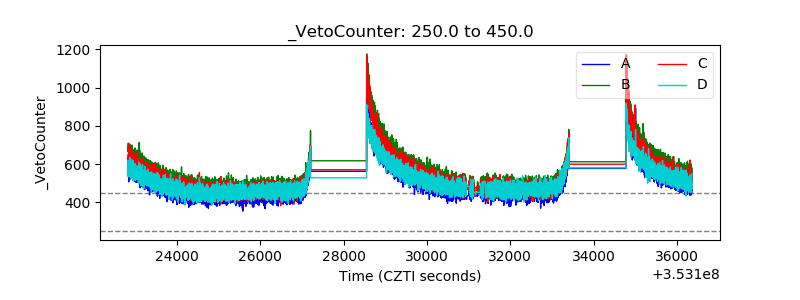 |