| Param | Original file | Final file |
|---|---|---|
| Filename | modeM0/AS1A10_102T09_9000004242_29473cztM0_level2.evt | modeM0/AS1A10_102T09_9000004242_29473cztM0_level2_quad_clean.evt |
| Size (bytes) | 1,199,315,520 | 130,633,920 |
| Size | 1.1 GB | 124.6 MB |
| Events in quadrant A | 5,774,998 | 858,806 |
| Events in quadrant B | 6,024,596 | 877,383 |
| Events in quadrant C | 7,201,810 | 808,634 |
| Events in quadrant D | 16,587,288 | 655,672 |
| Mode SS | |||
|---|---|---|---|
| Quadrant | BADHDUFLAG | Total packets | Discarded packets |
| A | 0 | 222 | 0 |
| B | 0 | 222 | 0 |
| C | 0 | 222 | 0 |
| D | 0 | 222 | 0 |
| Mode M9 | |||
|---|---|---|---|
| Quadrant | BADHDUFLAG | Total packets | Discarded packets |
| A | 0 | 24 | 0 |
| B | 0 | 24 | 0 |
| C | 0 | 24 | 0 |
| D | 0 | 24 | 0 |
| Mode M0 | |||
|---|---|---|---|
| Quadrant | BADHDUFLAG | Total packets | Discarded packets |
| A | 0 | 23137 | 2 |
| B | 0 | 24019 | 2 |
| C | 0 | 28794 | 2 |
| D | 0 | 56977 | 2 |
| Quadrant | Total seconds | Saturated seconds | Saturation percentage |
|---|---|---|---|
| A | 10898 | 173 | 1.587447% |
| B | 10899 | 235 | 2.156161% |
| C | 10899 | 427 | 3.917791% |
| D | 10899 | 2503 | 22.965410% |
Noise dominated data is calculated using 1-second bins in cleaned event files. If a bin has >2000 counts, and if more than 50% of those come from <1% of pixels, then it is considered to be noise-dominated and hence unusable.
| Quadrant | # 1 sec bins | Bins with >0 counts | Bins with >2000 counts | High rate bins dominated by noise | Noise dominated (total time) | Noise dominated (detector-on time) | Marked lightcurve |
|---|---|---|---|---|---|---|---|
| A | 13258 | 10900 | 0 | 0 | 0.00% | 0.00% | 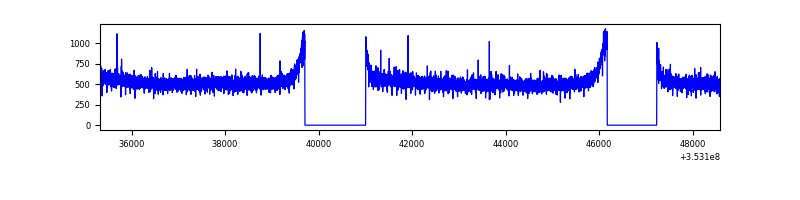 |
| B | 13259 | 10901 | 11 | 11 | 0.08% | 0.10% | 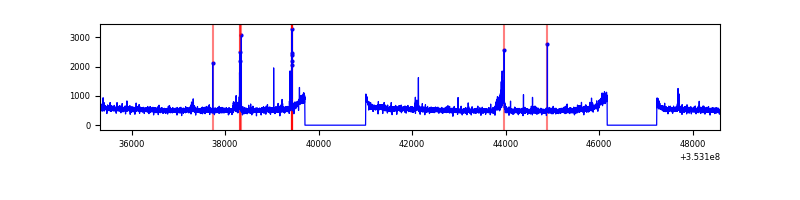 |
| C | 13259 | 10901 | 17 | 17 | 0.13% | 0.16% | 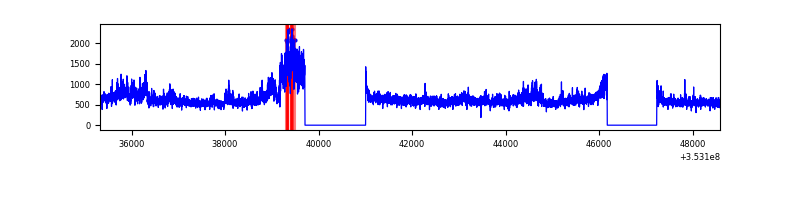 |
| D | 13259 | 10900 | 2281 | 2281 | 17.20% | 20.93% | 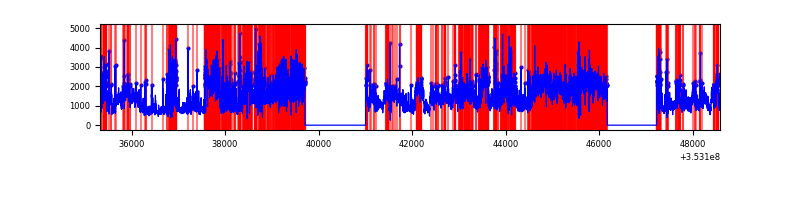 |
Top three noisy pixels from each quadrant. If the there are fewer than three noisy pixels in the level2.evt file, extra rows are filled as -1
| Pixel properties | Quadrant properties | ||||||
|---|---|---|---|---|---|---|---|
| Quadrant | DetID | PixID | Counts | Sigma | Mean | Median | Sigma |
| A | 13 | 254 | 20647 | 64.67 | 1497 | 1473 | 296.5 |
| A | 3 | 137 | 13812 | 41.62 | 1497 | 1473 | 296.5 |
| A | 0 | 226 | 12821 | 38.27 | 1497 | 1473 | 296.5 |
| B | 15 | 33 | 74902 | 265.0 | 1487 | 1457 | 277.1 |
| B | 0 | 156 | 40599 | 141.23 | 1487 | 1457 | 277.1 |
| B | 5 | 255 | 37566 | 130.29 | 1487 | 1457 | 277.1 |
| C | 3 | 233 | 1485518 | 4569.97 | 1402 | 1417 | 324.8 |
| C | 14 | 238 | 227291 | 695.53 | 1402 | 1417 | 324.8 |
| C | 2 | 114 | 26275 | 76.54 | 1402 | 1417 | 324.8 |
| D | 8 | 195 | 8309831 | 27150.92 | 1292 | 1263 | 306.0 |
| D | 7 | 80 | 1691012 | 5521.8 | 1292 | 1263 | 306.0 |
| D | 1 | 52 | 1031372 | 3366.21 | 1292 | 1263 | 306.0 |
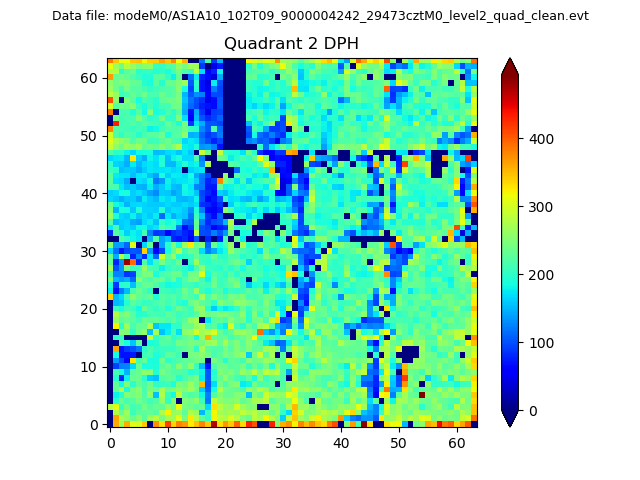
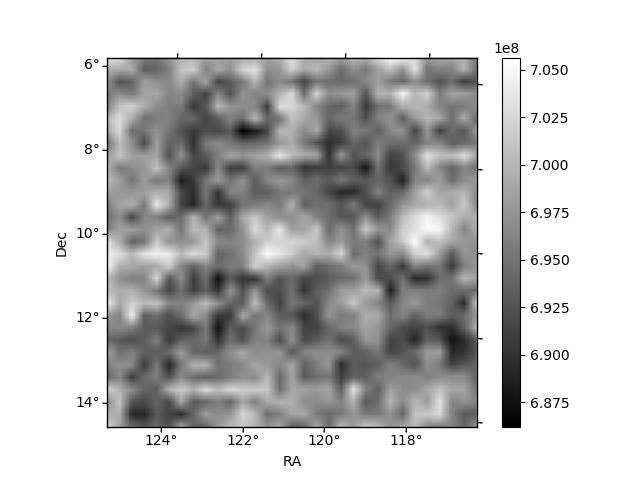
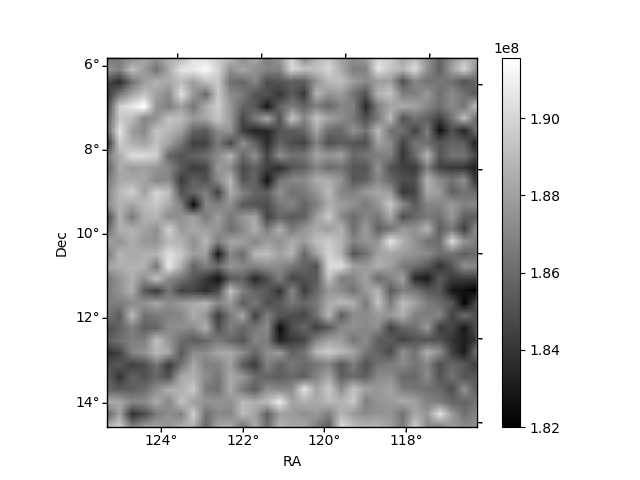
Histogram calculated using DETX and DETY for each event in the final _common_clean file
| Quadrant A | 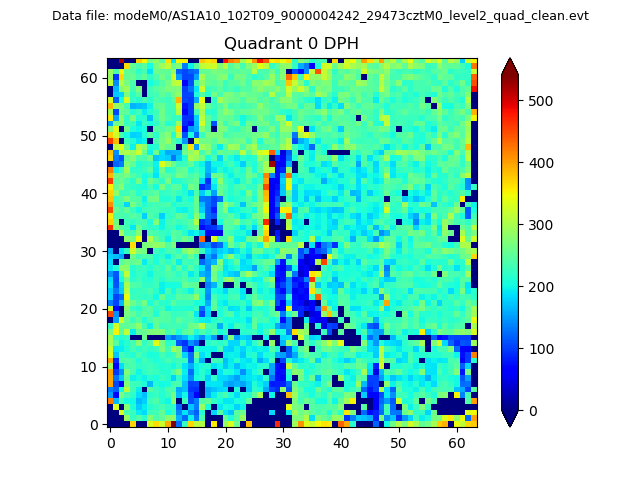 |
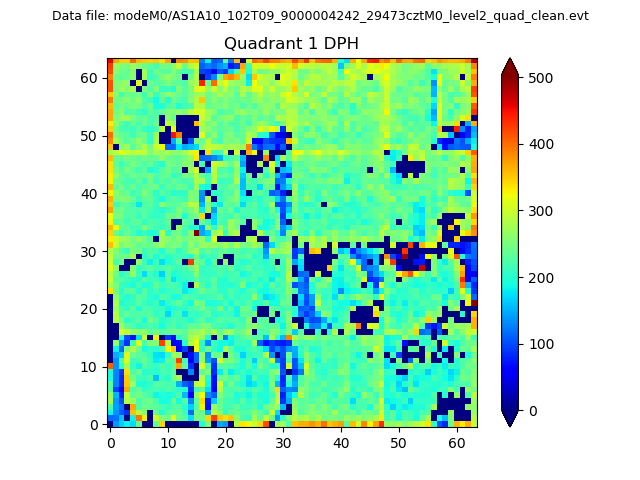 |
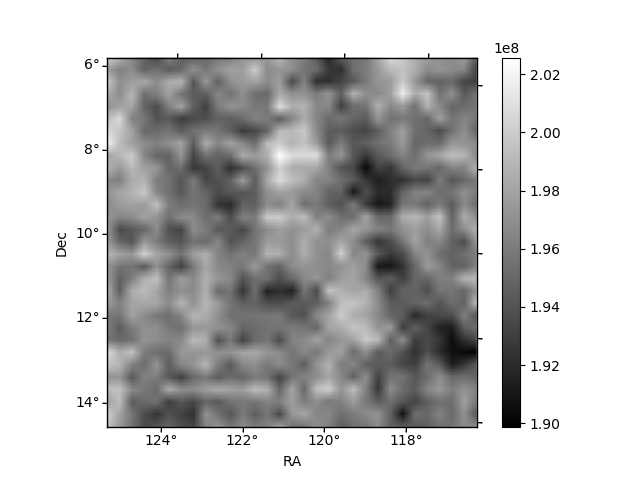
Quadrant B |
|---|---|---|---|
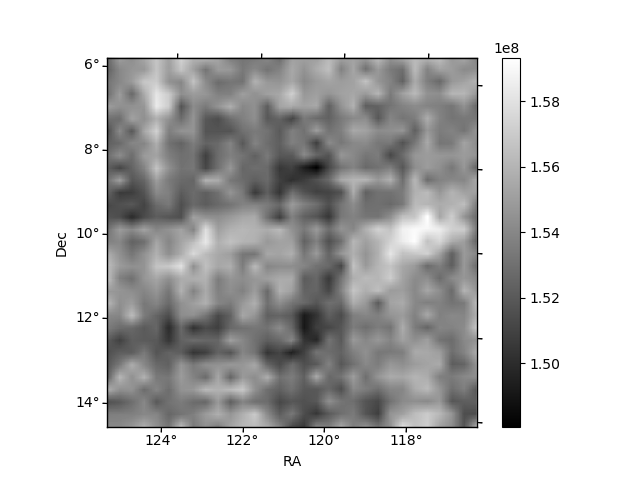
| Quadrant D | 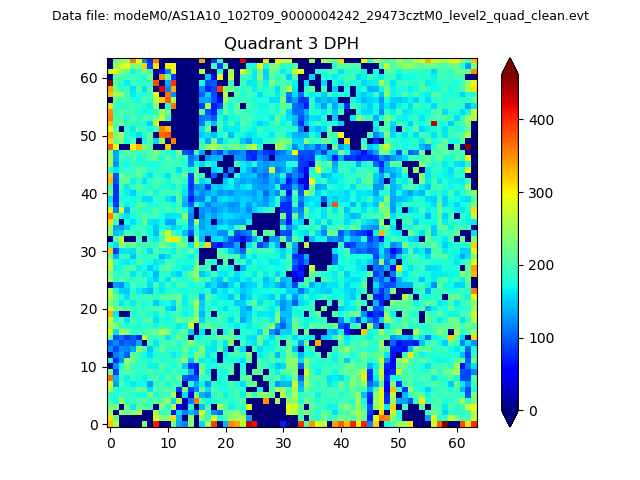 |
 |
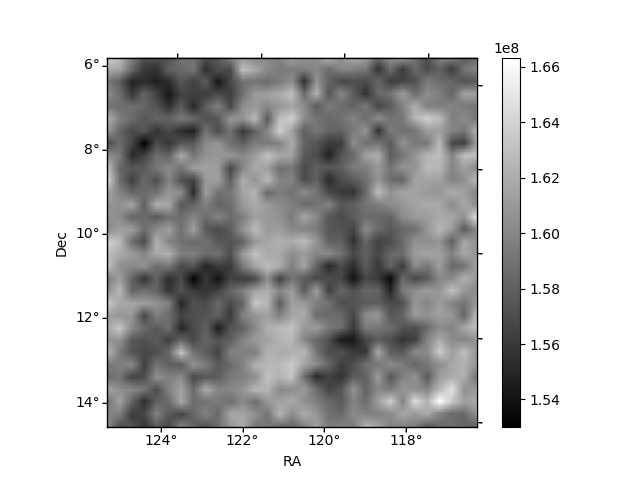
Quadrant C |
| Plot type | Count rate plots | Images |
|---|---|---|
| Comparison with Poisson distribution Blue bars denote a histogram of data divided into 1 sec bins. Red curve is a Poisson curve with rate = median count rate of data. |
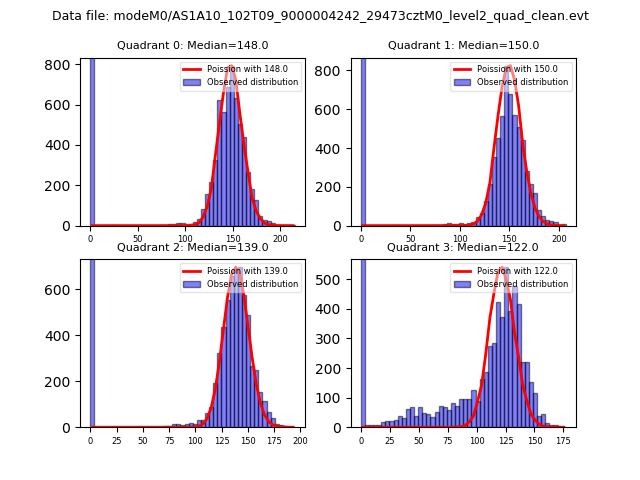 |
 |
| Quadrant-wise count rates Data is divided into 100 sec bins |
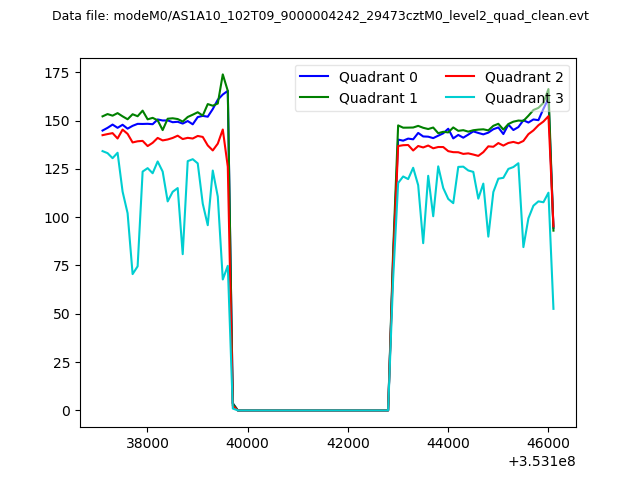 |
|
| Module-wise count rates for Quadrant A Data is divided into 100 sec bins |
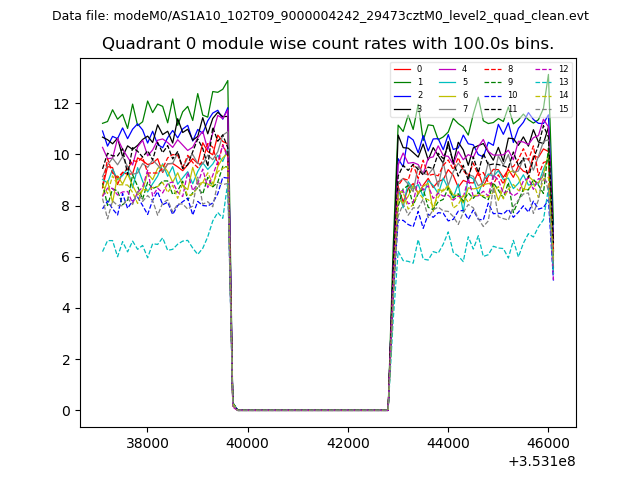 |
 |
| Module-wise count rates for Quadrant B Data is divided into 100 sec bins |
 |
 |
| Module-wise count rates for Quadrant C Data is divided into 100 sec bins |
 |
 |
| Module-wise count rates for Quadrant D Data is divided into 100 sec bins |
 |
 |
| Parameter | Plot |
|---|---|
| CZT HV Monitor | 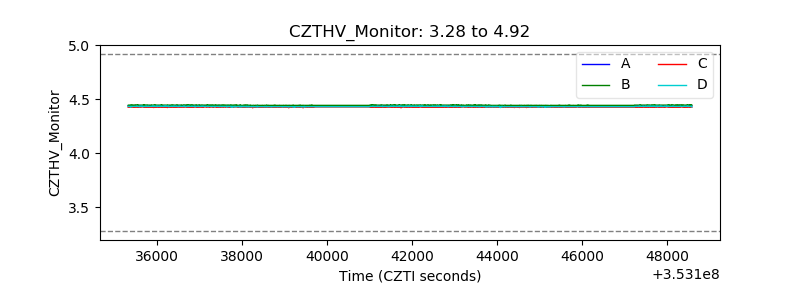 |
| D_VDD | 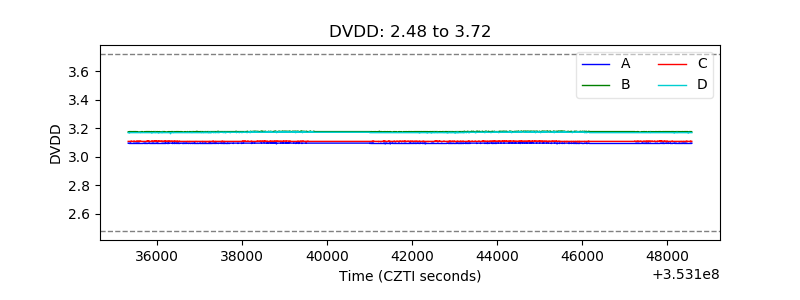 |
| Temperature 1 | 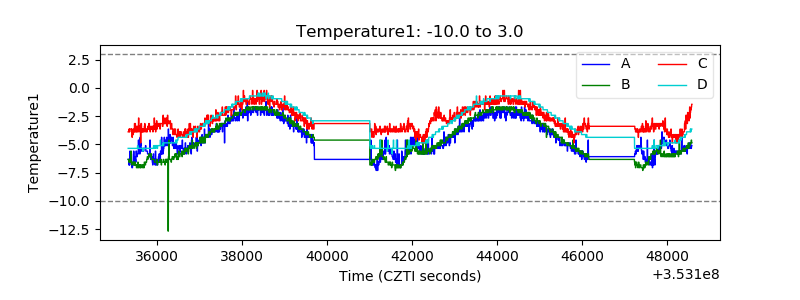 |
| Veto HV Monitor | 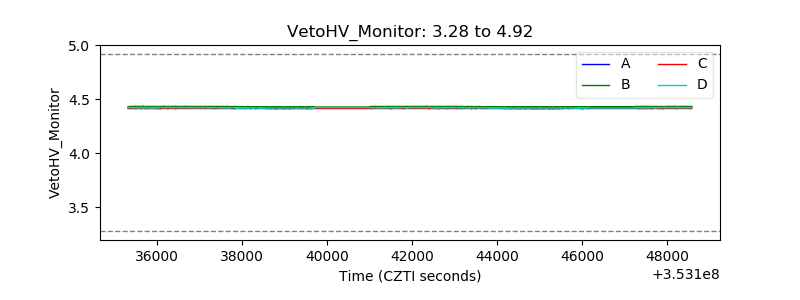 |
| Veto LLD |  |
| Alpha Counter | 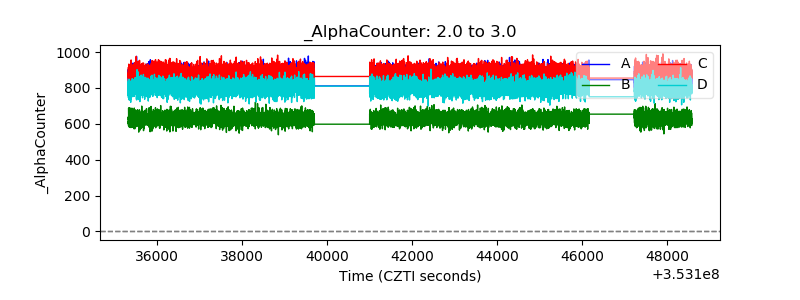 |
| _CPM_Rate | 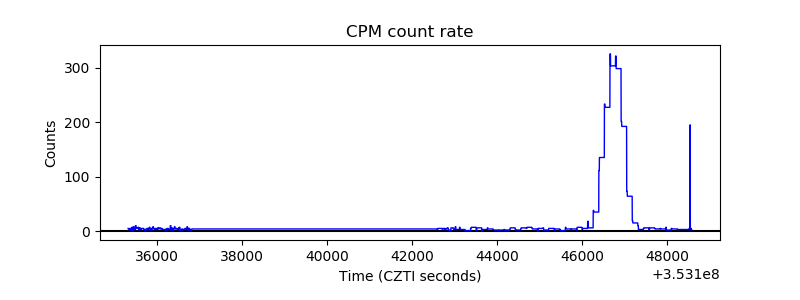 |
| CZT Counter | 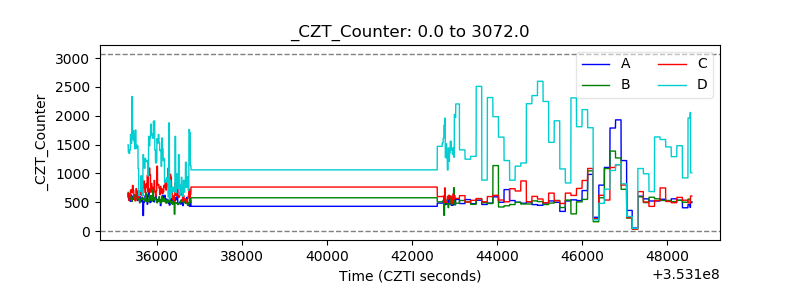 |
| +2.5 Volts monitor |  |
| +5 Volts monitor |  |
| _ROLL_ROT | 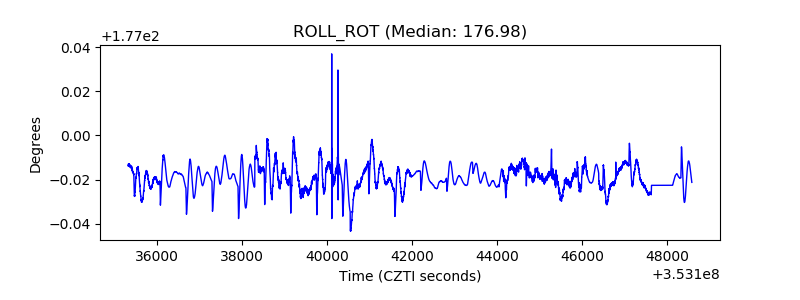 |
| _Roll_DEC | 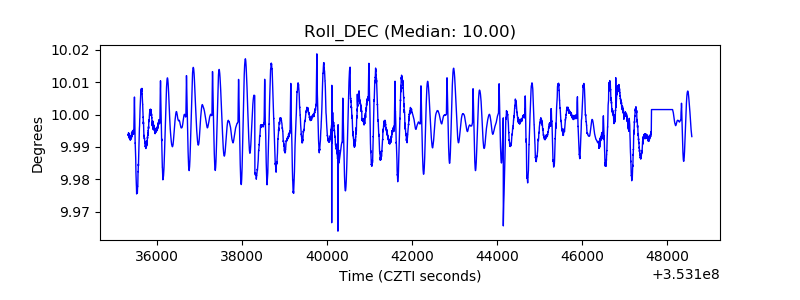 |
| _Roll_RA | 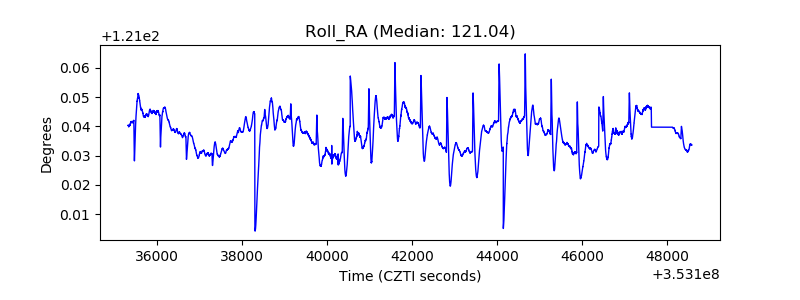 |
| Veto Counter |  |