| Param | Original file | Final file |
|---|---|---|
| Filename | modeM0/AS1A10_102T09_9000004242_29474cztM0_level2.evt | modeM0/AS1A10_102T09_9000004242_29474cztM0_level2_quad_clean.evt |
| Size (bytes) | 818,683,200 | 87,091,200 |
| Size | 780.8 MB | 83.1 MB |
| Events in quadrant A | 3,797,120 | 568,636 |
| Events in quadrant B | 3,870,524 | 577,016 |
| Events in quadrant C | 4,089,713 | 545,218 |
| Events in quadrant D | 12,538,325 | 431,985 |
| Mode SS | |||
|---|---|---|---|
| Quadrant | BADHDUFLAG | Total packets | Discarded packets |
| A | 0 | 150 | 0 |
| B | 0 | 150 | 0 |
| C | 0 | 150 | 0 |
| D | 0 | 150 | 0 |
| Mode M9 | |||
|---|---|---|---|
| Quadrant | BADHDUFLAG | Total packets | Discarded packets |
| A | 0 | 17 | 0 |
| B | 0 | 17 | 0 |
| C | 0 | 17 | 0 |
| D | 0 | 17 | 0 |
| Mode M0 | |||
|---|---|---|---|
| Quadrant | BADHDUFLAG | Total packets | Discarded packets |
| A | 0 | 15667 | 2 |
| B | 0 | 15832 | 2 |
| C | 0 | 16343 | 2 |
| D | 0 | 42385 | 2 |
| Quadrant | Total seconds | Saturated seconds | Saturation percentage |
|---|---|---|---|
| A | 7384 | 267 | 3.615926% |
| B | 7385 | 304 | 4.116452% |
| C | 7385 | 303 | 4.102911% |
| D | 7385 | 2556 | 34.610697% |
Noise dominated data is calculated using 1-second bins in cleaned event files. If a bin has >2000 counts, and if more than 50% of those come from <1% of pixels, then it is considered to be noise-dominated and hence unusable.
| Quadrant | # 1 sec bins | Bins with >0 counts | Bins with >2000 counts | High rate bins dominated by noise | Noise dominated (total time) | Noise dominated (detector-on time) | Marked lightcurve |
|---|---|---|---|---|---|---|---|
| A | 9039 | 7386 | 0 | 0 | 0.00% | 0.00% | 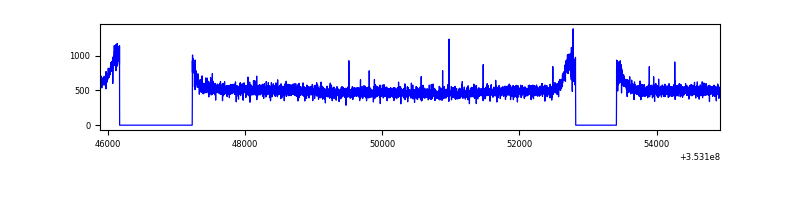 |
| B | 9040 | 7387 | 0 | 0 | 0.00% | 0.00% | 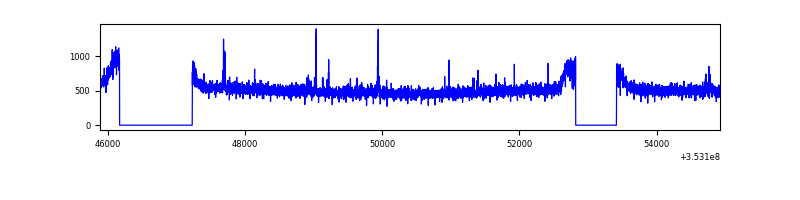 |
| C | 9040 | 7387 | 0 | 0 | 0.00% | 0.00% | 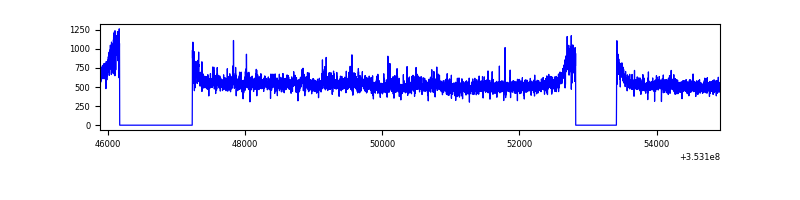 |
| D | 9040 | 7387 | 2277 | 2277 | 25.19% | 30.82% | 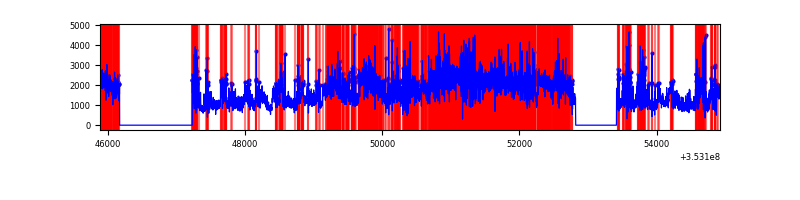 |
Top three noisy pixels from each quadrant. If the there are fewer than three noisy pixels in the level2.evt file, extra rows are filled as -1
| Pixel properties | Quadrant properties | ||||||
|---|---|---|---|---|---|---|---|
| Quadrant | DetID | PixID | Counts | Sigma | Mean | Median | Sigma |
| A | 13 | 254 | 13460 | 63.24 | 983 | 961 | 197.6 |
| A | 3 | 137 | 9745 | 44.45 | 983 | 961 | 197.6 |
| A | 0 | 226 | 8199 | 36.62 | 983 | 961 | 197.6 |
| B | 12 | 111 | 23744 | 120.05 | 974 | 948 | 189.9 |
| B | 11 | 111 | 21343 | 107.41 | 974 | 948 | 189.9 |
| B | 0 | 190 | 20891 | 105.03 | 974 | 948 | 189.9 |
| C | 3 | 233 | 283494 | 1275.52 | 935 | 941 | 221.5 |
| C | 14 | 238 | 146141 | 655.47 | 935 | 941 | 221.5 |
| C | 2 | 114 | 18181 | 77.83 | 935 | 941 | 221.5 |
| D | 8 | 195 | 6440782 | 31687.02 | 843 | 820 | 203.2 |
| D | 1 | 52 | 1107107 | 5443.35 | 843 | 820 | 203.2 |
| D | 7 | 80 | 1086352 | 5341.22 | 843 | 820 | 203.2 |
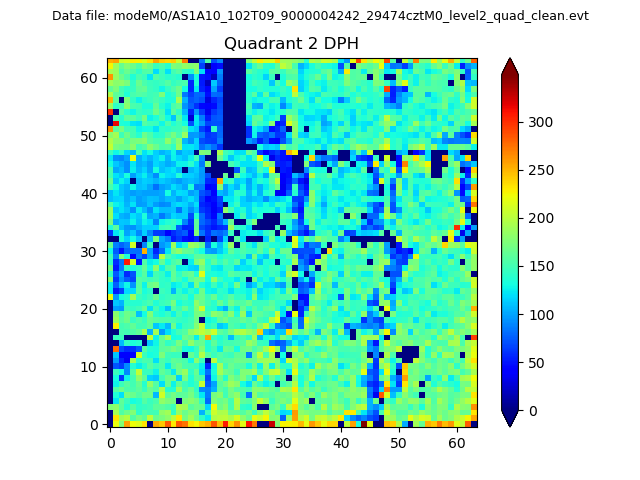
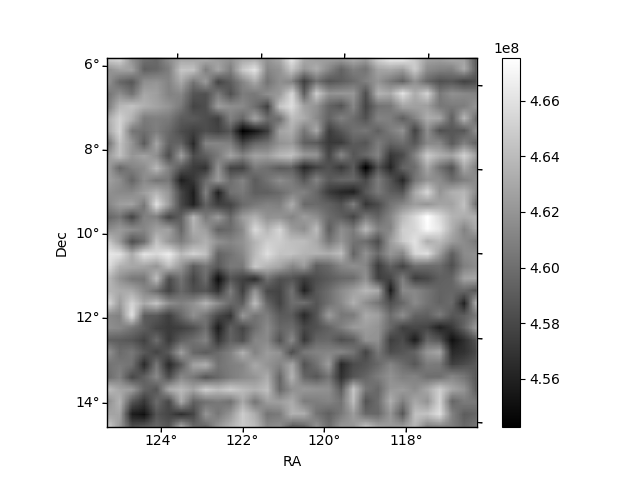
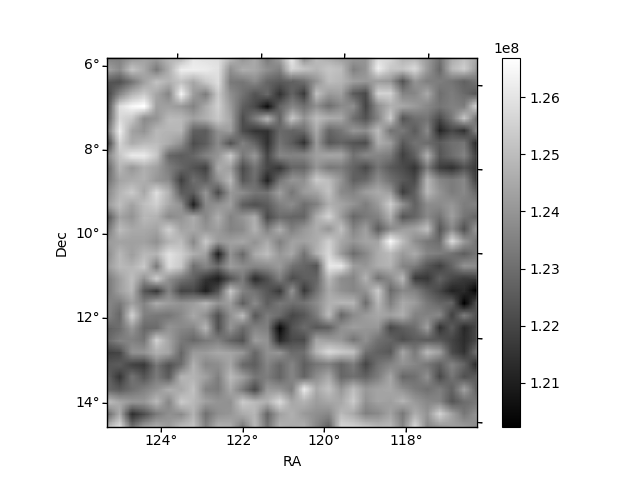
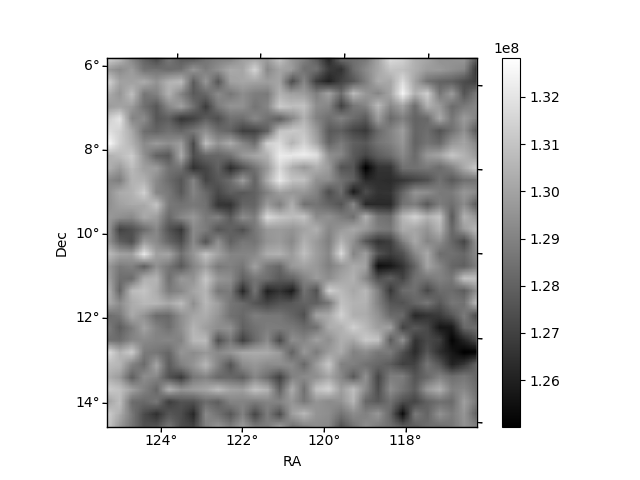
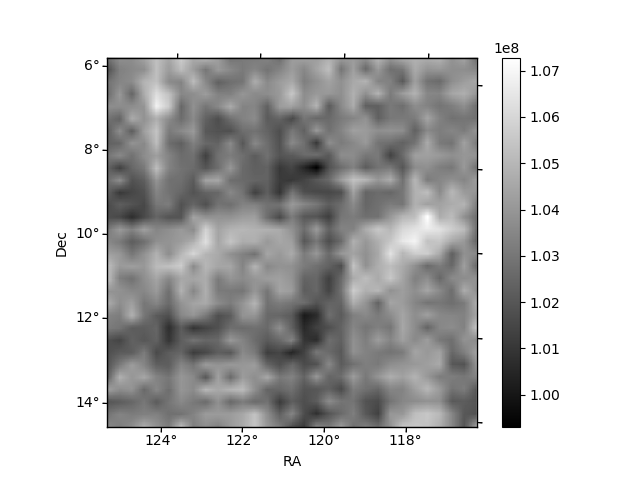
Histogram calculated using DETX and DETY for each event in the final _common_clean file
| Quadrant A | 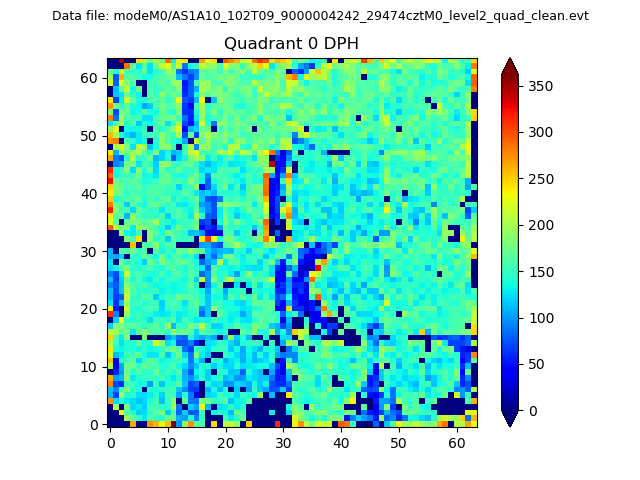 |
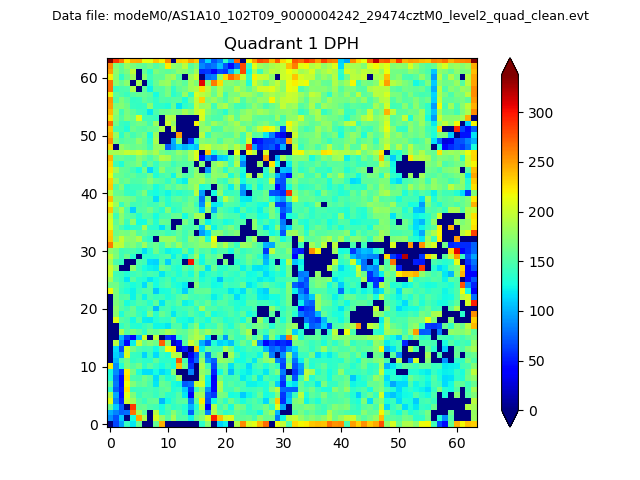 |
Quadrant B |
|---|---|---|---|
| Quadrant D | 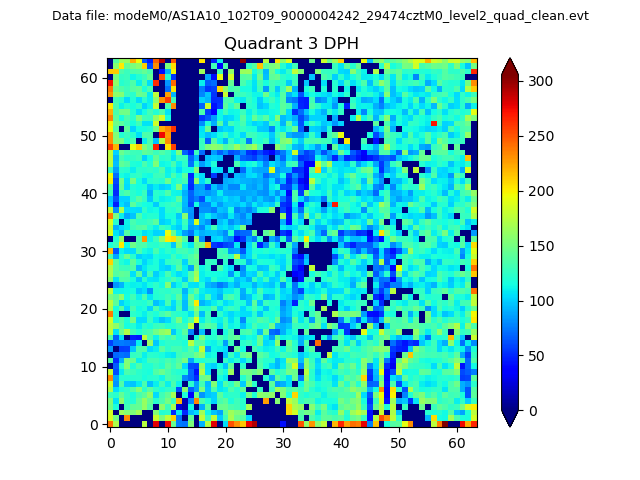 |
 |
Quadrant C |
| Plot type | Count rate plots | Images |
|---|---|---|
| Comparison with Poisson distribution Blue bars denote a histogram of data divided into 1 sec bins. Red curve is a Poisson curve with rate = median count rate of data. |
 |
 |
| Quadrant-wise count rates Data is divided into 100 sec bins |
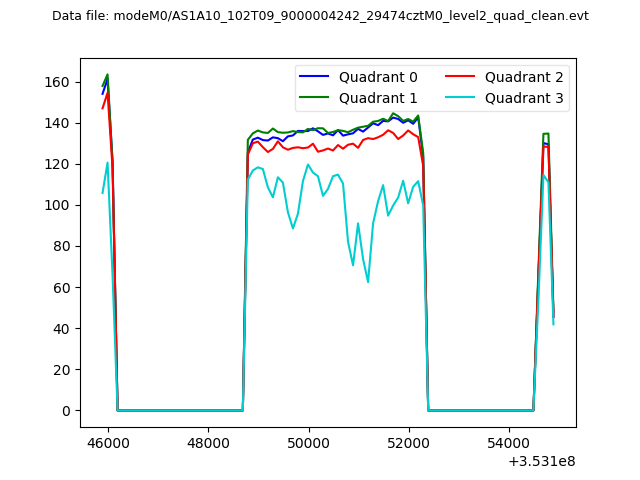 |
|
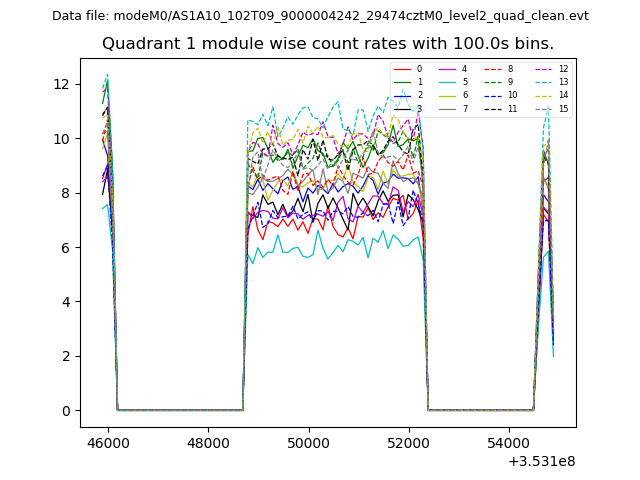
| Module-wise count rates for Quadrant A Data is divided into 100 sec bins |
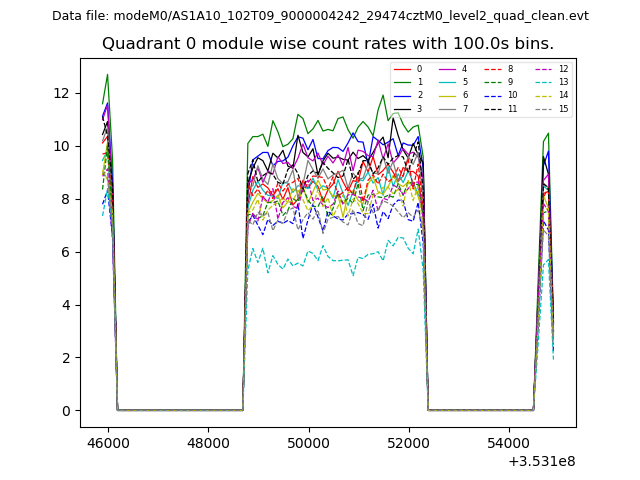 |
 |
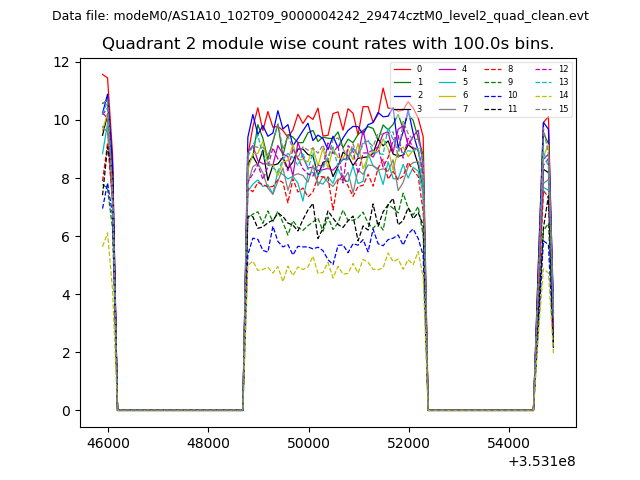
| Module-wise count rates for Quadrant B Data is divided into 100 sec bins |
 |
 |
| Module-wise count rates for Quadrant C Data is divided into 100 sec bins |
 |
 |
| Module-wise count rates for Quadrant D Data is divided into 100 sec bins |
 |
 |
| Parameter | Plot |
|---|---|
| CZT HV Monitor | 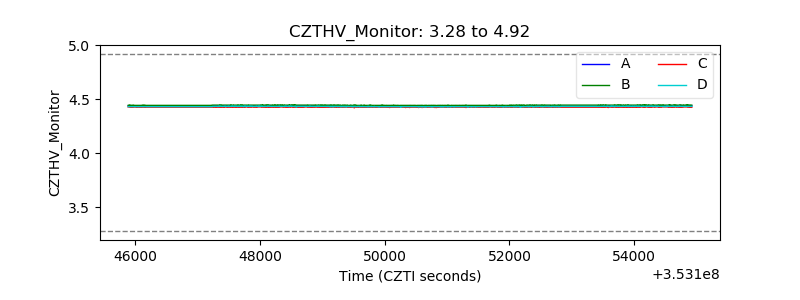 |
| D_VDD | 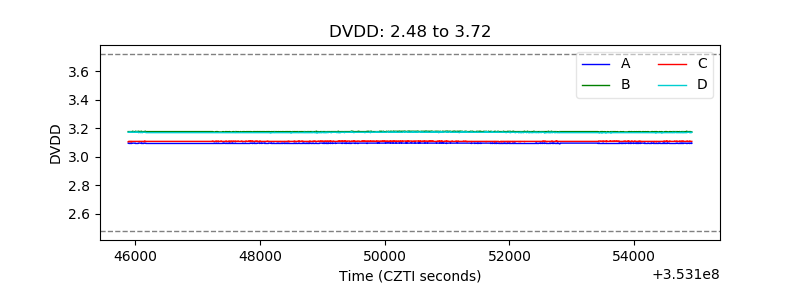 |
| Temperature 1 | 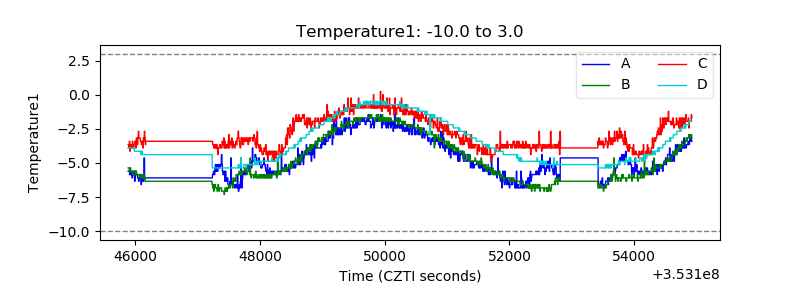 |
| Veto HV Monitor | 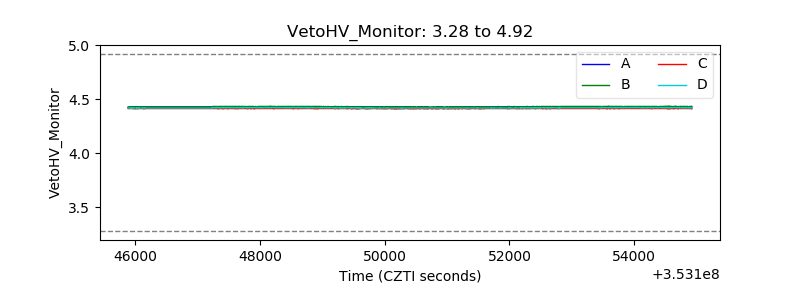 |
| Veto LLD | 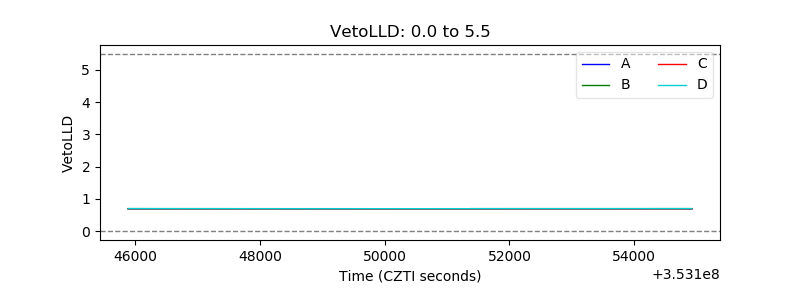 |
| Alpha Counter | 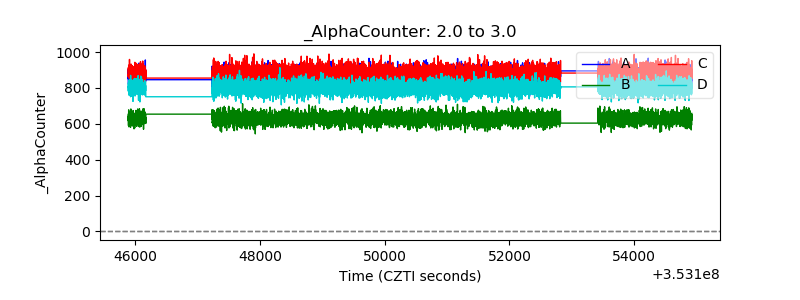 |
| _CPM_Rate | 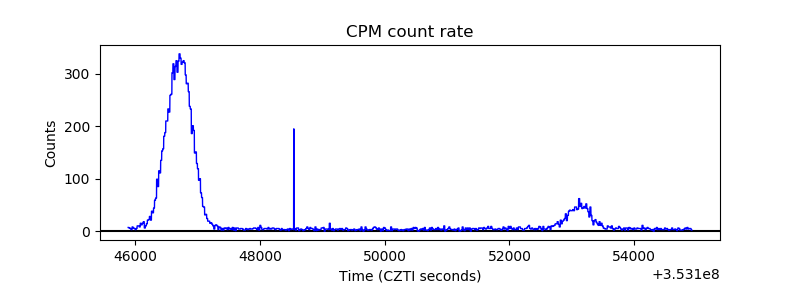 |
| CZT Counter | 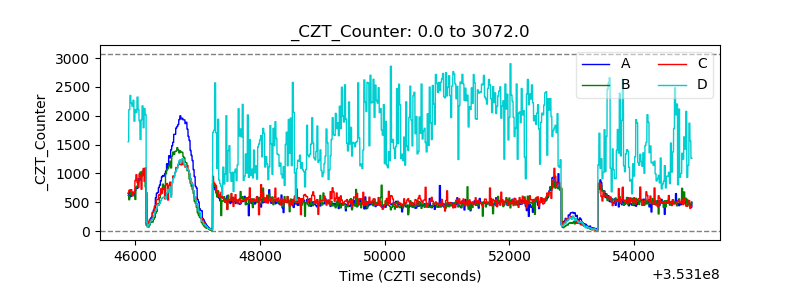 |
| +2.5 Volts monitor |  |
| +5 Volts monitor |  |
| _ROLL_ROT |  |
| _Roll_DEC |  |
| _Roll_RA | 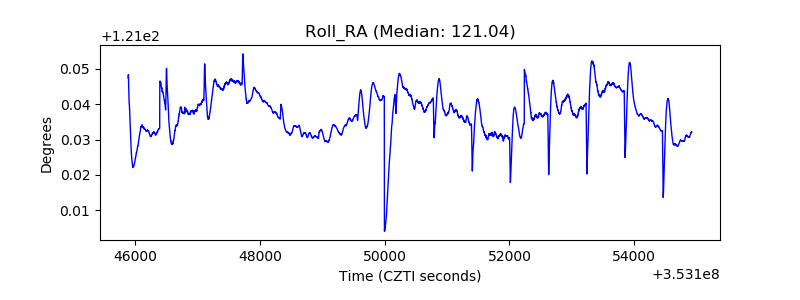 |
| Veto Counter | 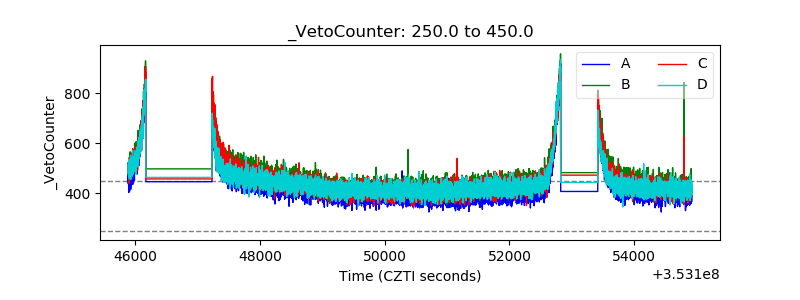 |