| Param | Original file | Final file |
|---|---|---|
| Filename | modeM0/AS1A10_102T09_9000004242_29475cztM0_level2.evt | modeM0/AS1A10_102T09_9000004242_29475cztM0_level2_quad_clean.evt |
| Size (bytes) | 838,693,440 | 87,825,600 |
| Size | 799.8 MB | 83.8 MB |
| Events in quadrant A | 3,993,776 | 568,303 |
| Events in quadrant B | 3,964,365 | 577,675 |
| Events in quadrant C | 4,091,375 | 548,977 |
| Events in quadrant D | 12,820,008 | 417,963 |
| Mode SS | |||
|---|---|---|---|
| Quadrant | BADHDUFLAG | Total packets | Discarded packets |
| A | 0 | 158 | 0 |
| B | 0 | 158 | 0 |
| C | 0 | 158 | 0 |
| D | 0 | 158 | 0 |
| Mode M9 | |||
|---|---|---|---|
| Quadrant | BADHDUFLAG | Total packets | Discarded packets |
| A | 0 | 3 | 0 |
| B | 0 | 4 | 0 |
| C | 0 | 4 | 0 |
| D | 0 | 4 | 0 |
| Mode M0 | |||
|---|---|---|---|
| Quadrant | BADHDUFLAG | Total packets | Discarded packets |
| A | 0 | 16668 | 2 |
| B | 0 | 16559 | 2 |
| C | 0 | 16680 | 2 |
| D | 0 | 43613 | 2 |
| Quadrant | Total seconds | Saturated seconds | Saturation percentage |
|---|---|---|---|
| A | 7844 | 398 | 5.073942% |
| B | 7844 | 401 | 5.112188% |
| C | 7844 | 383 | 4.882713% |
| D | 7844 | 2690 | 34.293728% |
Noise dominated data is calculated using 1-second bins in cleaned event files. If a bin has >2000 counts, and if more than 50% of those come from <1% of pixels, then it is considered to be noise-dominated and hence unusable.
| Quadrant | # 1 sec bins | Bins with >0 counts | Bins with >2000 counts | High rate bins dominated by noise | Noise dominated (total time) | Noise dominated (detector-on time) | Marked lightcurve |
|---|---|---|---|---|---|---|---|
| A | 7859 | 7845 | 3 | 3 | 0.04% | 0.04% | 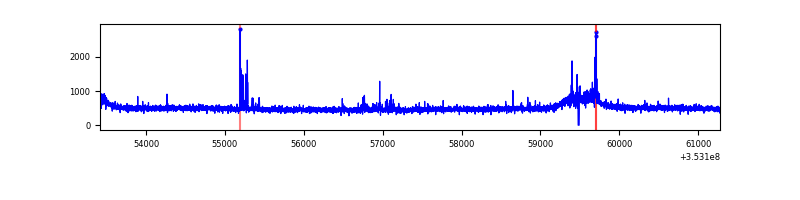 |
| B | 7859 | 7845 | 0 | 0 | 0.00% | 0.00% | 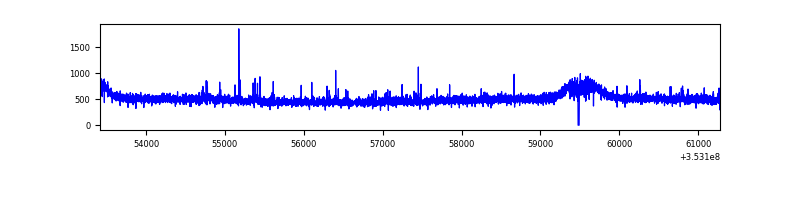 |
| C | 7859 | 7845 | 0 | 0 | 0.00% | 0.00% | 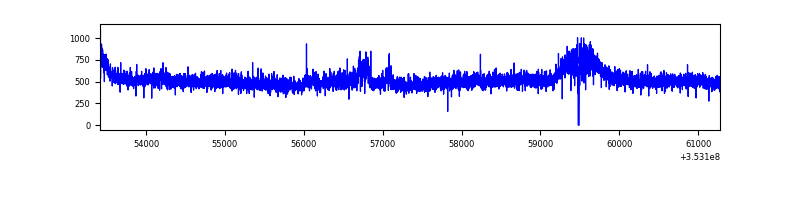 |
| D | 7859 | 7845 | 2229 | 2229 | 28.36% | 28.41% | 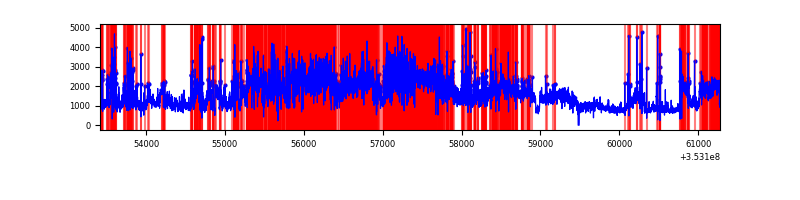 |
Top three noisy pixels from each quadrant. If the there are fewer than three noisy pixels in the level2.evt file, extra rows are filled as -1
| Pixel properties | Quadrant properties | ||||||
|---|---|---|---|---|---|---|---|
| Quadrant | DetID | PixID | Counts | Sigma | Mean | Median | Sigma |
| A | 12 | 96 | 106548 | 517.48 | 1006 | 983 | 204.0 |
| A | 13 | 254 | 14351 | 65.53 | 1006 | 983 | 204.0 |
| A | 3 | 137 | 10322 | 45.78 | 1006 | 983 | 204.0 |
| B | 12 | 111 | 24316 | 118.64 | 1001 | 973 | 196.7 |
| B | 11 | 111 | 22069 | 107.22 | 1001 | 973 | 196.7 |
| B | 14 | 111 | 20364 | 98.56 | 1001 | 973 | 196.7 |
| C | 3 | 233 | 162583 | 712.47 | 963 | 968 | 226.8 |
| C | 14 | 238 | 153415 | 672.05 | 963 | 968 | 226.8 |
| C | 2 | 114 | 19164 | 80.22 | 963 | 968 | 226.8 |
| D | 8 | 195 | 6182673 | 29812.26 | 875 | 850 | 207.4 |
| D | 1 | 52 | 1742366 | 8398.58 | 875 | 850 | 207.4 |
| D | 13 | 153 | 711294 | 3426.16 | 875 | 850 | 207.4 |
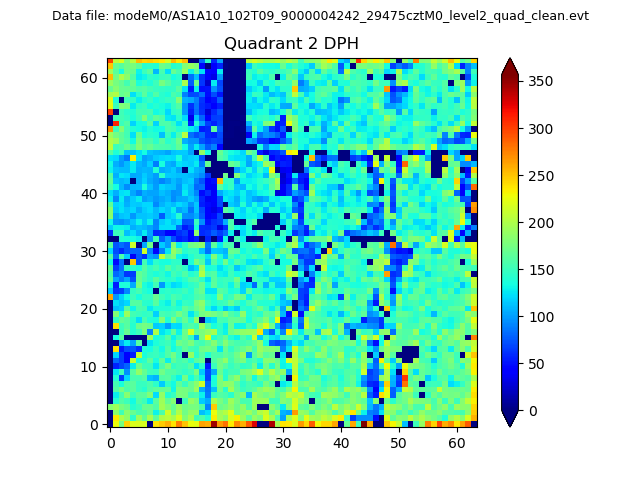
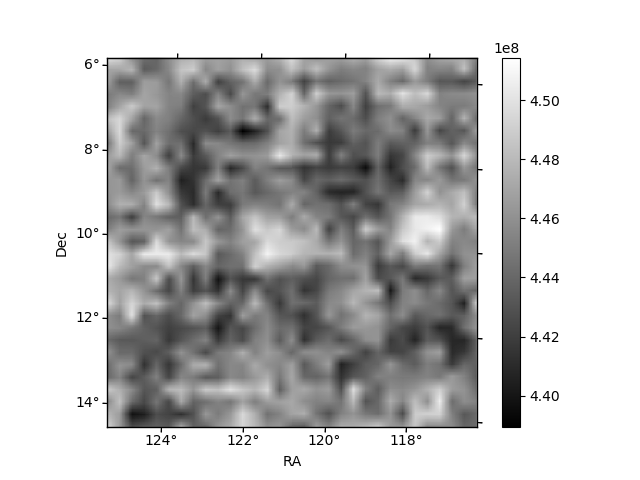
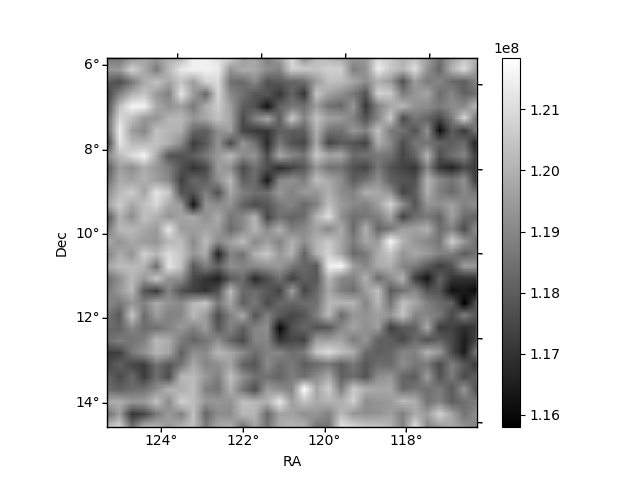
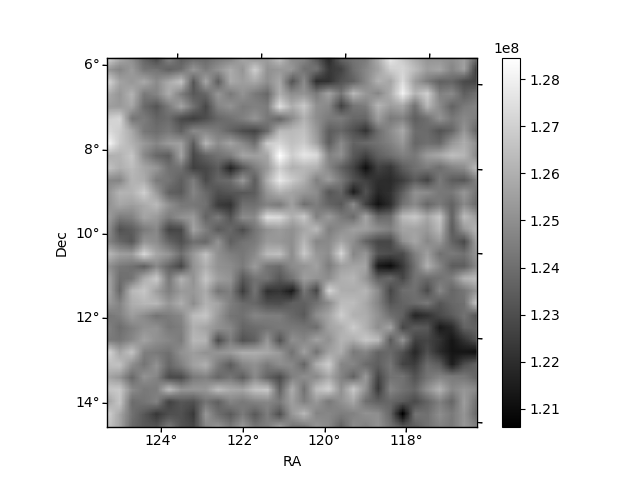
Histogram calculated using DETX and DETY for each event in the final _common_clean file
| Quadrant A | 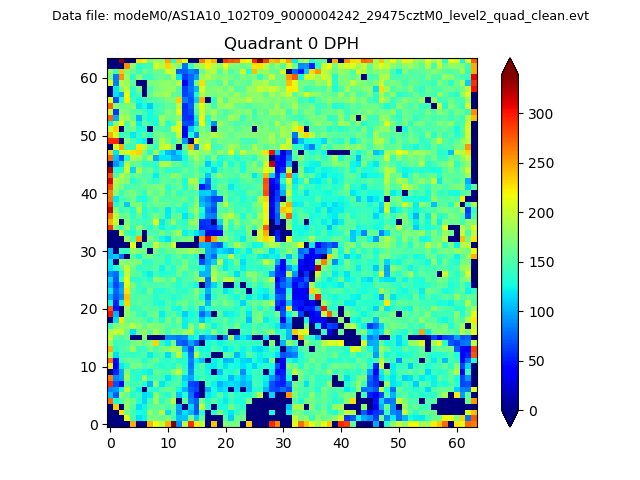 |
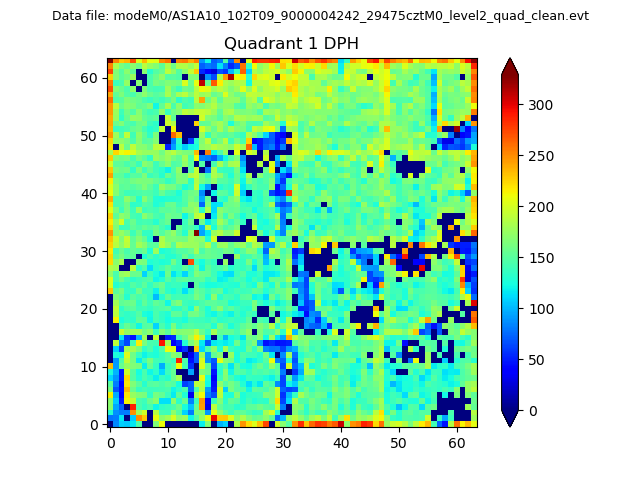 |
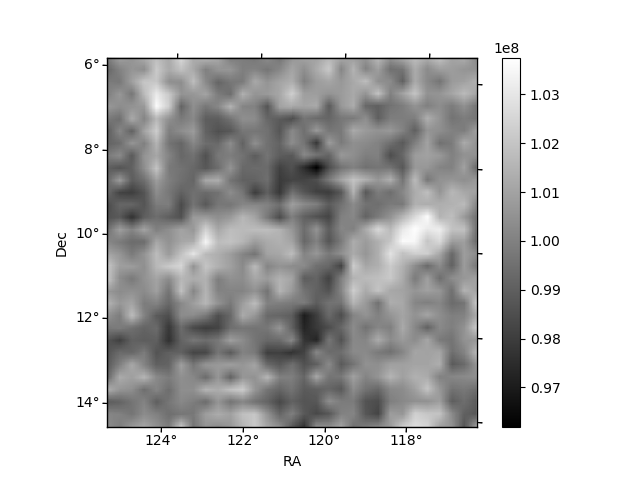
Quadrant B |
|---|---|---|---|
| Quadrant D | 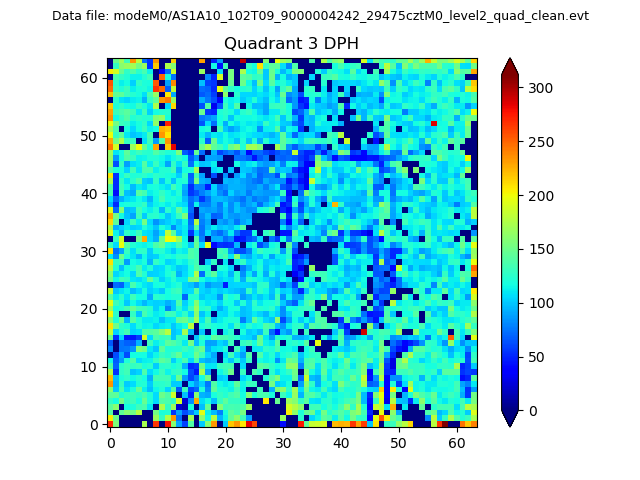 |
 |
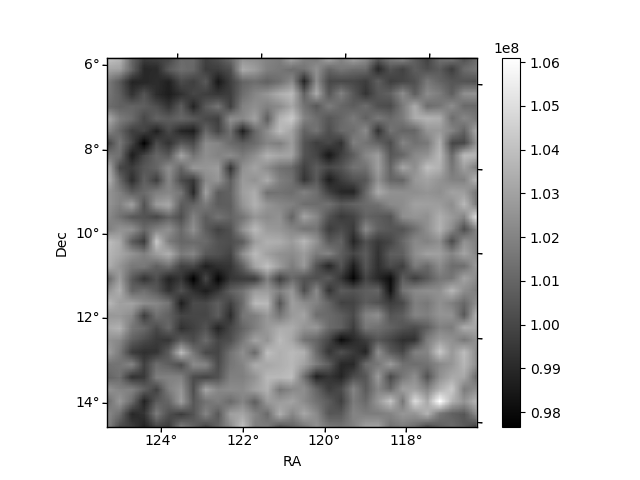
Quadrant C |
| Plot type | Count rate plots | Images |
|---|---|---|
| Comparison with Poisson distribution Blue bars denote a histogram of data divided into 1 sec bins. Red curve is a Poisson curve with rate = median count rate of data. |
 |
 |
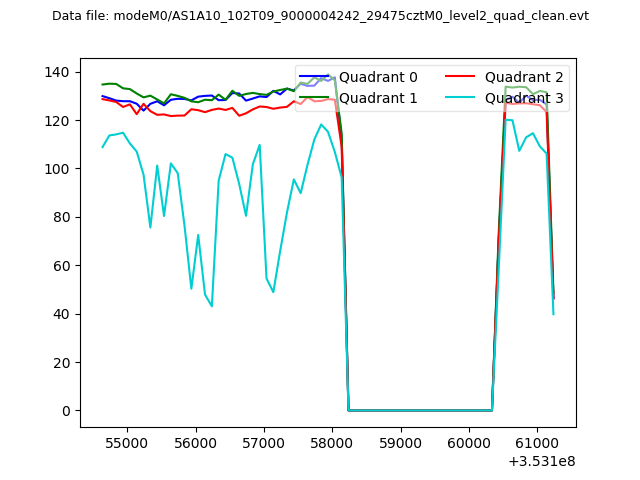
| Quadrant-wise count rates Data is divided into 100 sec bins |
 |
|
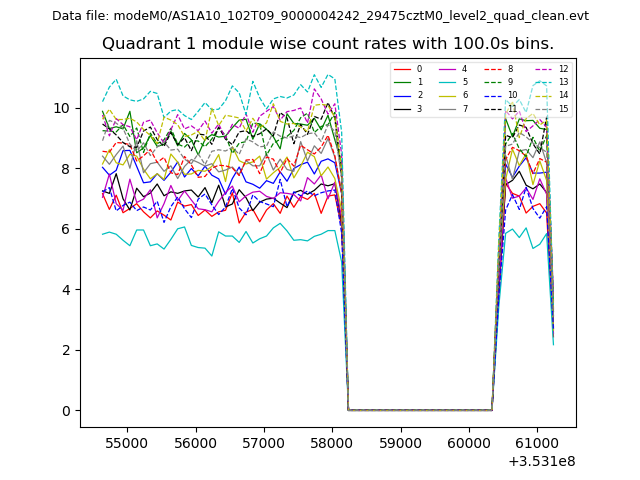
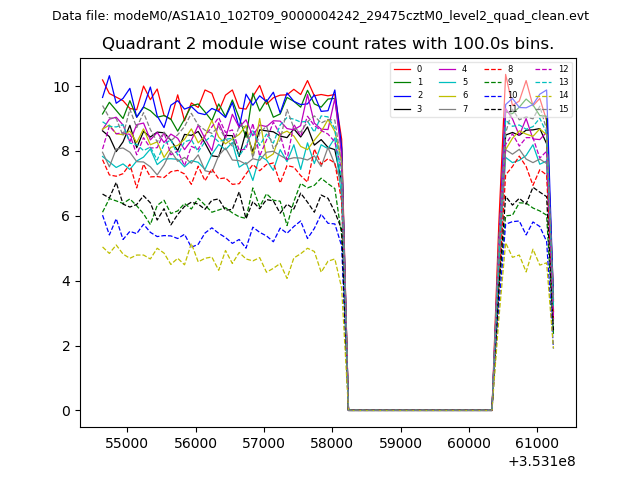
| Module-wise count rates for Quadrant A Data is divided into 100 sec bins |
 |
 |
| Module-wise count rates for Quadrant B Data is divided into 100 sec bins |
 |
 |
| Module-wise count rates for Quadrant C Data is divided into 100 sec bins |
 |
 |
| Module-wise count rates for Quadrant D Data is divided into 100 sec bins |
 |
 |
| Parameter | Plot |
|---|---|
| CZT HV Monitor | 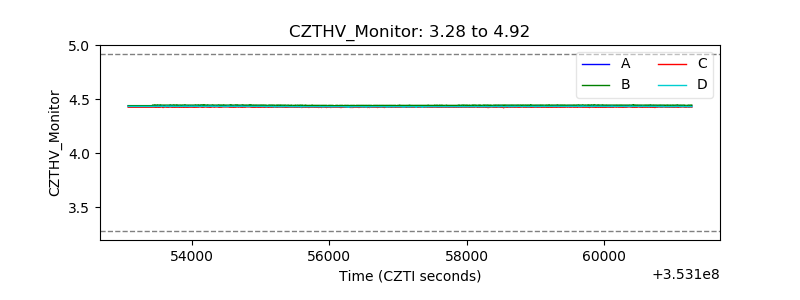 |
| D_VDD | 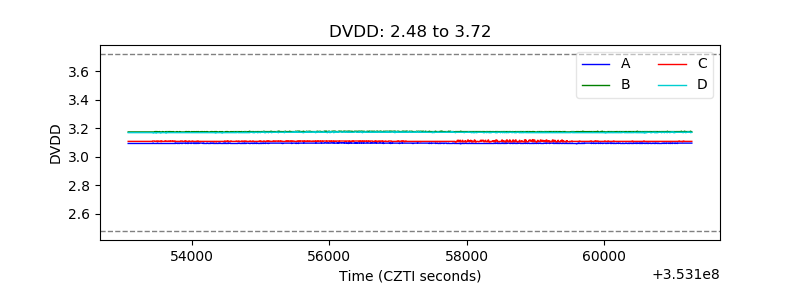 |
| Temperature 1 |  |
| Veto HV Monitor | 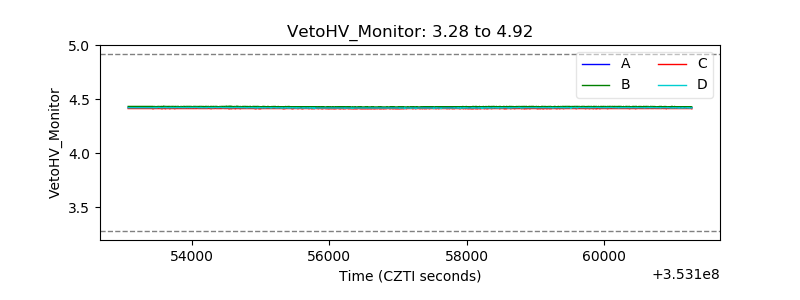 |
| Veto LLD |  |
| Alpha Counter | 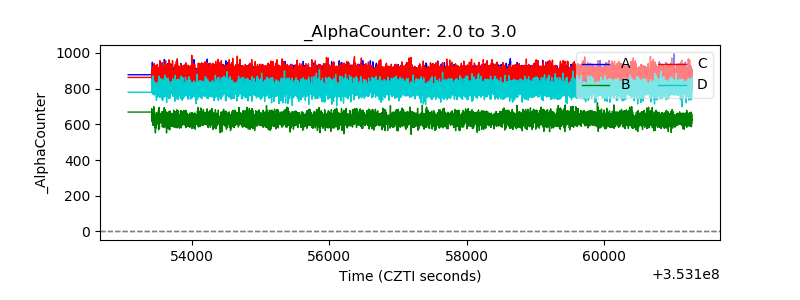 |
| _CPM_Rate | 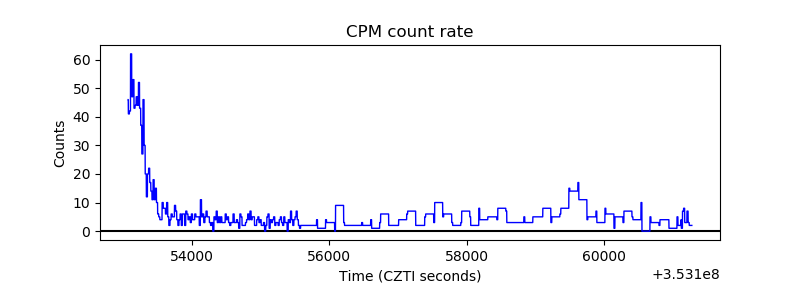 |
| CZT Counter | 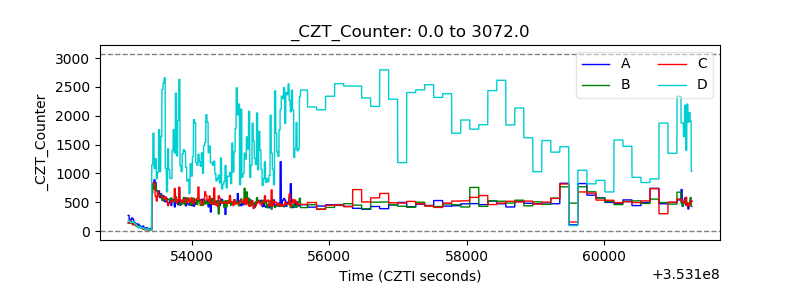 |
| +2.5 Volts monitor |  |
| +5 Volts monitor |  |
| _ROLL_ROT | 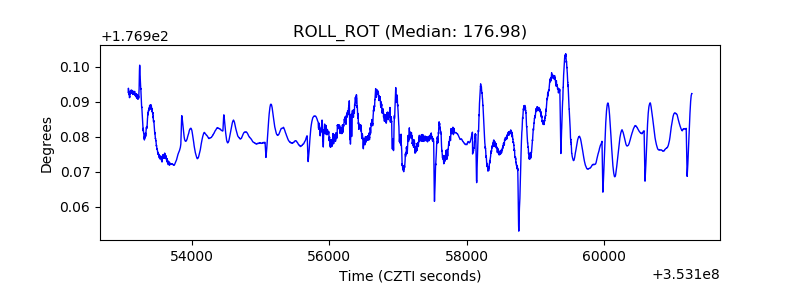 |
| _Roll_DEC | 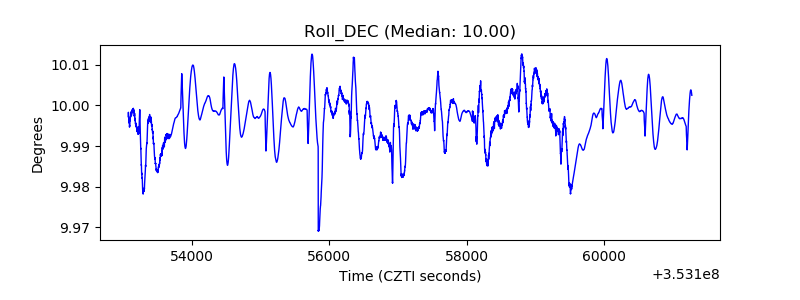 |
| _Roll_RA | 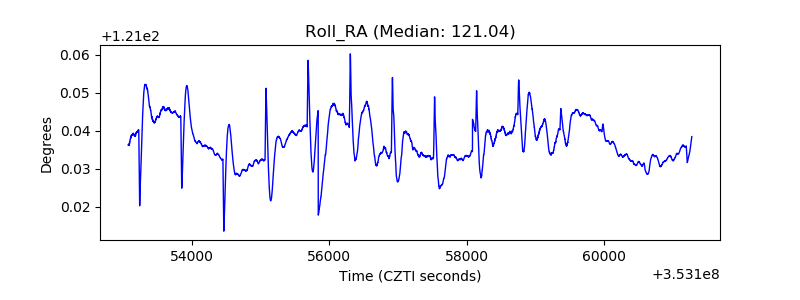 |
| Veto Counter | 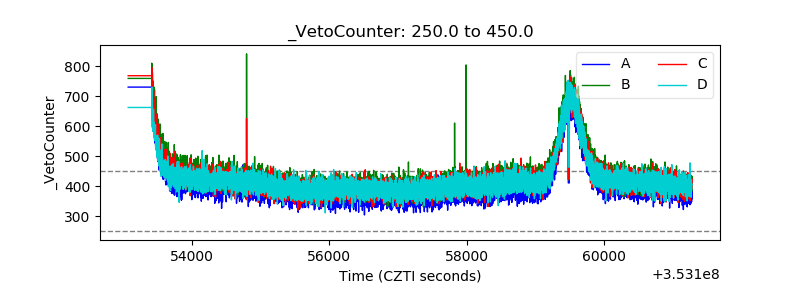 |