| Param | Original file | Final file |
|---|---|---|
| Filename | modeM0/AS1A10_102T09_9000004242_29476cztM0_level2.evt | modeM0/AS1A10_102T09_9000004242_29476cztM0_level2_quad_clean.evt |
| Size (bytes) | 768,119,040 | 95,204,160 |
| Size | 732.5 MB | 90.8 MB |
| Events in quadrant A | 3,661,494 | 620,951 |
| Events in quadrant B | 3,727,821 | 629,421 |
| Events in quadrant C | 3,923,253 | 602,625 |
| Events in quadrant D | 11,450,296 | 514,466 |
| Mode SS | |||
|---|---|---|---|
| Quadrant | BADHDUFLAG | Total packets | Discarded packets |
| A | 0 | 148 | 0 |
| B | 0 | 148 | 0 |
| C | 0 | 148 | 0 |
| D | 0 | 148 | 0 |
| Mode M0 | |||
|---|---|---|---|
| Quadrant | BADHDUFLAG | Total packets | Discarded packets |
| A | 0 | 15452 | 0 |
| B | 0 | 15639 | 0 |
| C | 0 | 15858 | 0 |
| D | 0 | 39250 | 4 |
| Quadrant | Total seconds | Saturated seconds | Saturation percentage |
|---|---|---|---|
| A | 7399 | 239 | 3.230166% |
| B | 7400 | 284 | 3.837838% |
| C | 7400 | 247 | 3.337838% |
| D | 7399 | 1893 | 25.584538% |
Noise dominated data is calculated using 1-second bins in cleaned event files. If a bin has >2000 counts, and if more than 50% of those come from <1% of pixels, then it is considered to be noise-dominated and hence unusable.
| Quadrant | # 1 sec bins | Bins with >0 counts | Bins with >2000 counts | High rate bins dominated by noise | Noise dominated (total time) | Noise dominated (detector-on time) | Marked lightcurve |
|---|---|---|---|---|---|---|---|
| A | 7399 | 7399 | 0 | 0 | 0.00% | 0.00% | 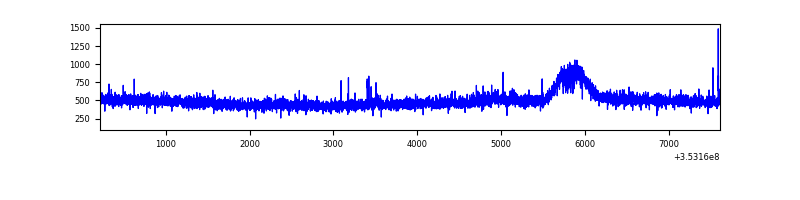 |
| B | 7400 | 7400 | 12 | 12 | 0.16% | 0.16% | 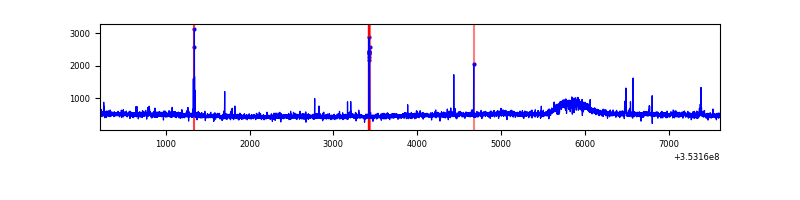 |
| C | 7400 | 7400 | 0 | 0 | 0.00% | 0.00% | 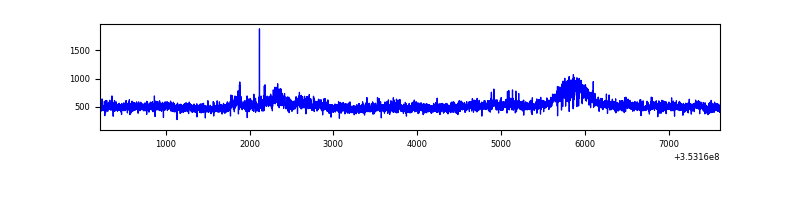 |
| D | 7399 | 7399 | 1709 | 1709 | 23.10% | 23.10% | 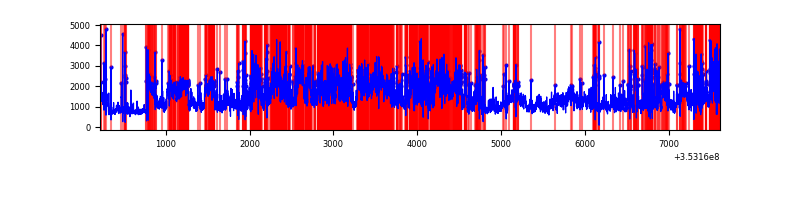 |
Top three noisy pixels from each quadrant. If the there are fewer than three noisy pixels in the level2.evt file, extra rows are filled as -1
| Pixel properties | Quadrant properties | ||||||
|---|---|---|---|---|---|---|---|
| Quadrant | DetID | PixID | Counts | Sigma | Mean | Median | Sigma |
| A | 1 | 113 | 15833 | 77.59 | 942 | 920 | 192.2 |
| A | 13 | 254 | 13307 | 64.45 | 942 | 920 | 192.2 |
| A | 12 | 96 | 9509 | 44.69 | 942 | 920 | 192.2 |
| B | 0 | 229 | 29602 | 157.74 | 929 | 902 | 181.9 |
| B | 12 | 111 | 22668 | 119.63 | 929 | 902 | 181.9 |
| B | 11 | 111 | 20619 | 108.37 | 929 | 902 | 181.9 |
| C | 3 | 233 | 269019 | 1273.58 | 895 | 899 | 210.5 |
| C | 14 | 238 | 141739 | 668.99 | 895 | 899 | 210.5 |
| C | 2 | 114 | 17532 | 79.01 | 895 | 899 | 210.5 |
| D | 8 | 195 | 5834405 | 28645.19 | 848 | 824 | 203.6 |
| D | 1 | 52 | 1579626 | 7752.54 | 848 | 824 | 203.6 |
| D | 7 | 223 | 387260 | 1897.55 | 848 | 824 | 203.6 |
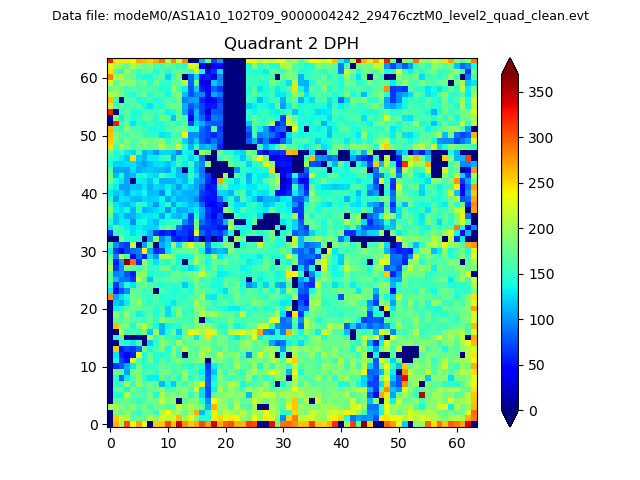
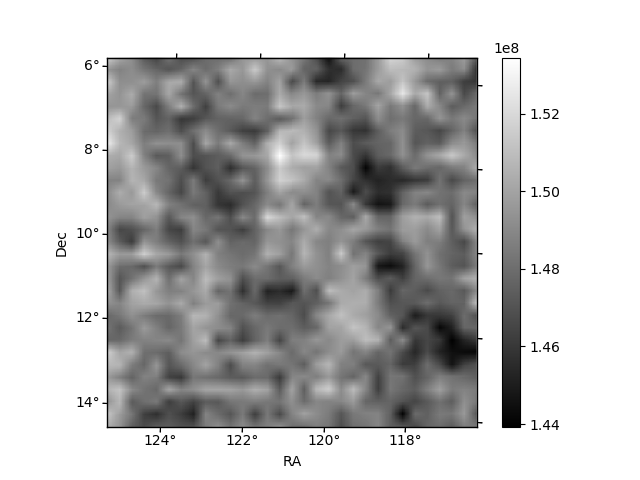
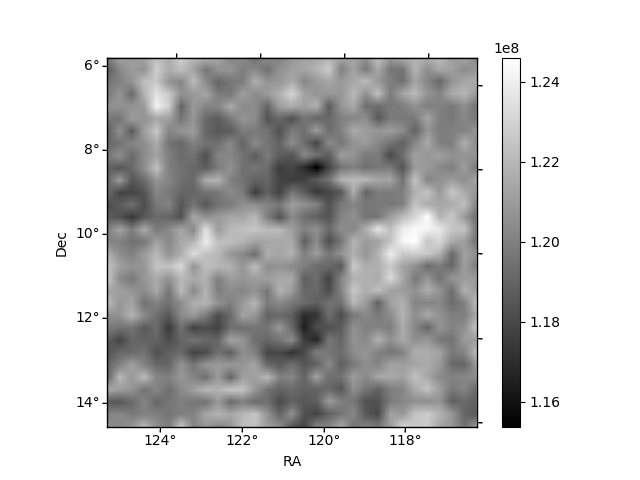
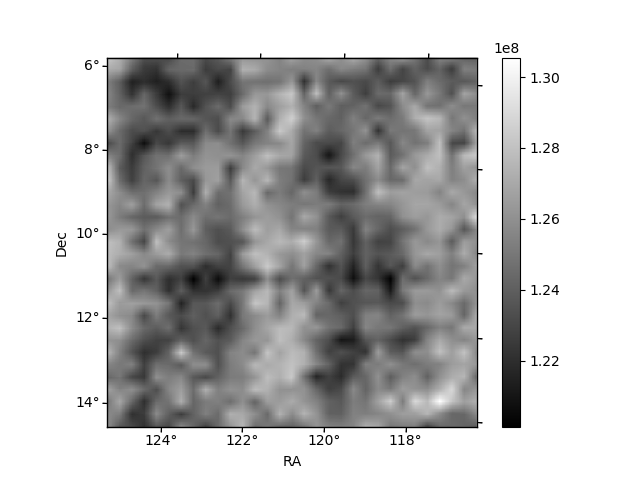
Histogram calculated using DETX and DETY for each event in the final _common_clean file
| Quadrant A | 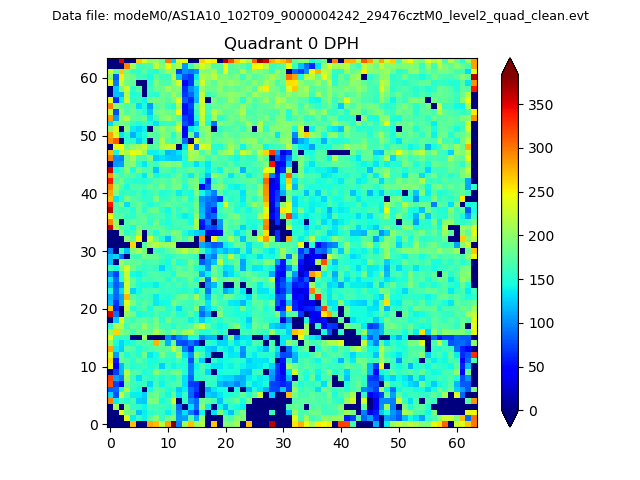 |
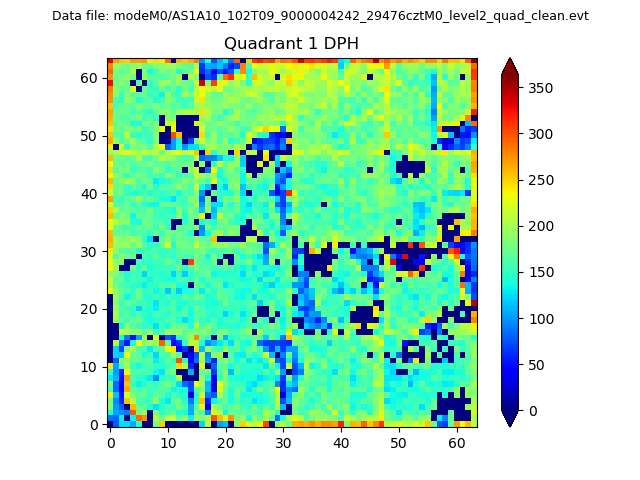 |
Quadrant B |
|---|---|---|---|
| Quadrant D | 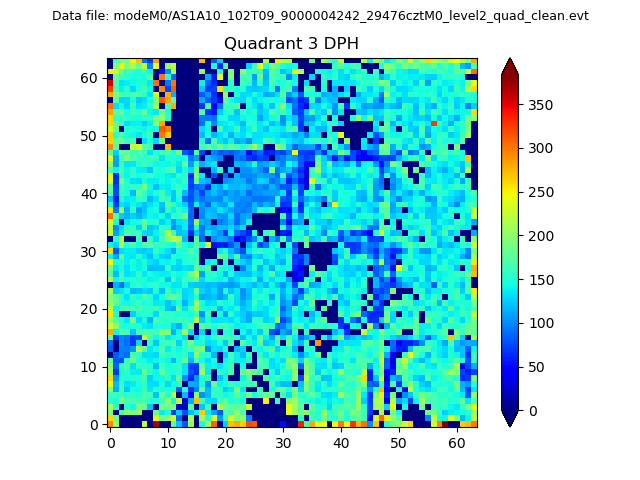 |
 |
Quadrant C |
| Plot type | Count rate plots | Images |
|---|---|---|
| Comparison with Poisson distribution Blue bars denote a histogram of data divided into 1 sec bins. Red curve is a Poisson curve with rate = median count rate of data. |
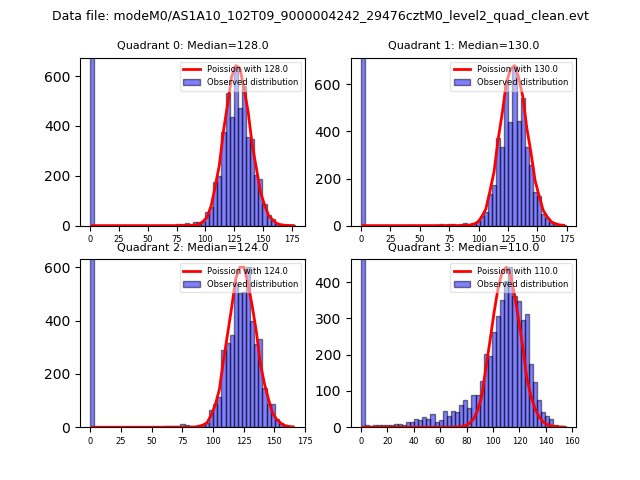 |
 |
| Quadrant-wise count rates Data is divided into 100 sec bins |
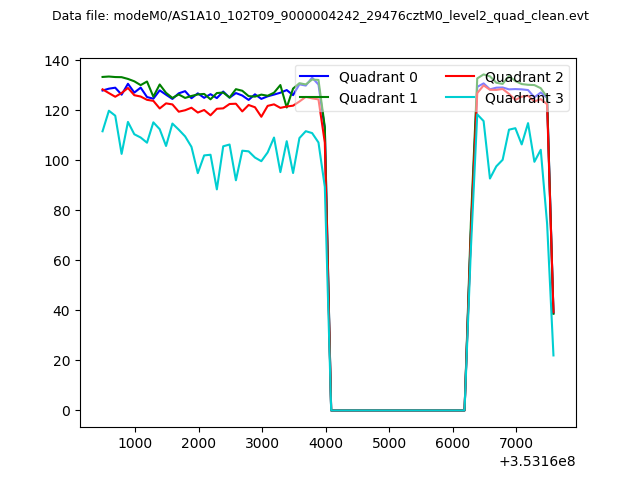 |
|
| Module-wise count rates for Quadrant A Data is divided into 100 sec bins |
 |
 |
| Module-wise count rates for Quadrant B Data is divided into 100 sec bins |
 |
 |
| Module-wise count rates for Quadrant C Data is divided into 100 sec bins |
 |
 |
| Module-wise count rates for Quadrant D Data is divided into 100 sec bins |
 |
 |
| Parameter | Plot |
|---|---|
| CZT HV Monitor |  |
| D_VDD | 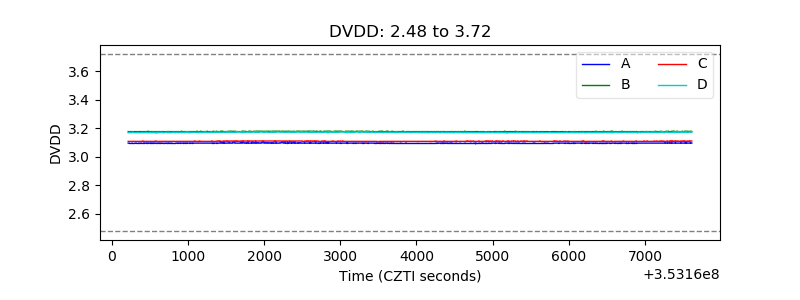 |
| Temperature 1 | 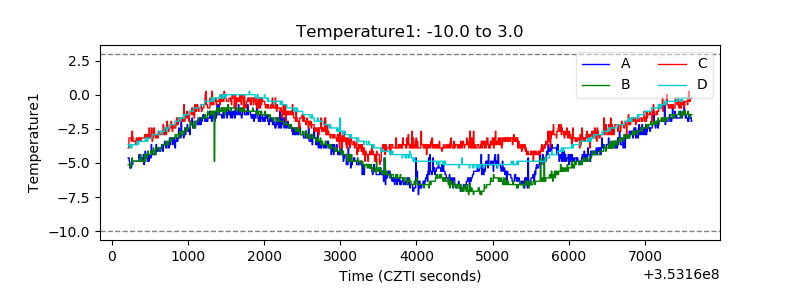 |
| Veto HV Monitor | 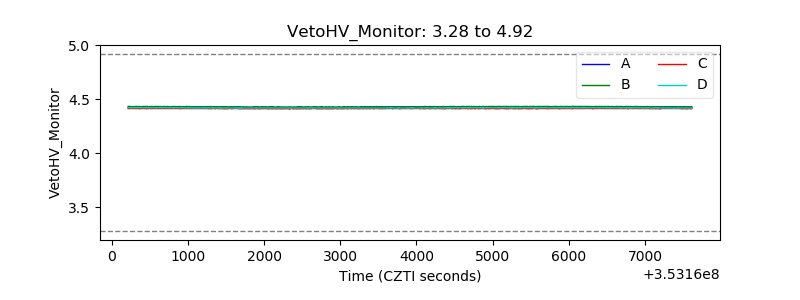 |
| Veto LLD | 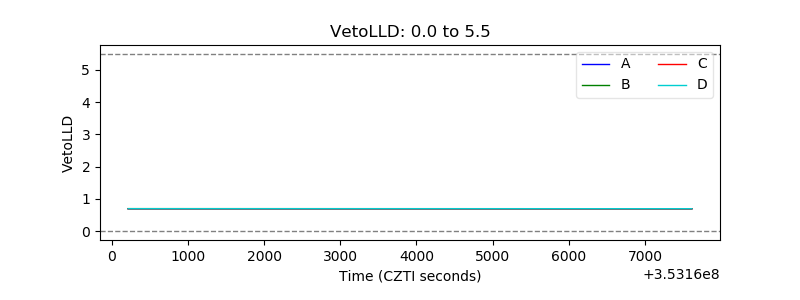 |
| Alpha Counter | 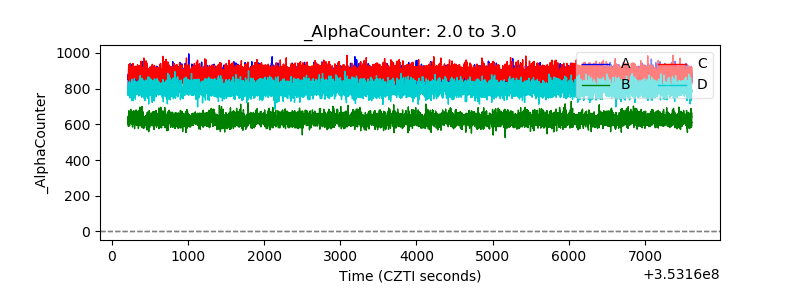 |
| _CPM_Rate | 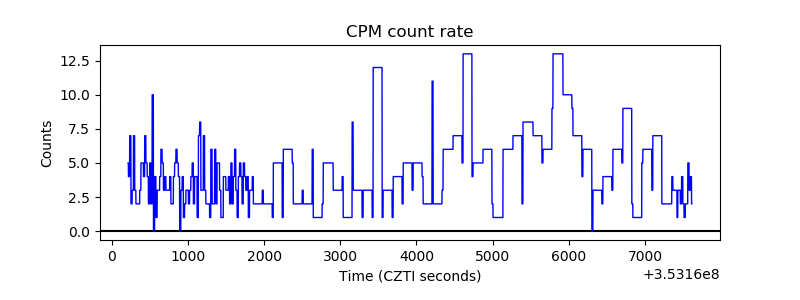 |
| CZT Counter | 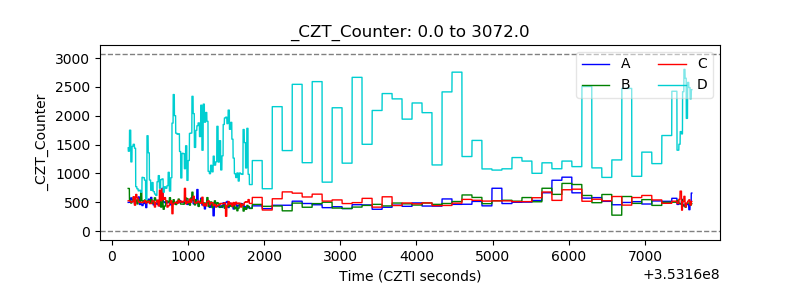 |
| +2.5 Volts monitor | 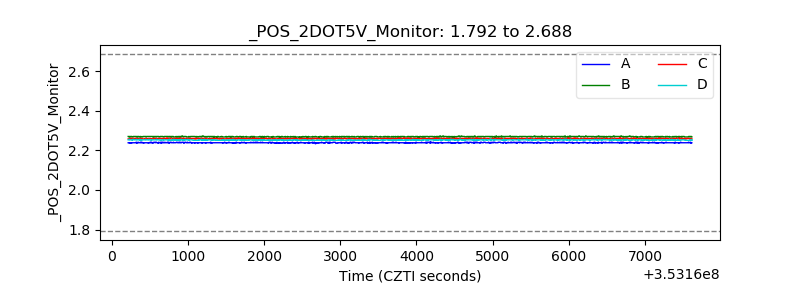 |
| +5 Volts monitor |  |
| _ROLL_ROT |  |
| _Roll_DEC | 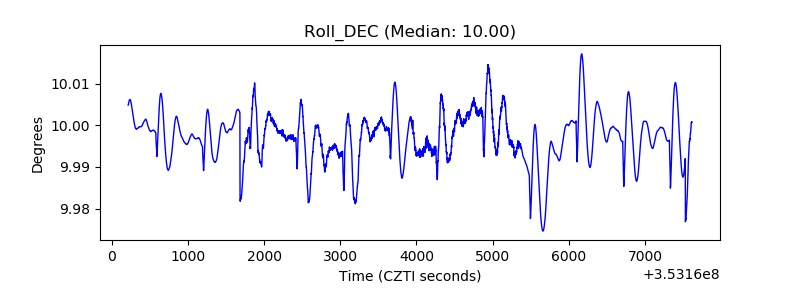 |
| _Roll_RA | 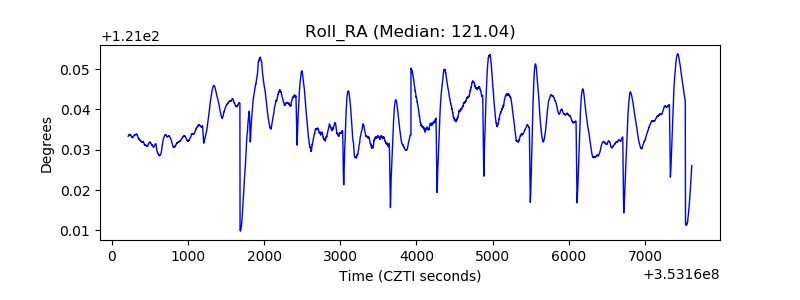 |
| Veto Counter | 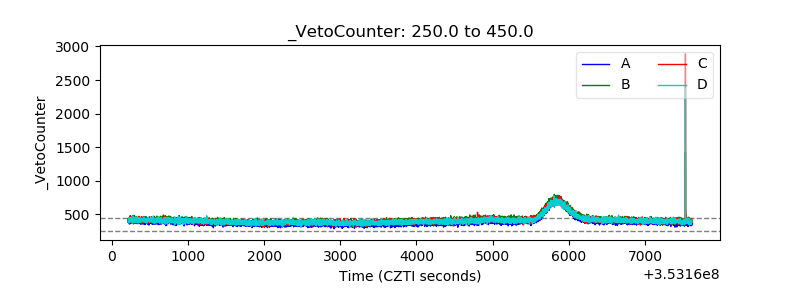 |