| Param | Original file | Final file |
|---|---|---|
| Filename | modeM0/AS1A10_102T09_9000004242_29477cztM0_level2.evt | modeM0/AS1A10_102T09_9000004242_29477cztM0_level2_quad_clean.evt |
| Size (bytes) | 746,547,840 | 94,847,040 |
| Size | 712.0 MB | 90.5 MB |
| Events in quadrant A | 3,389,929 | 632,042 |
| Events in quadrant B | 3,439,764 | 640,630 |
| Events in quadrant C | 3,486,939 | 613,257 |
| Events in quadrant D | 11,819,318 | 497,445 |
| Mode SS | |||
|---|---|---|---|
| Quadrant | BADHDUFLAG | Total packets | Discarded packets |
| A | 0 | 142 | 0 |
| B | 0 | 142 | 0 |
| C | 0 | 142 | 0 |
| D | 0 | 142 | 0 |
| Mode M9 | |||
|---|---|---|---|
| Quadrant | BADHDUFLAG | Total packets | Discarded packets |
| A | 0 | 3 | 0 |
| B | 0 | 3 | 0 |
| C | 0 | 3 | 0 |
| D | 0 | 3 | 0 |
| Mode M0 | |||
|---|---|---|---|
| Quadrant | BADHDUFLAG | Total packets | Discarded packets |
| A | 0 | 14508 | 1 |
| B | 0 | 14618 | 1 |
| C | 0 | 14569 | 2 |
| D | 0 | 39992 | 1 |
| Quadrant | Total seconds | Saturated seconds | Saturation percentage |
|---|---|---|---|
| A | 7009 | 127 | 1.811956% |
| B | 7010 | 147 | 2.097004% |
| C | 7009 | 165 | 2.354116% |
| D | 7009 | 2095 | 29.890141% |
Noise dominated data is calculated using 1-second bins in cleaned event files. If a bin has >2000 counts, and if more than 50% of those come from <1% of pixels, then it is considered to be noise-dominated and hence unusable.
| Quadrant | # 1 sec bins | Bins with >0 counts | Bins with >2000 counts | High rate bins dominated by noise | Noise dominated (total time) | Noise dominated (detector-on time) | Marked lightcurve |
|---|---|---|---|---|---|---|---|
| A | 7299 | 7010 | 0 | 0 | 0.00% | 0.00% | 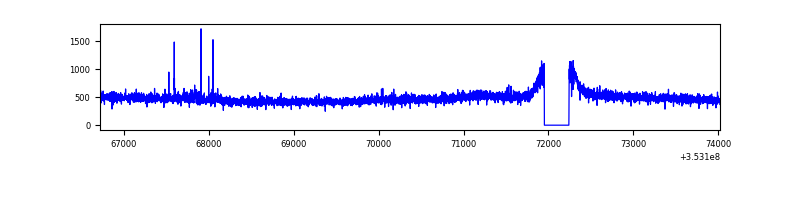 |
| B | 7300 | 7011 | 1 | 1 | 0.01% | 0.01% | 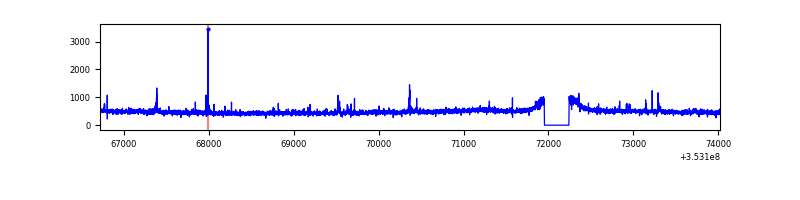 |
| C | 7299 | 7010 | 0 | 0 | 0.00% | 0.00% | 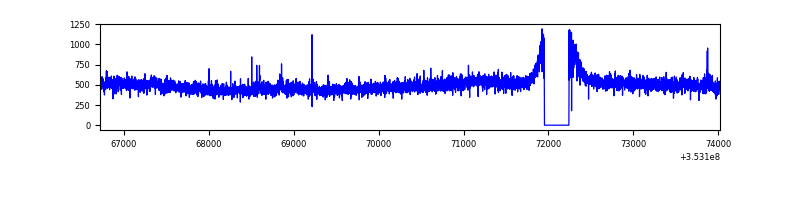 |
| D | 7299 | 7010 | 1923 | 1923 | 26.35% | 27.43% | 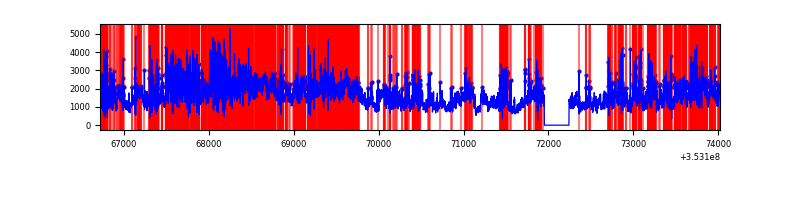 |
Top three noisy pixels from each quadrant. If the there are fewer than three noisy pixels in the level2.evt file, extra rows are filled as -1
| Pixel properties | Quadrant properties | ||||||
|---|---|---|---|---|---|---|---|
| Quadrant | DetID | PixID | Counts | Sigma | Mean | Median | Sigma |
| A | 1 | 113 | 15899 | 84.36 | 870 | 852 | 178.4 |
| A | 12 | 96 | 14154 | 74.58 | 870 | 852 | 178.4 |
| A | 13 | 254 | 12728 | 66.58 | 870 | 852 | 178.4 |
| B | 0 | 190 | 24323 | 138.27 | 860 | 836 | 169.9 |
| B | 12 | 111 | 20863 | 117.9 | 860 | 836 | 169.9 |
| B | 11 | 111 | 18784 | 105.66 | 860 | 836 | 169.9 |
| C | 14 | 238 | 130988 | 666.33 | 830 | 836 | 195.3 |
| C | 3 | 233 | 91131 | 462.28 | 830 | 836 | 195.3 |
| C | 2 | 114 | 17099 | 83.26 | 830 | 836 | 195.3 |
| D | 8 | 195 | 5519022 | 30143.24 | 763 | 743 | 183.1 |
| D | 1 | 52 | 2139203 | 11681.2 | 763 | 743 | 183.1 |
| D | 7 | 223 | 484352 | 2641.68 | 763 | 743 | 183.1 |
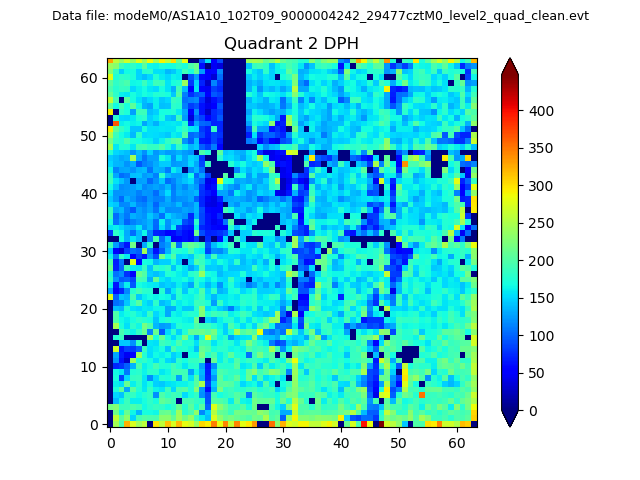
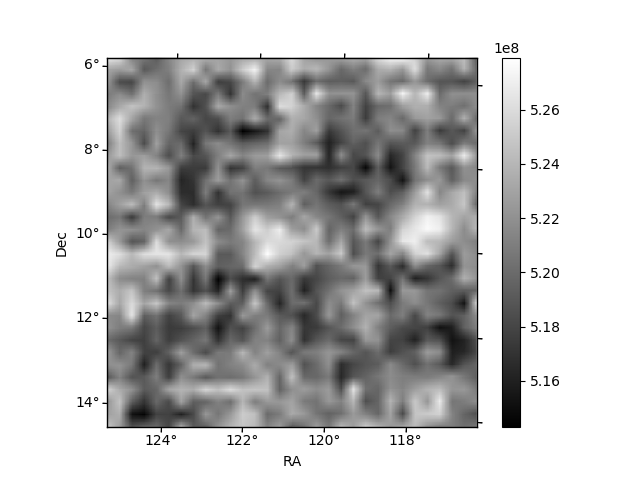
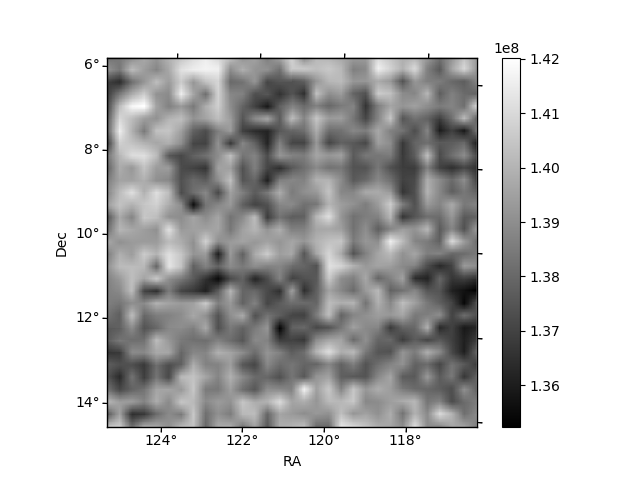
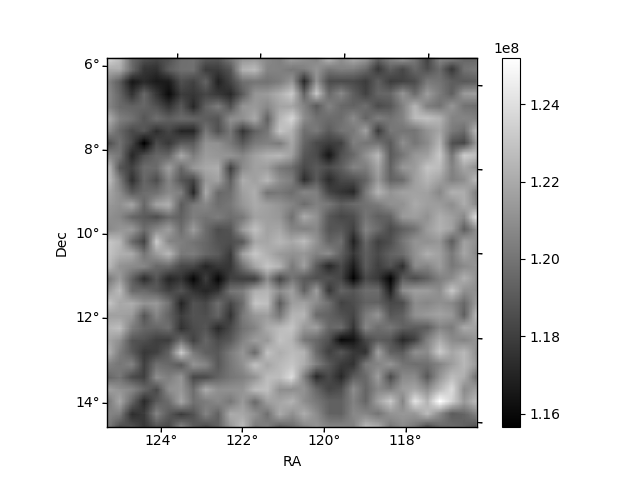
Histogram calculated using DETX and DETY for each event in the final _common_clean file
| Quadrant A | 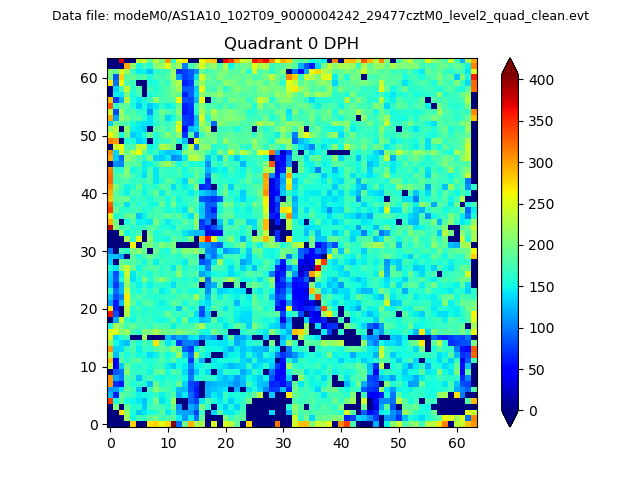 |
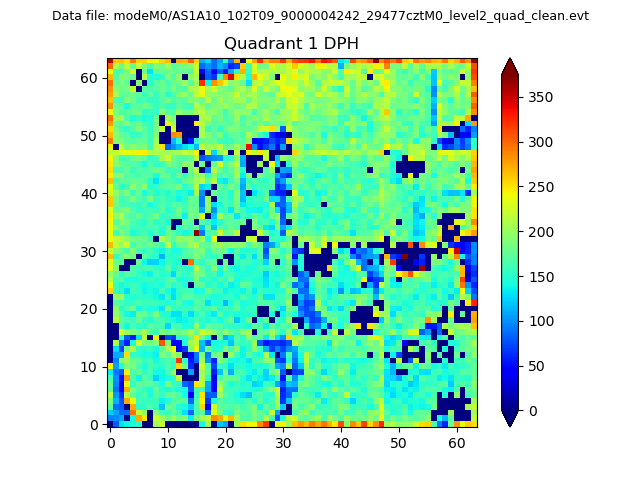 |
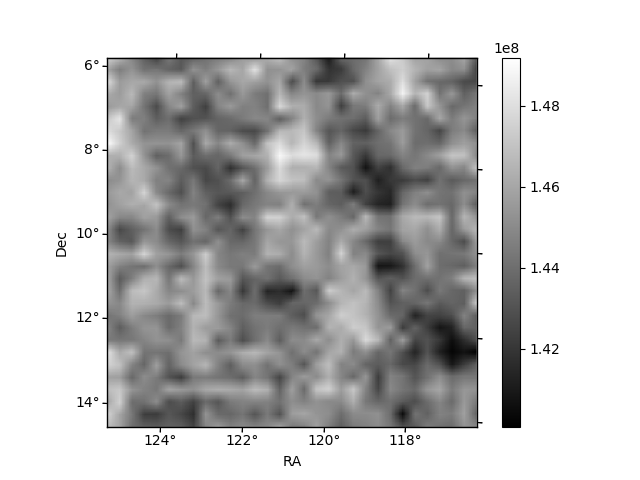
Quadrant B |
|---|---|---|---|
| Quadrant D | 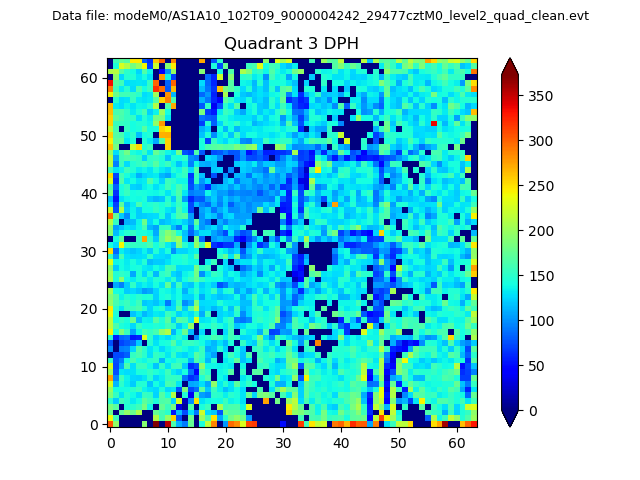 |
 |
Quadrant C |
| Plot type | Count rate plots | Images |
|---|---|---|
| Comparison with Poisson distribution Blue bars denote a histogram of data divided into 1 sec bins. Red curve is a Poisson curve with rate = median count rate of data. |
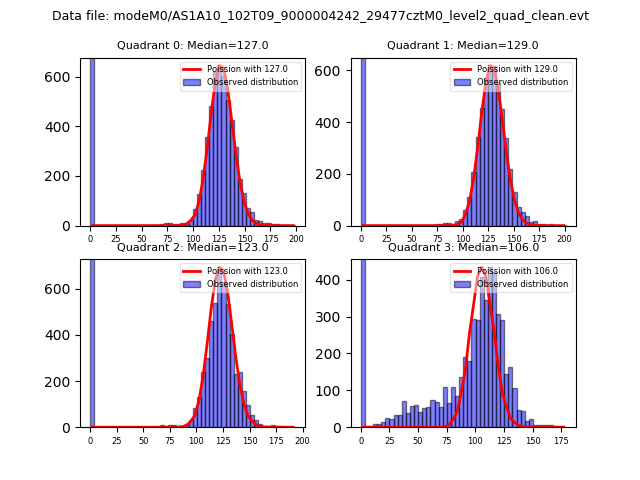 |
 |
| Quadrant-wise count rates Data is divided into 100 sec bins |
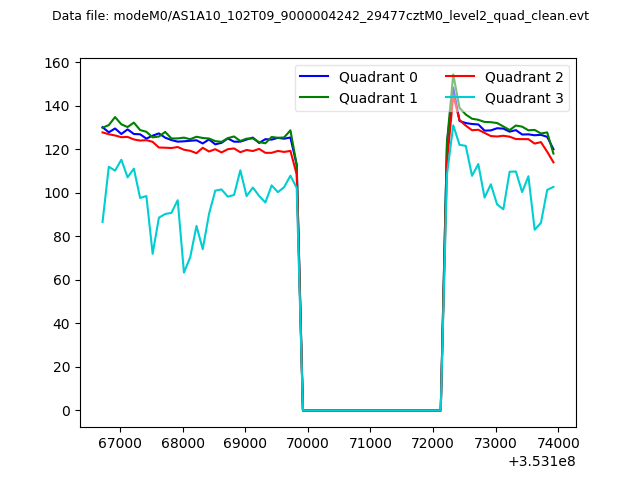 |
|
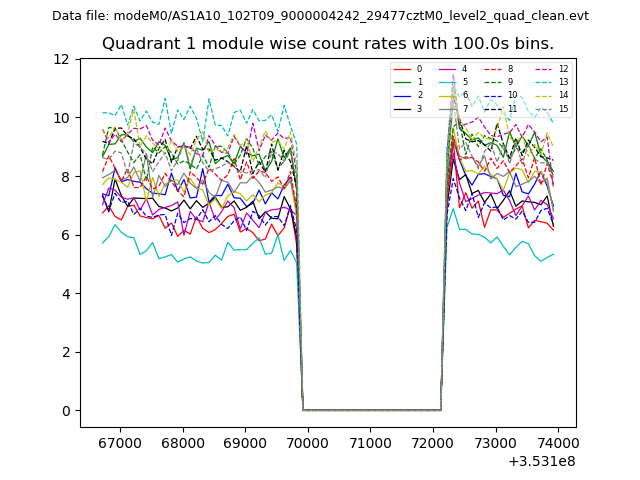
| Module-wise count rates for Quadrant A Data is divided into 100 sec bins |
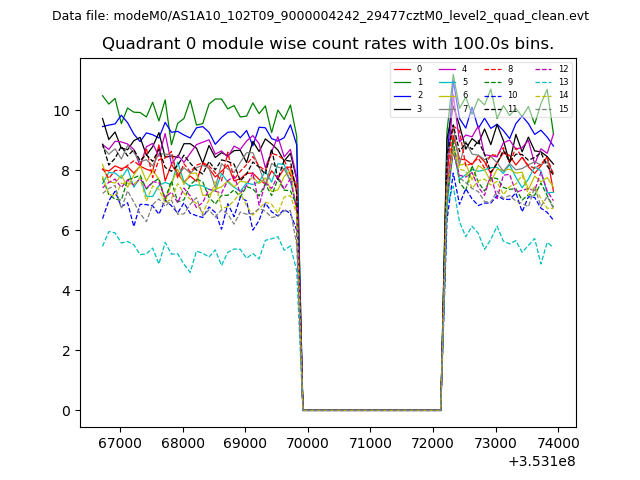 |
 |
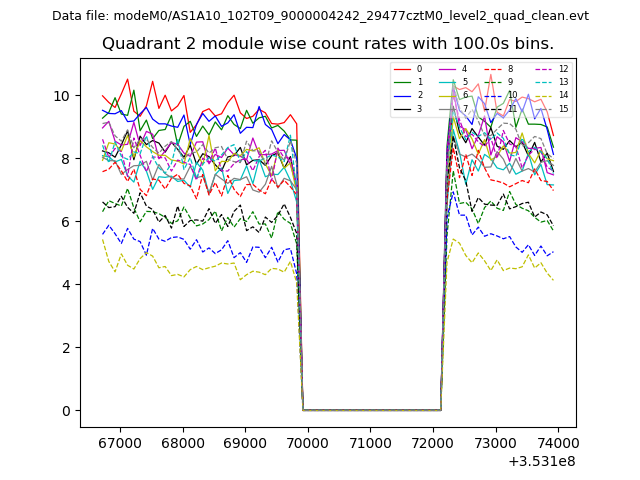
| Module-wise count rates for Quadrant B Data is divided into 100 sec bins |
 |
 |
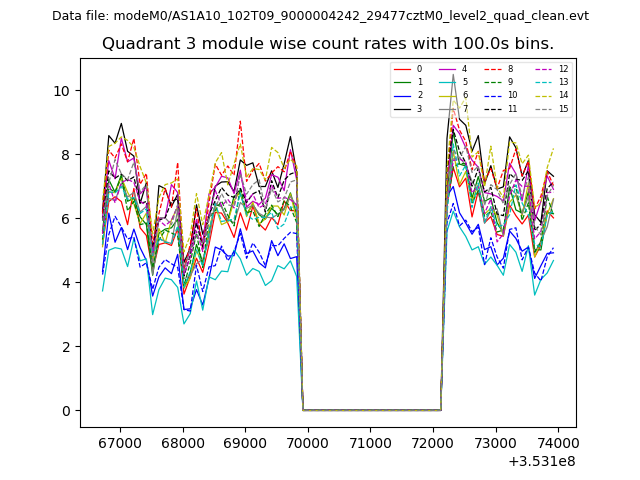
| Module-wise count rates for Quadrant C Data is divided into 100 sec bins |
 |
 |
| Module-wise count rates for Quadrant D Data is divided into 100 sec bins |
 |
 |
| Parameter | Plot |
|---|---|
| CZT HV Monitor | 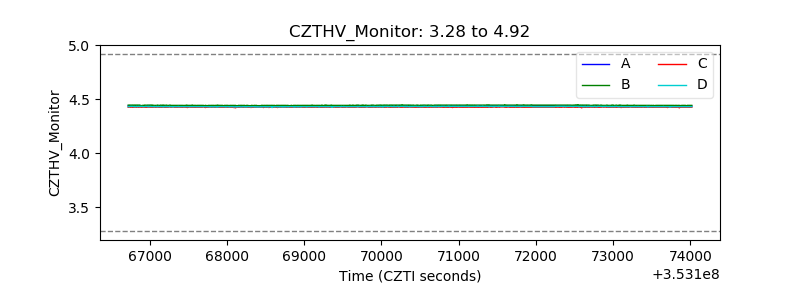 |
| D_VDD | 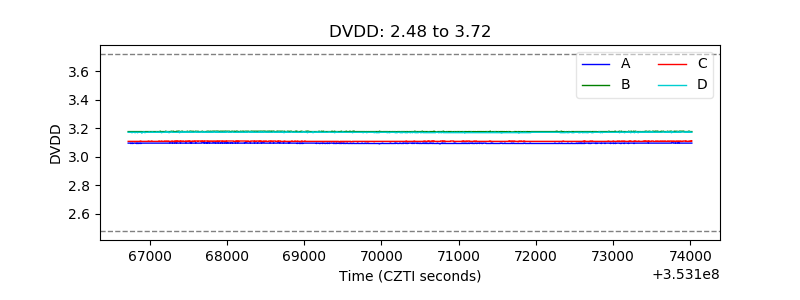 |
| Temperature 1 | 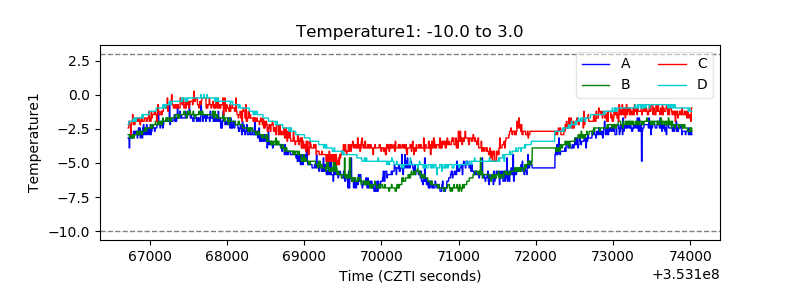 |
| Veto HV Monitor | 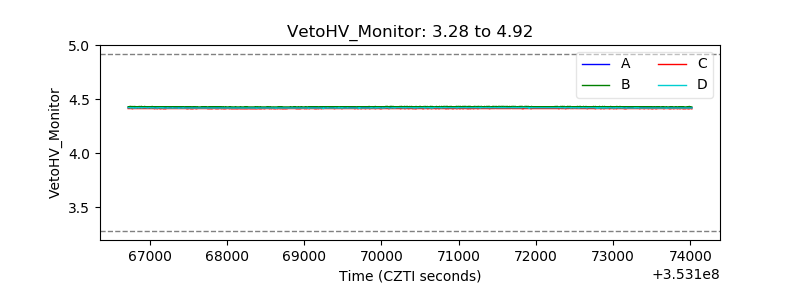 |
| Veto LLD | 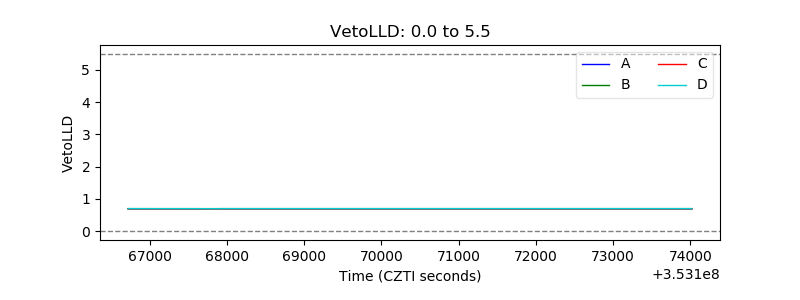 |
| Alpha Counter | 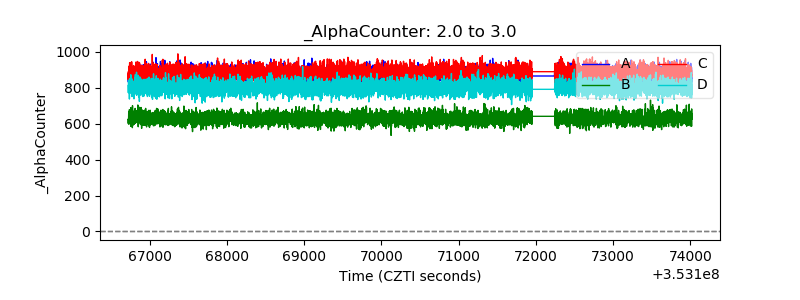 |
| _CPM_Rate | 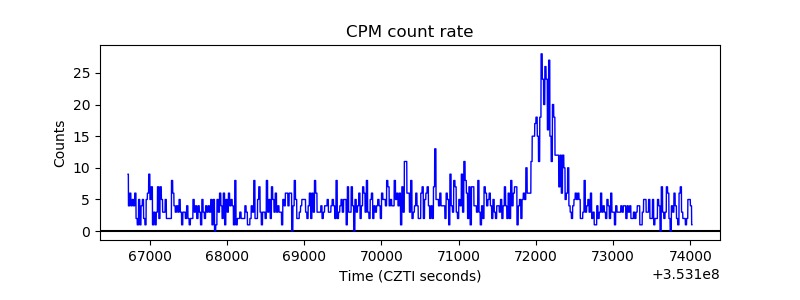 |
| CZT Counter | 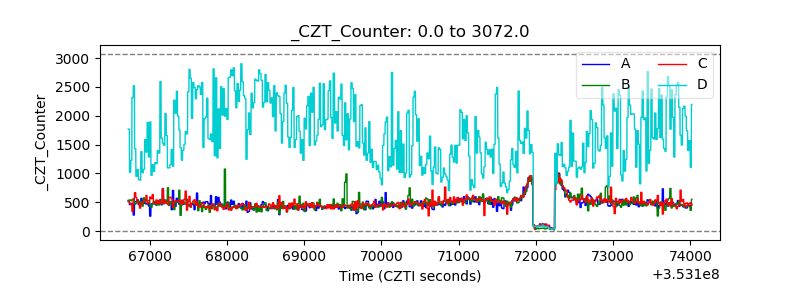 |
| +2.5 Volts monitor | 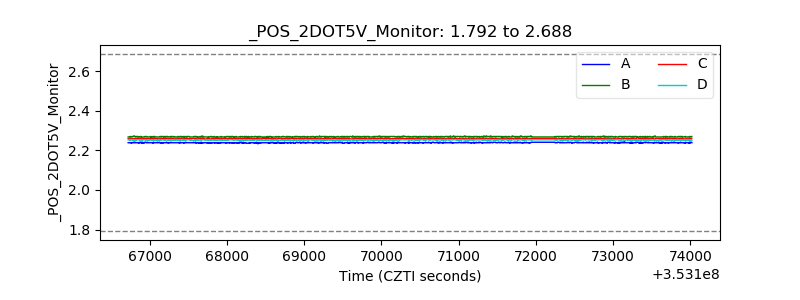 |
| +5 Volts monitor |  |
| _ROLL_ROT | 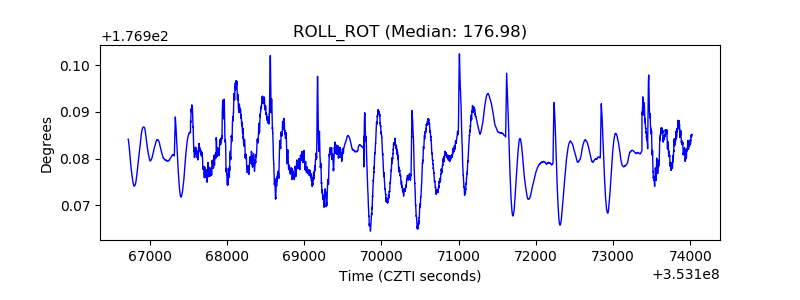 |
| _Roll_DEC | 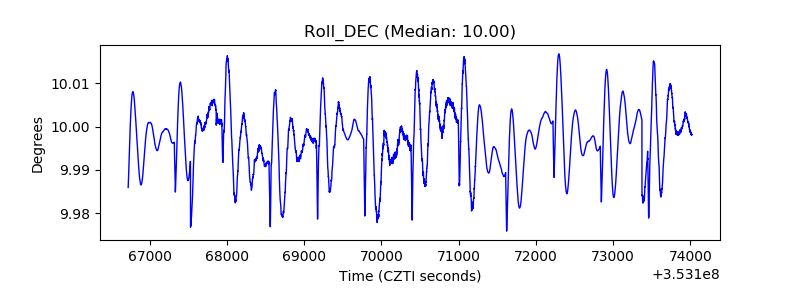 |
| _Roll_RA | 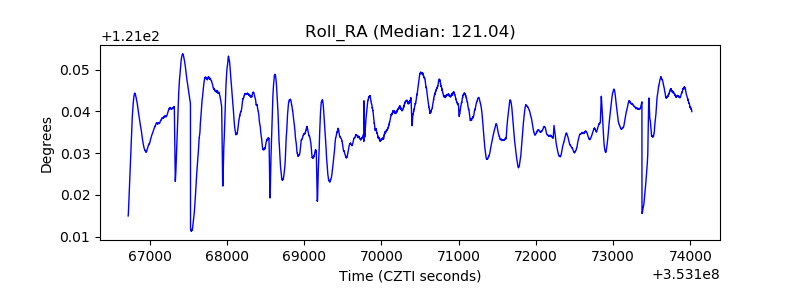 |
| Veto Counter | 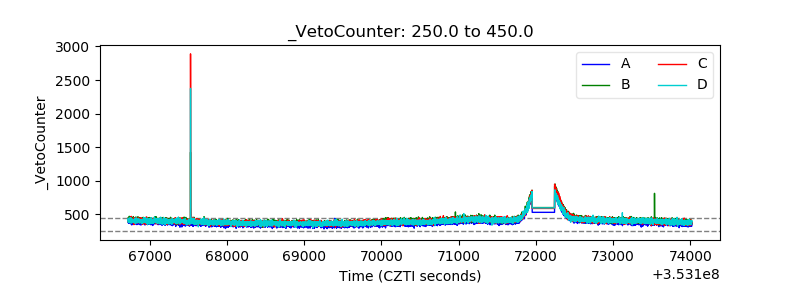 |