| Param | Original file | Final file |
|---|---|---|
| Filename | modeM0/AS1A10_102T09_9000004242_29479cztM0_level2.evt | modeM0/AS1A10_102T09_9000004242_29479cztM0_level2_quad_clean.evt |
| Size (bytes) | 1,382,284,800 | 158,146,560 |
| Size | 1.3 GB | 150.8 MB |
| Events in quadrant A | 6,052,401 | 1,047,693 |
| Events in quadrant B | 6,162,747 | 1,060,247 |
| Events in quadrant C | 6,459,314 | 1,013,997 |
| Events in quadrant D | 22,330,210 | 785,069 |
| Mode SS | |||
|---|---|---|---|
| Quadrant | BADHDUFLAG | Total packets | Discarded packets |
| A | 0 | 260 | 0 |
| B | 0 | 260 | 0 |
| C | 0 | 260 | 0 |
| D | 0 | 260 | 0 |
| Mode M9 | |||
|---|---|---|---|
| Quadrant | BADHDUFLAG | Total packets | Discarded packets |
| A | 0 | 12 | 0 |
| B | 0 | 12 | 0 |
| C | 0 | 12 | 0 |
| D | 0 | 12 | 0 |
| Mode M0 | |||
|---|---|---|---|
| Quadrant | BADHDUFLAG | Total packets | Discarded packets |
| A | 0 | 26261 | 2 |
| B | 0 | 26460 | 2 |
| C | 0 | 26949 | 2 |
| D | 0 | 75208 | 2 |
| Quadrant | Total seconds | Saturated seconds | Saturation percentage |
|---|---|---|---|
| A | 12741 | 145 | 1.138058% |
| B | 12742 | 168 | 1.318474% |
| C | 12742 | 216 | 1.695181% |
| D | 12742 | 4644 | 36.446398% |
Noise dominated data is calculated using 1-second bins in cleaned event files. If a bin has >2000 counts, and if more than 50% of those come from <1% of pixels, then it is considered to be noise-dominated and hence unusable.
| Quadrant | # 1 sec bins | Bins with >0 counts | Bins with >2000 counts | High rate bins dominated by noise | Noise dominated (total time) | Noise dominated (detector-on time) | Marked lightcurve |
|---|---|---|---|---|---|---|---|
| A | 13986 | 12743 | 2 | 2 | 0.01% | 0.02% | 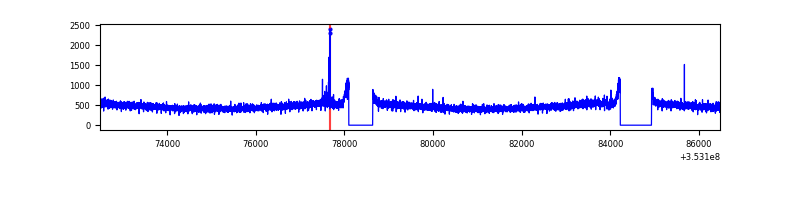 |
| B | 13987 | 12744 | 8 | 8 | 0.06% | 0.06% | 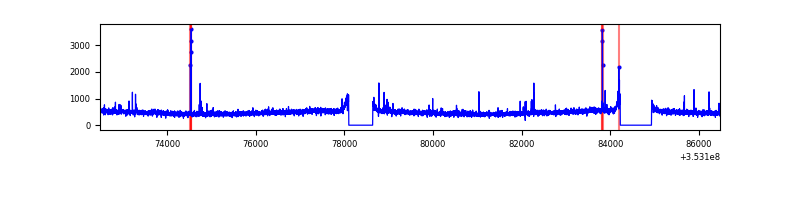 |
| C | 13987 | 12744 | 0 | 0 | 0.00% | 0.00% | 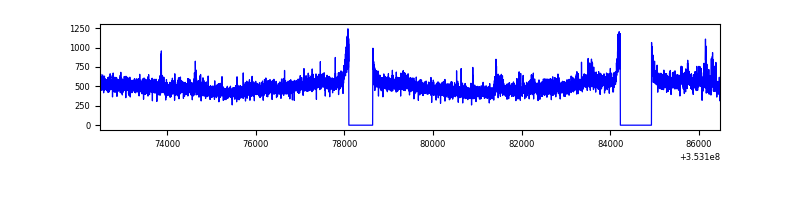 |
| D | 13987 | 12743 | 4287 | 4287 | 30.65% | 33.64% | 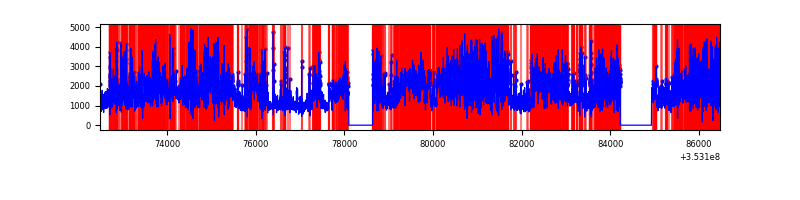 |
Top three noisy pixels from each quadrant. If the there are fewer than three noisy pixels in the level2.evt file, extra rows are filled as -1
| Pixel properties | Quadrant properties | ||||||
|---|---|---|---|---|---|---|---|
| Quadrant | DetID | PixID | Counts | Sigma | Mean | Median | Sigma |
| A | 13 | 254 | 23787 | 70.61 | 1559 | 1527 | 315.2 |
| A | 10 | 253 | 16471 | 47.41 | 1559 | 1527 | 315.2 |
| A | 3 | 137 | 15903 | 45.6 | 1559 | 1527 | 315.2 |
| B | 12 | 111 | 37553 | 121.86 | 1543 | 1504 | 295.8 |
| B | 0 | 190 | 34718 | 112.27 | 1543 | 1504 | 295.8 |
| B | 11 | 111 | 33926 | 109.6 | 1543 | 1504 | 295.8 |
| C | 3 | 233 | 304043 | 861.12 | 1492 | 1500 | 351.3 |
| C | 14 | 238 | 239004 | 676.0 | 1492 | 1500 | 351.3 |
| C | 7 | 247 | 79254 | 221.31 | 1492 | 1500 | 351.3 |
| D | 8 | 195 | 9987450 | 31958.49 | 1311 | 1274 | 312.5 |
| D | 1 | 52 | 5431391 | 17377.86 | 1311 | 1274 | 312.5 |
| D | 7 | 80 | 681807 | 2177.89 | 1311 | 1274 | 312.5 |
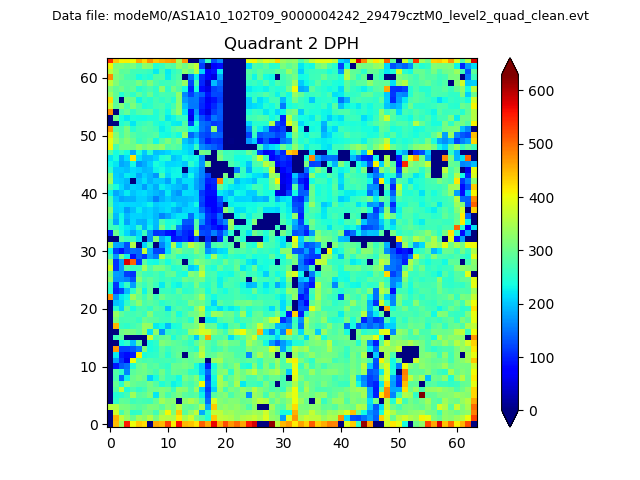
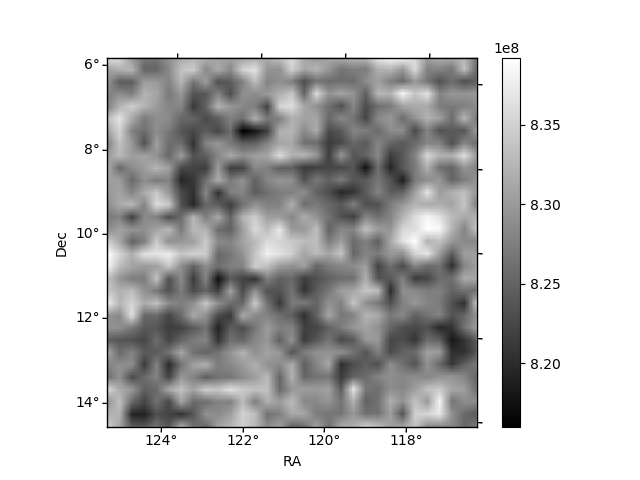
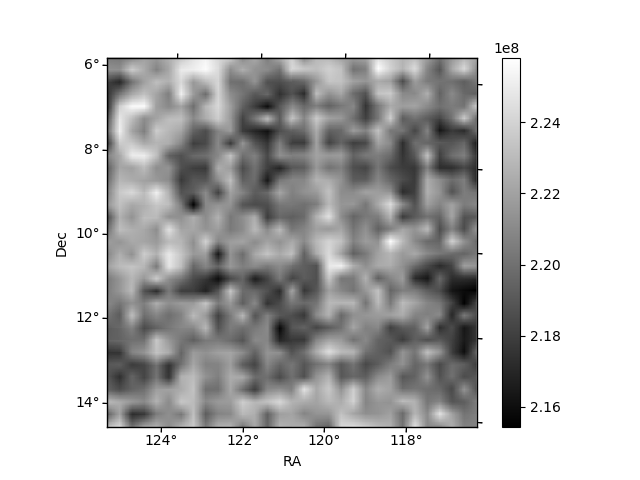
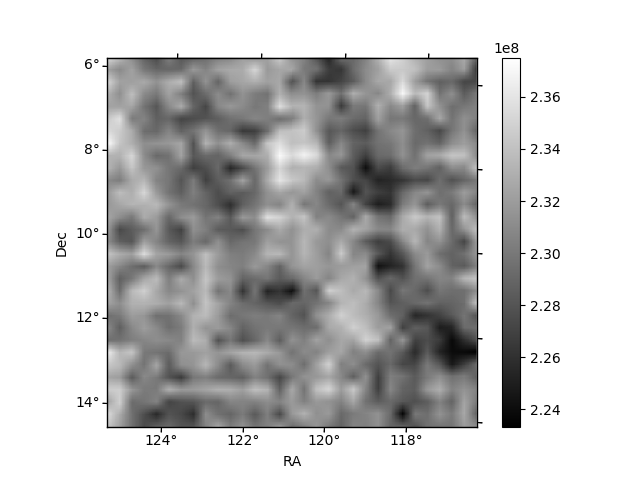
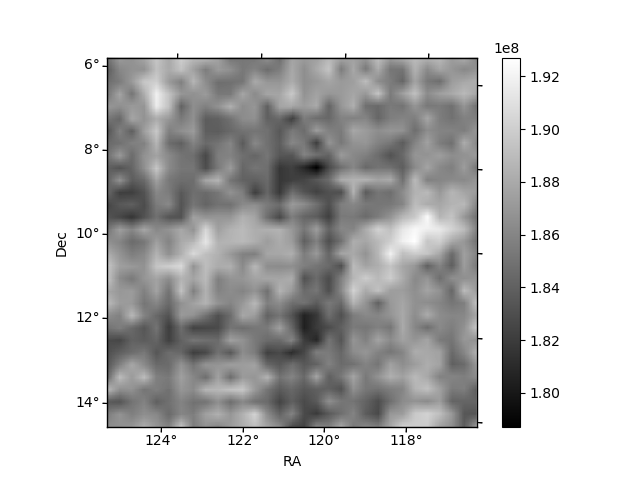
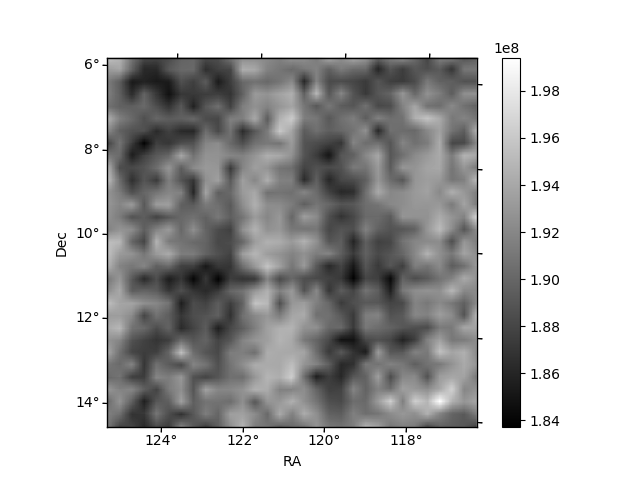
Histogram calculated using DETX and DETY for each event in the final _common_clean file
| Quadrant A | 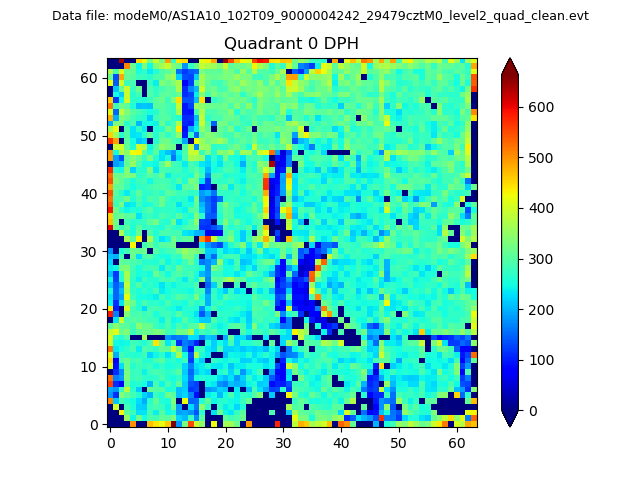 |
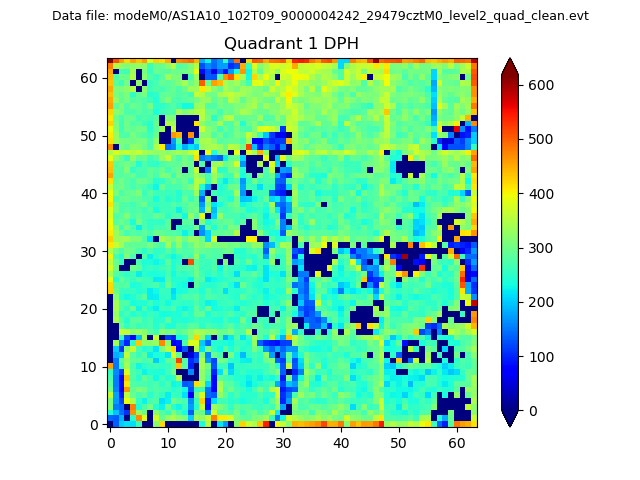 |
Quadrant B |
|---|---|---|---|
| Quadrant D | 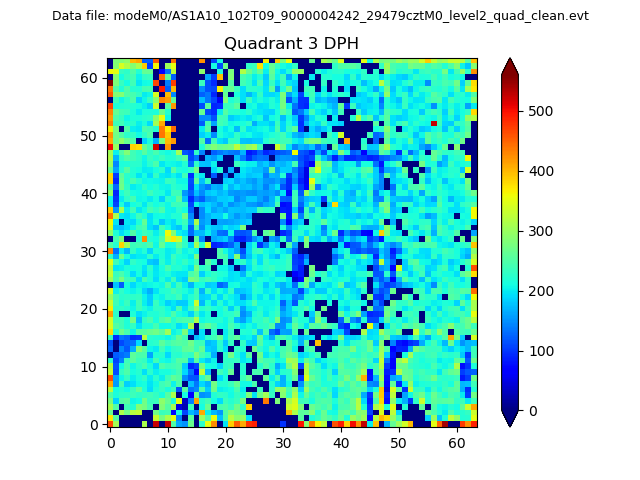 |
 |
Quadrant C |
| Plot type | Count rate plots | Images |
|---|---|---|
| Comparison with Poisson distribution Blue bars denote a histogram of data divided into 1 sec bins. Red curve is a Poisson curve with rate = median count rate of data. |
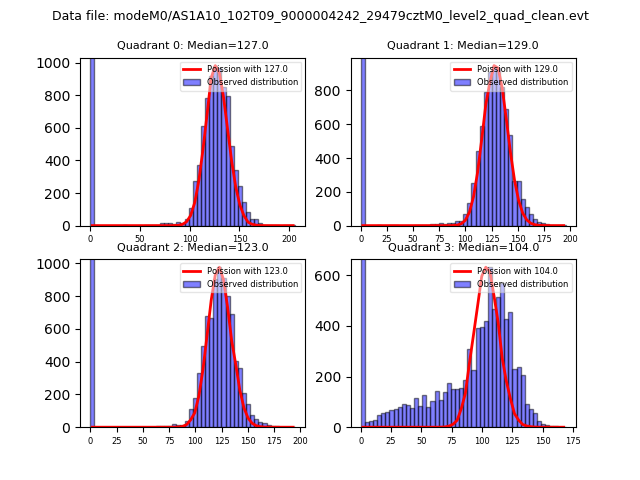 |
 |
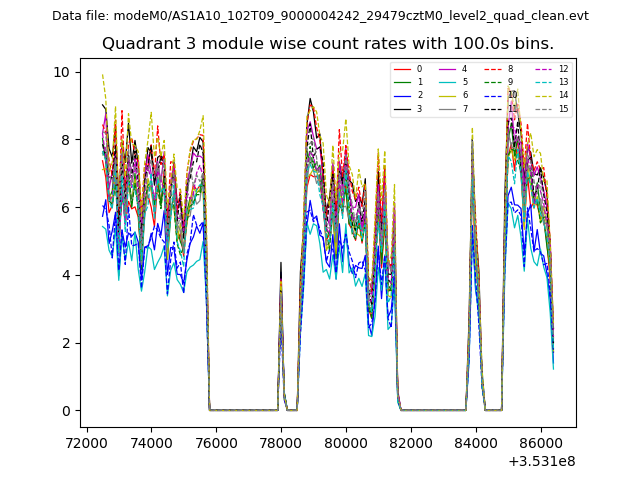
| Quadrant-wise count rates Data is divided into 100 sec bins |
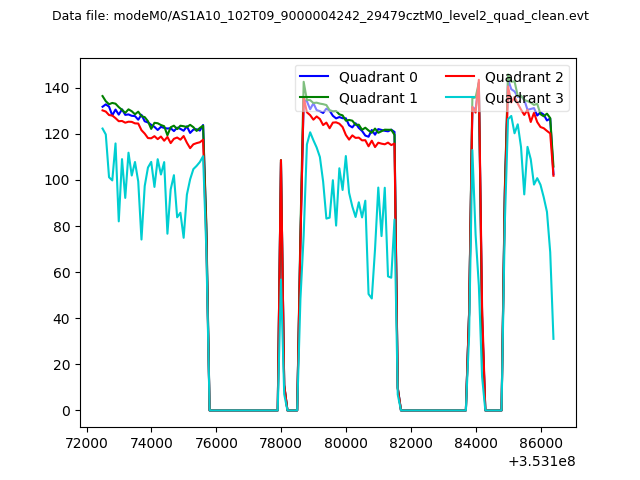 |
|
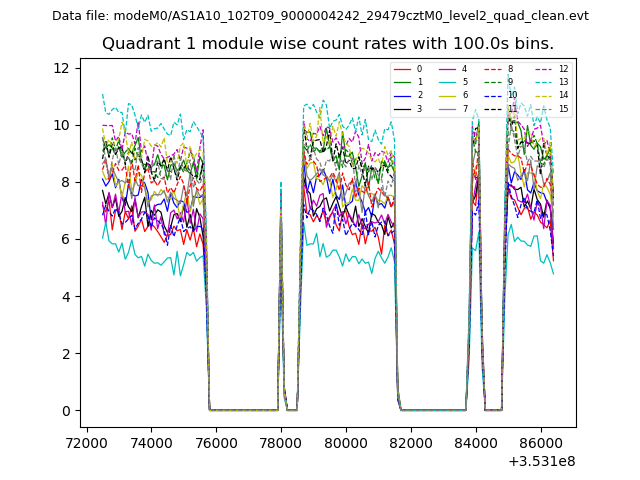
| Module-wise count rates for Quadrant A Data is divided into 100 sec bins |
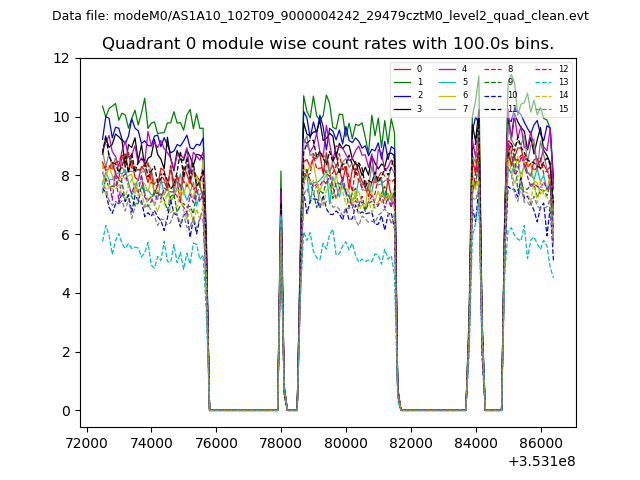 |
 |
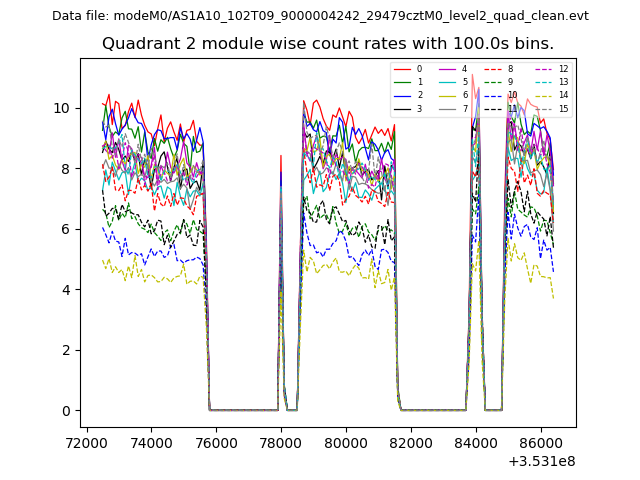
| Module-wise count rates for Quadrant B Data is divided into 100 sec bins |
 |
 |
| Module-wise count rates for Quadrant C Data is divided into 100 sec bins |
 |
 |
| Module-wise count rates for Quadrant D Data is divided into 100 sec bins |
 |
 |
| Parameter | Plot |
|---|---|
| CZT HV Monitor | 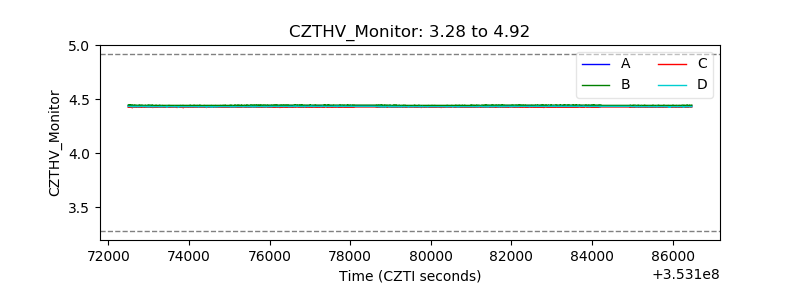 |
| D_VDD | 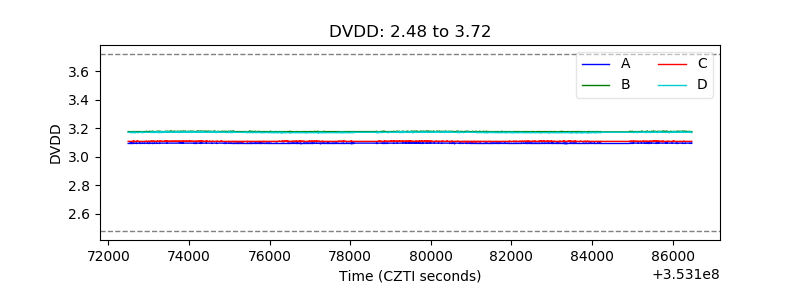 |
| Temperature 1 | 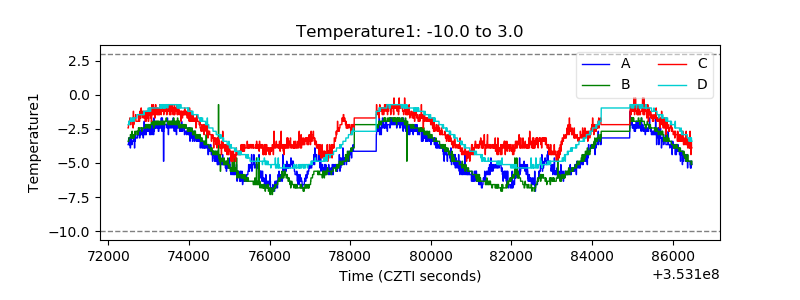 |
| Veto HV Monitor | 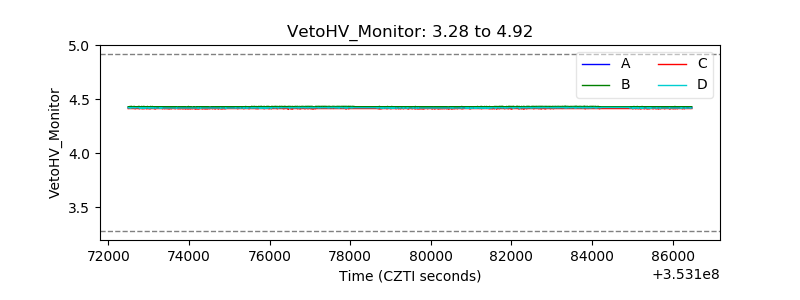 |
| Veto LLD | 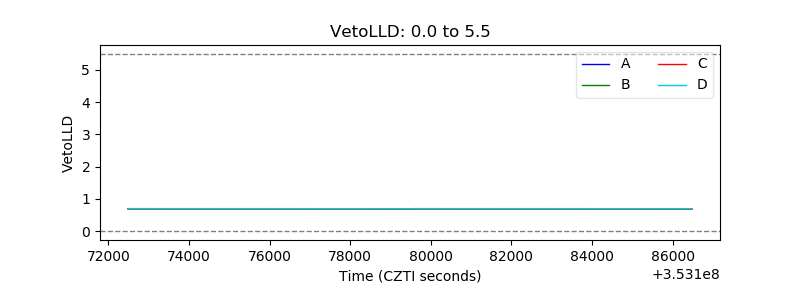 |
| Alpha Counter | 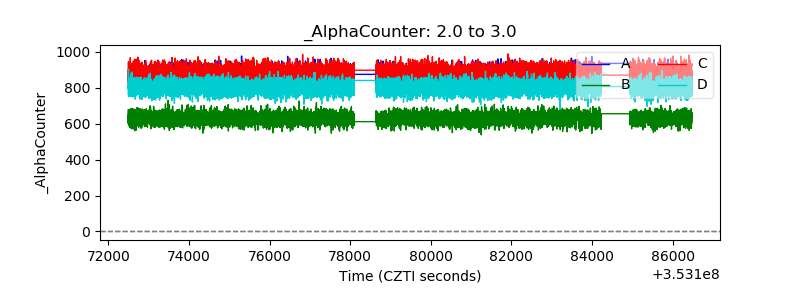 |
| _CPM_Rate | 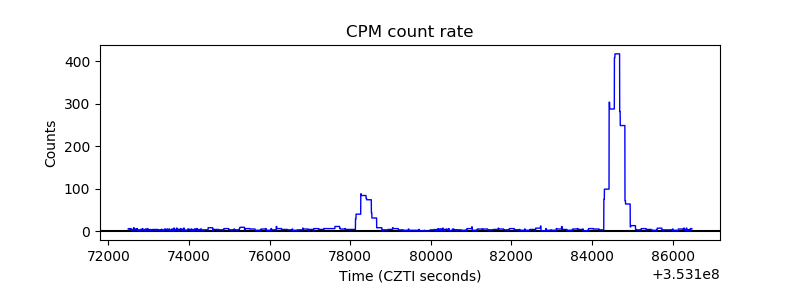 |
| CZT Counter | 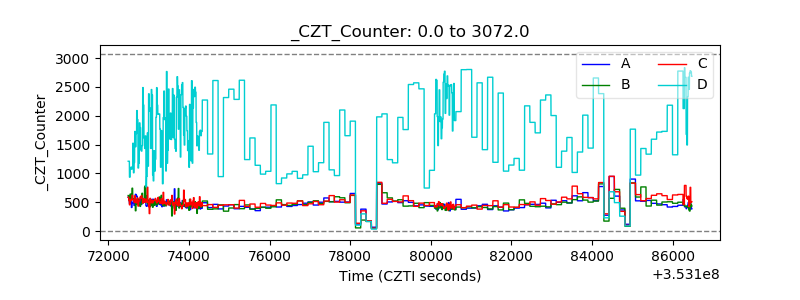 |
| +2.5 Volts monitor |  |
| +5 Volts monitor |  |
| _ROLL_ROT | 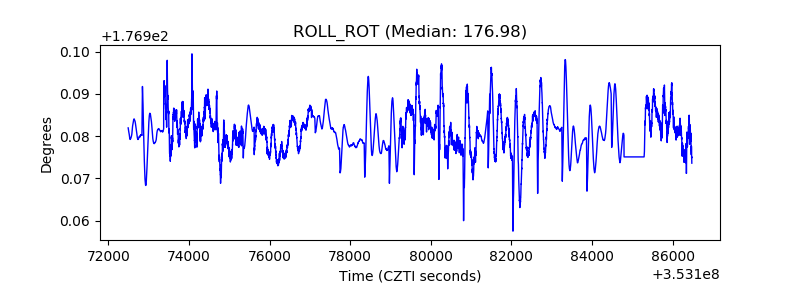 |
| _Roll_DEC | 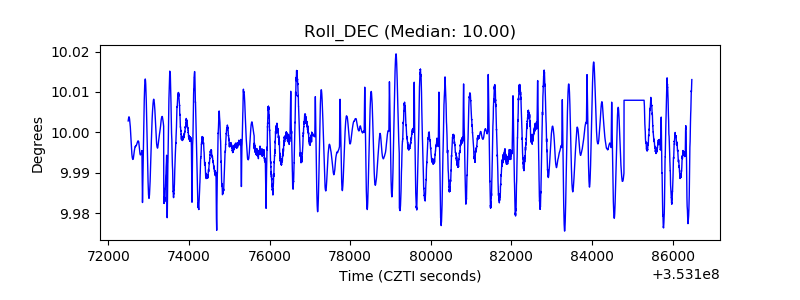 |
| _Roll_RA | 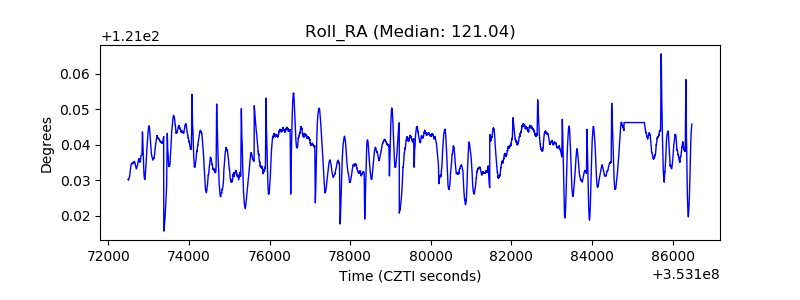 |
| Veto Counter | 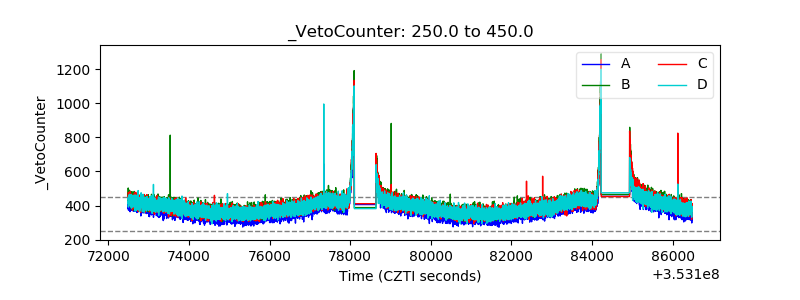 |