| Param | Original file | Final file |
|---|---|---|
| Filename | modeM0/AS1A10_064T03_9000004246cztM0_level2.fits | modeM0/AS1A10_064T03_9000004246cztM0_level2_quad_clean.evt |
| Size (bytes) | 839,819,520 | 790,286,400 |
| Size | 800.9 MB | 753.7 MB |
| Events in quadrant A | 5,476,460 | 5,324,165 |
| Events in quadrant B | 5,249,722 | 5,344,508 |
| Events in quadrant C | 5,305,928 | 4,928,113 |
| Events in quadrant D | 3,365,244 | 2,323,211 |
| Mode SS | |||
|---|---|---|---|
| Quadrant | BADHDUFLAG | Total packets | Discarded packets |
| A | 0 | 1786 | 0 |
| B | 0 | 1786 | 0 |
| C | 0 | 1786 | 0 |
| D | 0 | 1786 | 0 |
| Mode M0 | |||
|---|---|---|---|
| Quadrant | BADHDUFLAG | Total packets | Discarded packets |
| A | 0 | 181952 | 0 |
| B | 0 | 185452 | 0 |
| C | 0 | 212894 | 0 |
| D | 0 | 596241 | 0 |
| Mode M9 | |||
|---|---|---|---|
| Quadrant | BADHDUFLAG | Total packets | Discarded packets |
| A | 0 | 144 | 0 |
| B | 0 | 144 | 0 |
| C | 0 | 144 | 0 |
| D | 0 | 144 | 0 |
| Quadrant | Total seconds | Saturated seconds | Saturation percentage |
|---|---|---|---|
| A | 87680 | 839 | 0.956889% |
| B | 87680 | 1082 | 1.234033% |
| C | 87680 | 3186 | 3.633668% |
| D | 87680 | 52603 | 59.994297% |
Noise dominated data is calculated using 1-second bins in cleaned event files. If a bin has >2000 counts, and if more than 50% of those come from <1% of pixels, then it is considered to be noise-dominated and hence unusable.
| Quadrant | # 1 sec bins | Bins with >0 counts | Bins with >2000 counts | High rate bins dominated by noise | Noise dominated (total time) | Noise dominated (detector-on time) | Marked lightcurve |
|---|---|---|---|---|---|---|---|
| A | 102130 | 87678 | 0 | 0 | 0.00% | 0.00% | 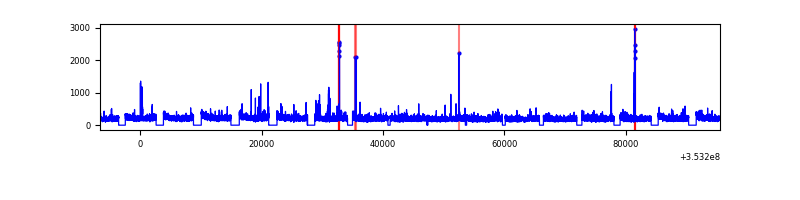 |
| B | 102130 | 87677 | 0 | 0 | 0.00% | 0.00% | 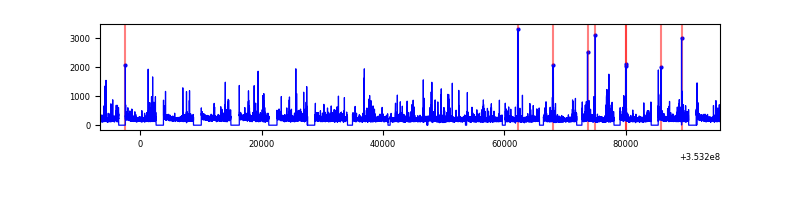 |
| C | 102130 | 87622 | 0 | 0 | 0.00% | 0.00% | 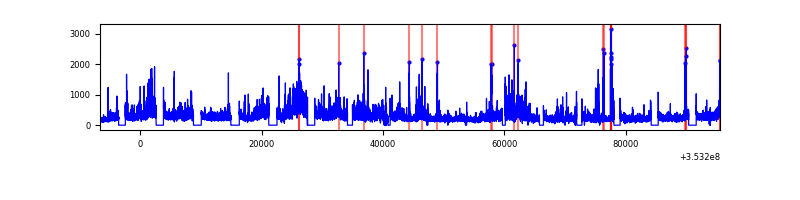 |
| D | 102130 | 87329 | 0 | 0 | 0.00% | 0.00% | 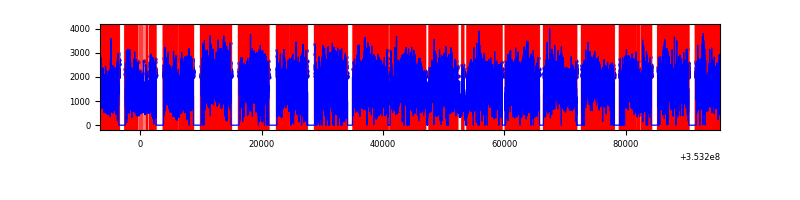 |
Top three noisy pixels from each quadrant. If the there are fewer than three noisy pixels in the level2.evt file, extra rows are filled as -1
| Pixel properties | Quadrant properties | ||||||
|---|---|---|---|---|---|---|---|
| Quadrant | DetID | PixID | Counts | Sigma | Mean | Median | Sigma |
| A | 0 | 29 | 4707 | 9.68 | 1427 | 1346 | 347.0 |
| A | 7 | 110 | 4287 | 8.47 | 1427 | 1346 | 347.0 |
| A | 9 | 19 | 4119 | 7.99 | 1427 | 1346 | 347.0 |
| B | 2 | 9 | 4115 | 10.19 | 1392 | 1333 | 273.1 |
| B | 3 | 17 | 3532 | 8.05 | 1392 | 1333 | 273.1 |
| B | 2 | 8 | 3467 | 7.81 | 1392 | 1333 | 273.1 |
| C | 12 | 241 | 3660 | 6.58 | 1404 | 1324 | 355.2 |
| C | 3 | 187 | 3658 | 6.57 | 1404 | 1324 | 355.2 |
| C | 3 | 126 | 3485 | 6.08 | 1404 | 1324 | 355.2 |
| D | 4 | 246 | 2604 | 6.77 | 962 | 879 | 255.0 |
| D | 15 | 46 | 2589 | 6.71 | 962 | 879 | 255.0 |
| D | 6 | 67 | 2416 | 6.03 | 962 | 879 | 255.0 |
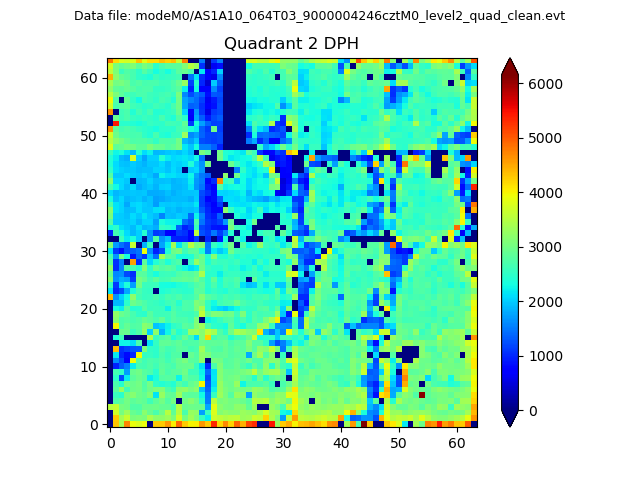
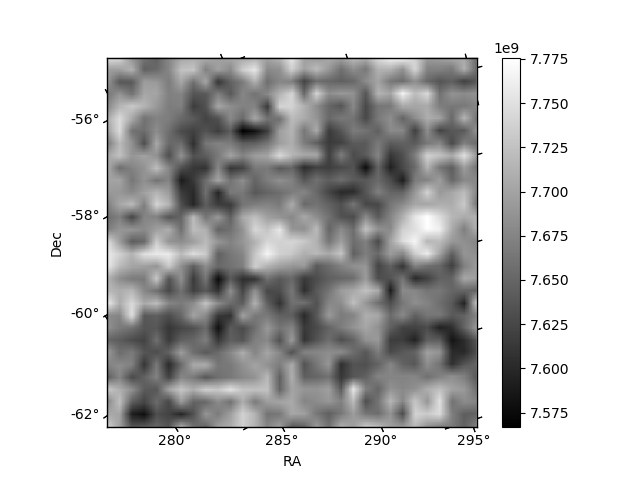
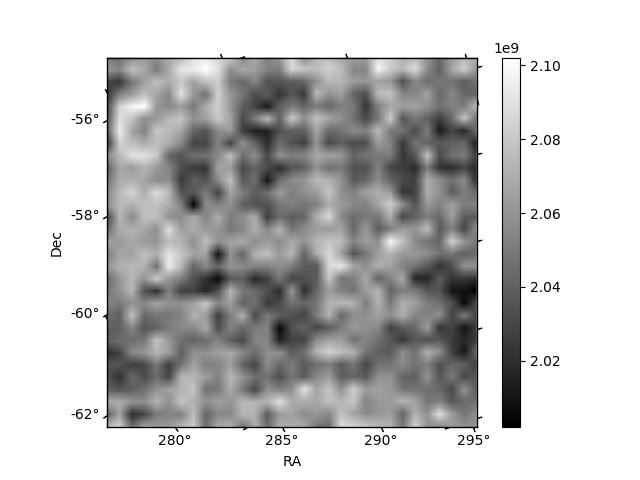
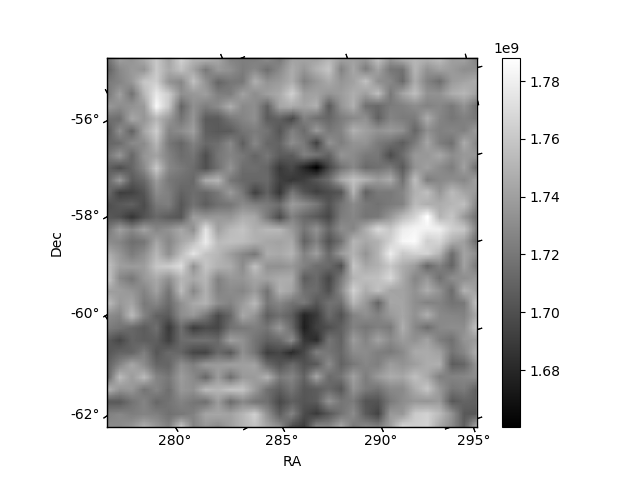
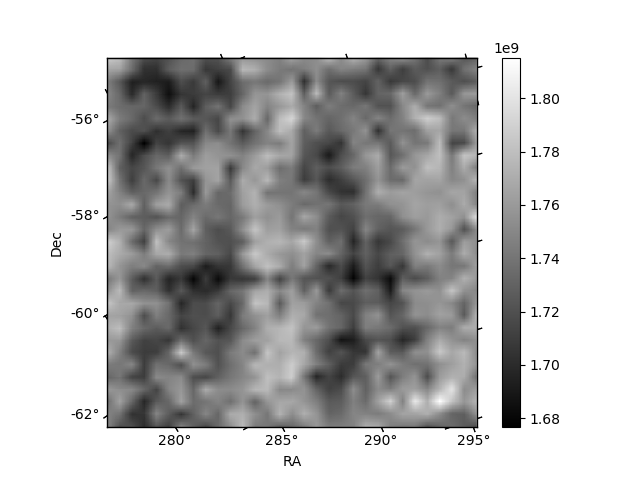
Histogram calculated using DETX and DETY for each event in the final _common_clean file
| Quadrant A | 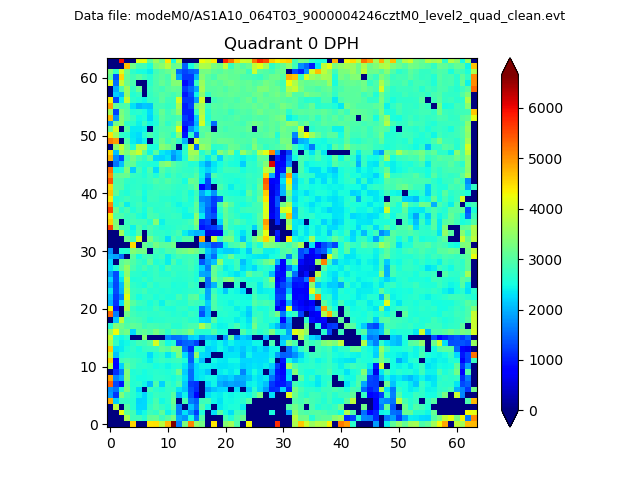 |
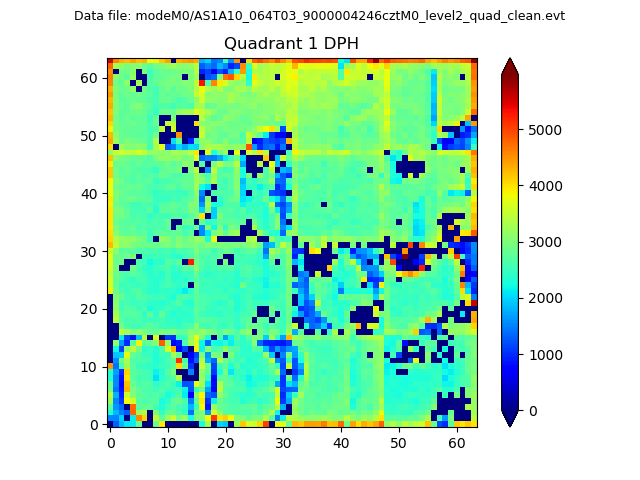 |
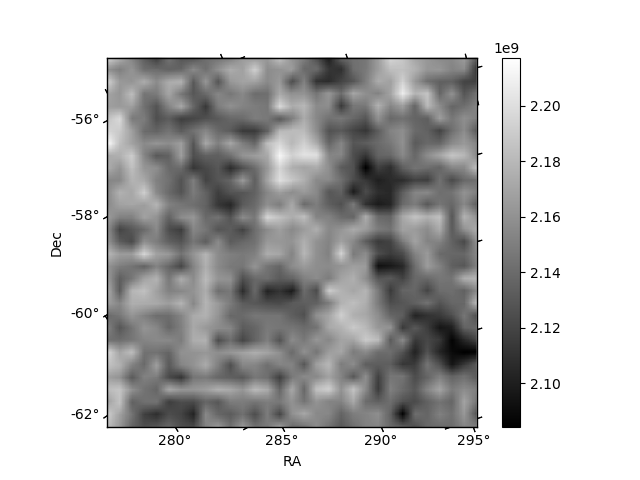
Quadrant B |
|---|---|---|---|
| Quadrant D | 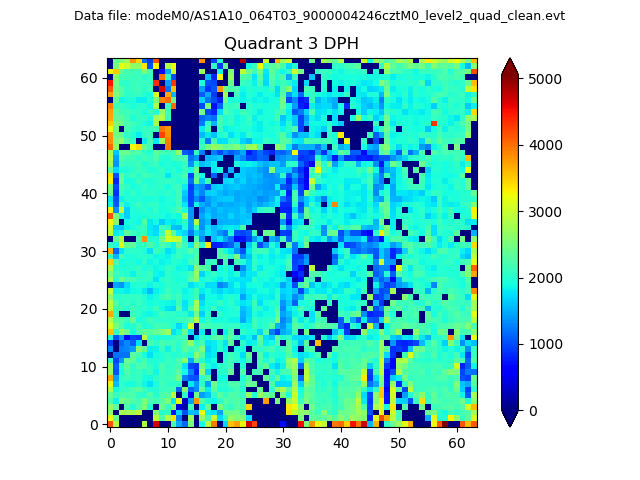 |
 |
Quadrant C |
| Plot type | Count rate plots | Images |
|---|---|---|
| Comparison with Poisson distribution Blue bars denote a histogram of data divided into 1 sec bins. Red curve is a Poisson curve with rate = median count rate of data. |
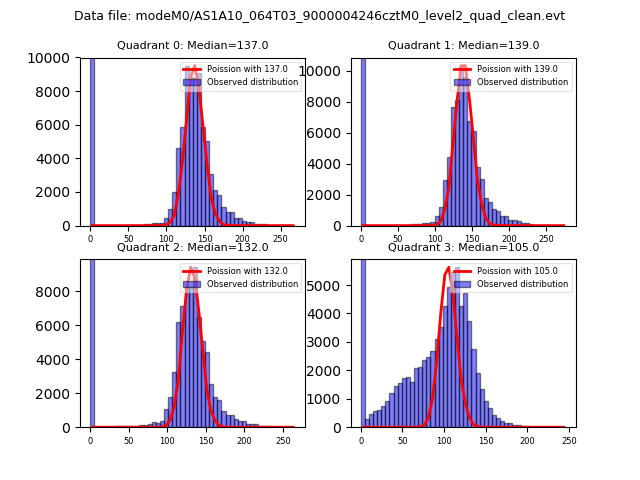 |
 |
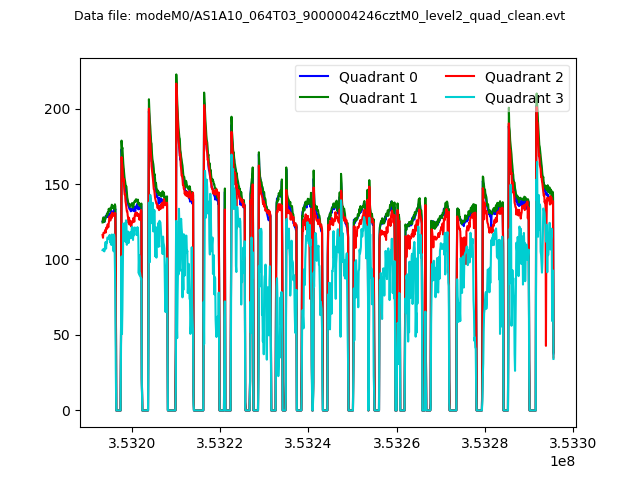
| Quadrant-wise count rates Data is divided into 100 sec bins |
 |
|
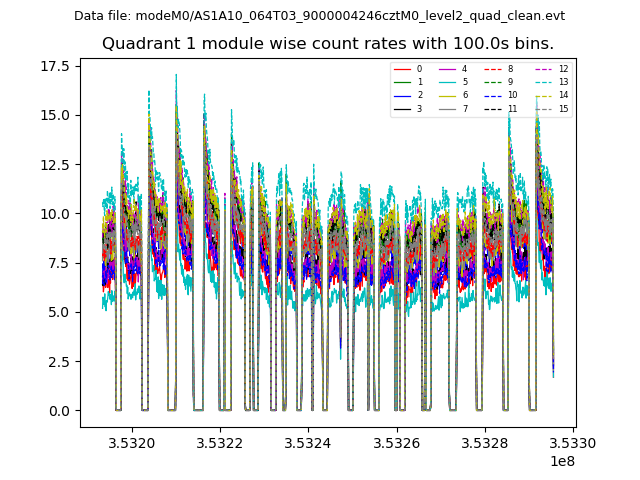
| Module-wise count rates for Quadrant A Data is divided into 100 sec bins |
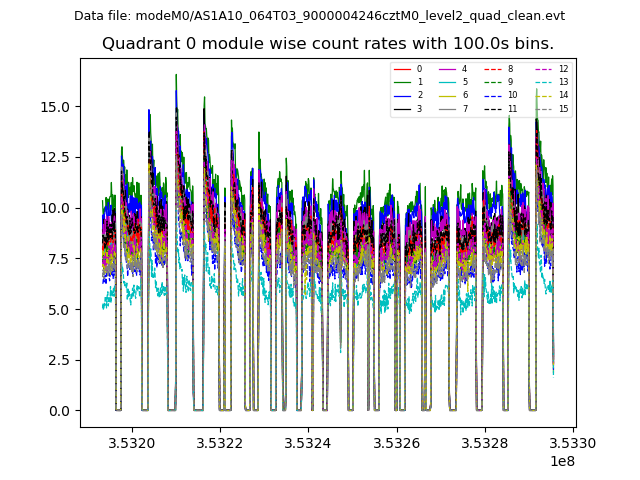 |
 |
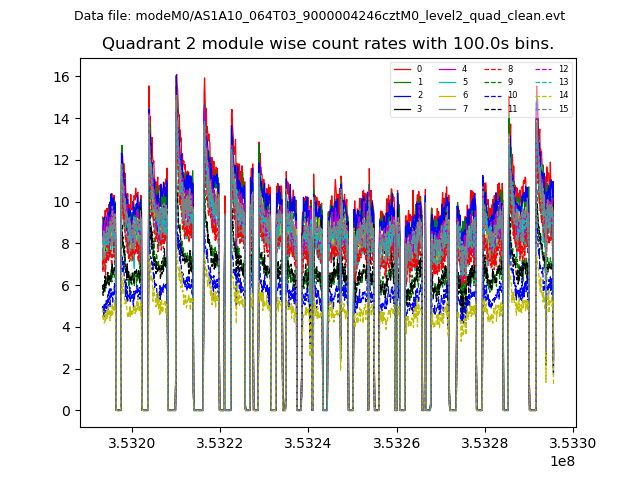
| Module-wise count rates for Quadrant B Data is divided into 100 sec bins |
 |
 |
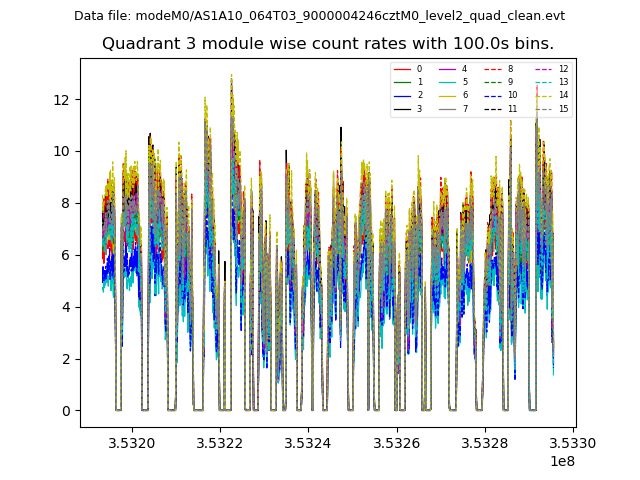
| Module-wise count rates for Quadrant C Data is divided into 100 sec bins |
 |
 |
| Module-wise count rates for Quadrant D Data is divided into 100 sec bins |
 |
 |
| Parameter | Plot |
|---|---|
| CZT HV Monitor | 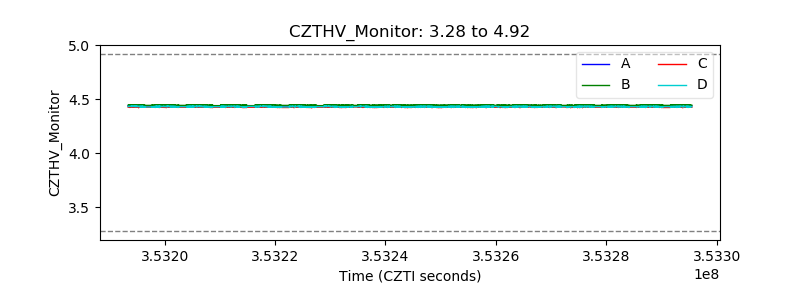 |
| D_VDD | 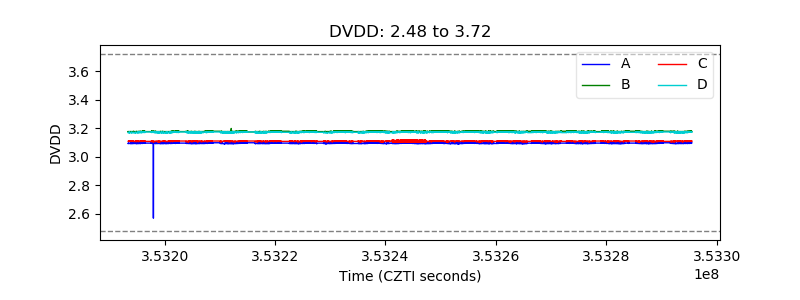 |
| Temperature 1 | 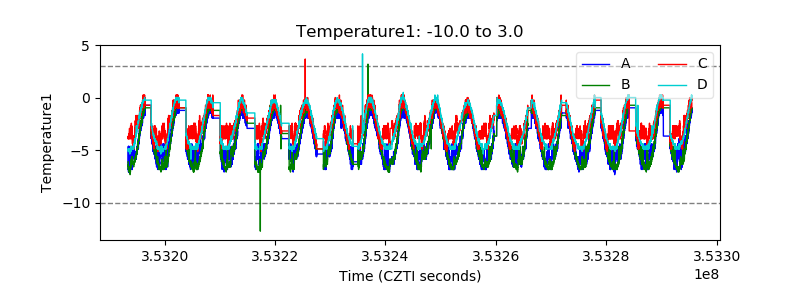 |
| Veto HV Monitor | 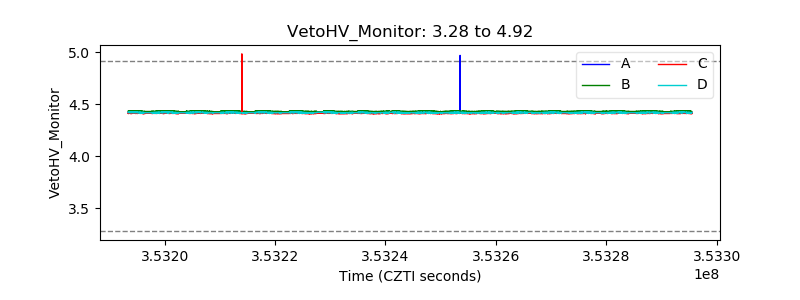 |
| Veto LLD | 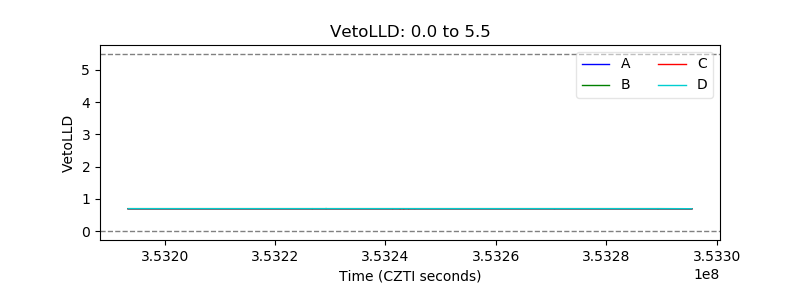 |
| Alpha Counter | 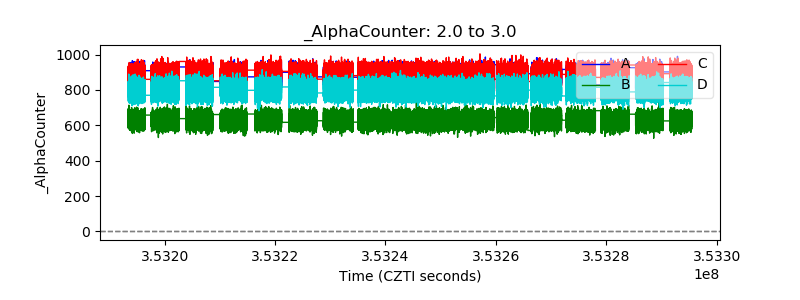 |
| _CPM_Rate | 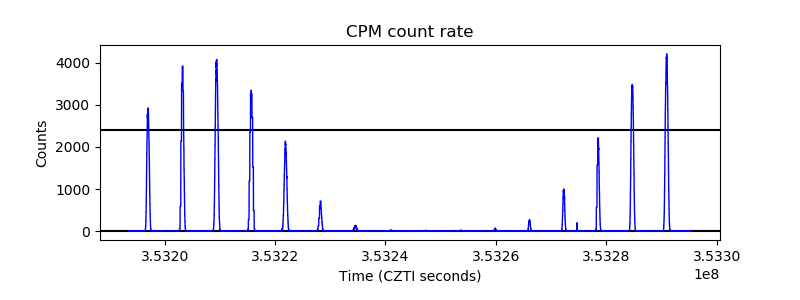 |
| CZT Counter | 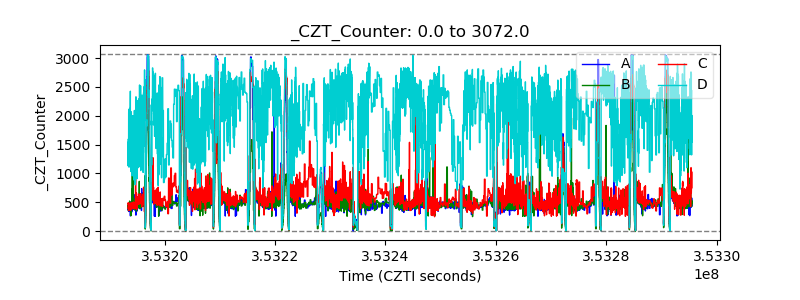 |
| +2.5 Volts monitor | 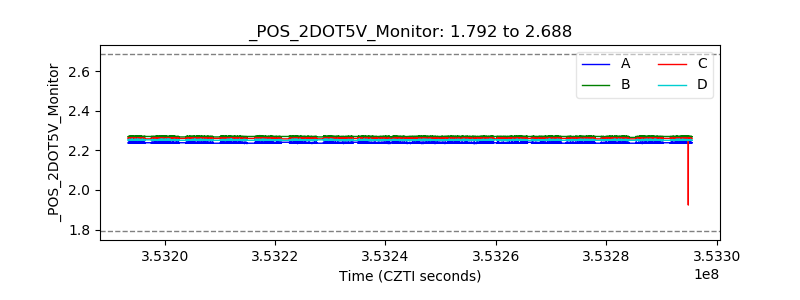 |
| +5 Volts monitor | 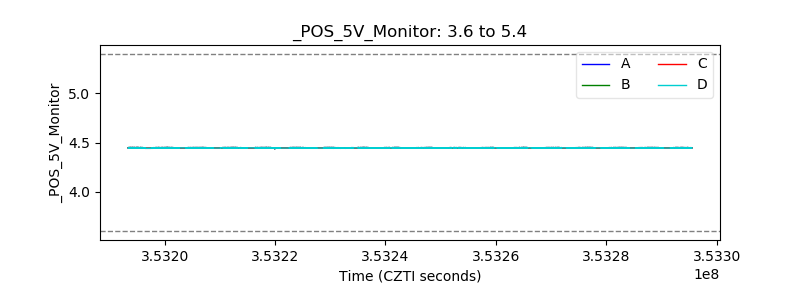 |
| _ROLL_ROT | 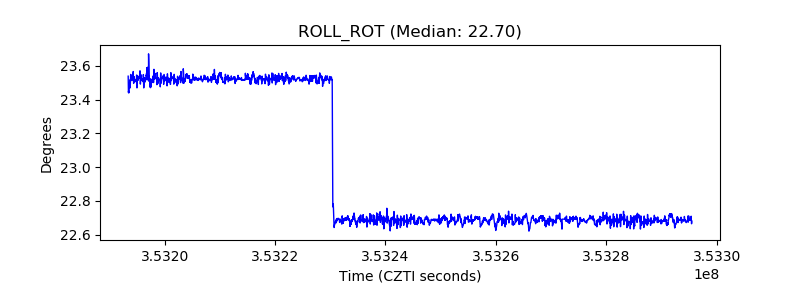 |
| _Roll_DEC | 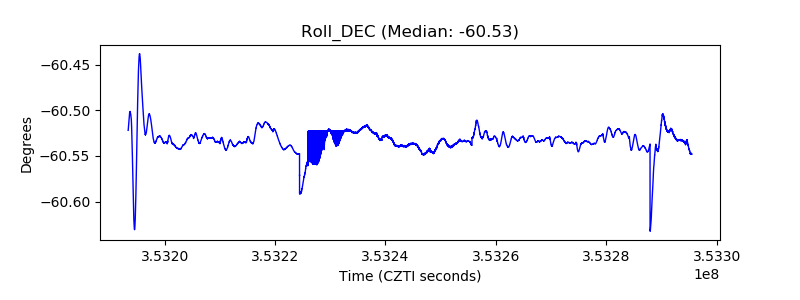 |
| _Roll_RA | 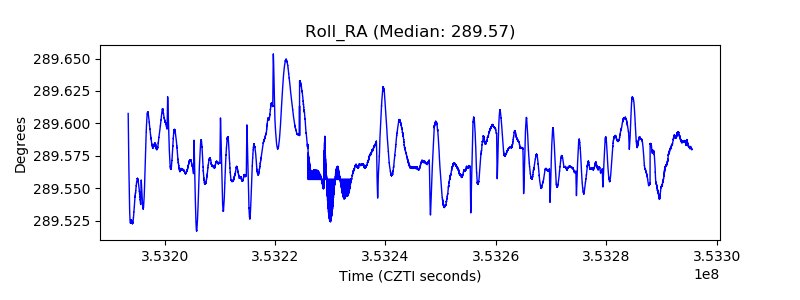 |
| Veto Counter | 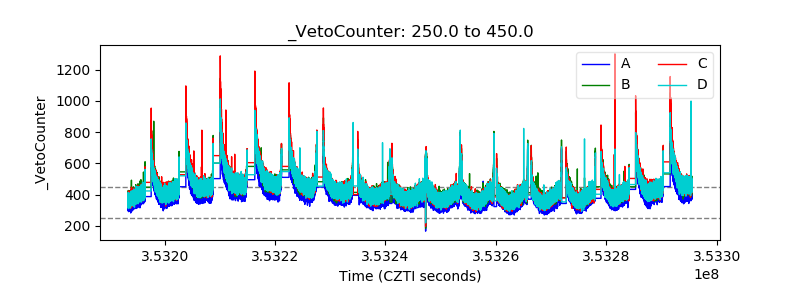 |