| Param | Original file | Final file |
|---|---|---|
| Filename | modeM0/AS1A10_064T03_9000004246_29481cztM0_level2.evt | modeM0/AS1A10_064T03_9000004246_29481cztM0_level2_quad_clean.evt |
| Size (bytes) | 483,022,080 | 84,438,720 |
| Size | 460.6 MB | 80.5 MB |
| Events in quadrant A | 2,124,781 | 595,321 |
| Events in quadrant B | 2,223,566 | 608,465 |
| Events in quadrant C | 2,329,063 | 571,921 |
| Events in quadrant D | 7,650,298 | 469,021 |
| Mode SS | |||
|---|---|---|---|
| Quadrant | BADHDUFLAG | Total packets | Discarded packets |
| A | 0 | 92 | 0 |
| B | 0 | 92 | 0 |
| C | 0 | 92 | 0 |
| D | 0 | 92 | 0 |
| Mode M0 | |||
|---|---|---|---|
| Quadrant | BADHDUFLAG | Total packets | Discarded packets |
| A | 0 | 9185 | 1 |
| B | 0 | 9433 | 1 |
| C | 0 | 9681 | 1 |
| D | 0 | 25798 | 1 |
| Mode M9 | |||
|---|---|---|---|
| Quadrant | BADHDUFLAG | Total packets | Discarded packets |
| A | 0 | 11 | 0 |
| B | 0 | 11 | 0 |
| C | 0 | 11 | 0 |
| D | 0 | 11 | 0 |
| Quadrant | Total seconds | Saturated seconds | Saturation percentage |
|---|---|---|---|
| A | 4430 | 9 | 0.203160% |
| B | 4430 | 29 | 0.654628% |
| C | 4430 | 39 | 0.880361% |
| D | 4430 | 1233 | 27.832957% |
Noise dominated data is calculated using 1-second bins in cleaned event files. If a bin has >2000 counts, and if more than 50% of those come from <1% of pixels, then it is considered to be noise-dominated and hence unusable.
| Quadrant | # 1 sec bins | Bins with >0 counts | Bins with >2000 counts | High rate bins dominated by noise | Noise dominated (total time) | Noise dominated (detector-on time) | Marked lightcurve |
|---|---|---|---|---|---|---|---|
| A | 5530 | 4431 | 0 | 0 | 0.00% | 0.00% |  |
| B | 5530 | 4431 | 3 | 3 | 0.05% | 0.07% |  |
| C | 5530 | 4431 | 1 | 1 | 0.02% | 0.02% |  |
| D | 5530 | 4431 | 1194 | 1194 | 21.59% | 26.95% | 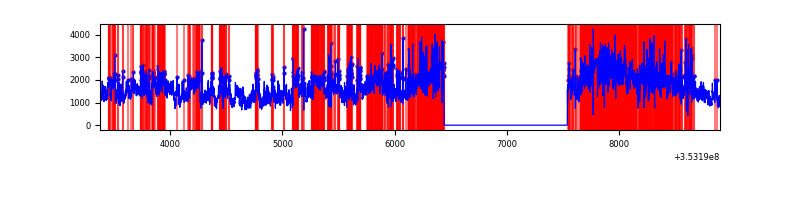 |
Top three noisy pixels from each quadrant. If the there are fewer than three noisy pixels in the level2.evt file, extra rows are filled as -1
| Pixel properties | Quadrant properties | ||||||
|---|---|---|---|---|---|---|---|
| Quadrant | DetID | PixID | Counts | Sigma | Mean | Median | Sigma |
| A | 13 | 254 | 8734 | 73.3 | 549 | 539 | 111.8 |
| A | 3 | 137 | 5281 | 42.42 | 549 | 539 | 111.8 |
| A | 0 | 226 | 4620 | 36.5 | 549 | 539 | 111.8 |
| B | 0 | 230 | 48814 | 469.11 | 547 | 534 | 102.9 |
| B | 0 | 190 | 18265 | 172.28 | 547 | 534 | 102.9 |
| B | 12 | 111 | 12669 | 117.91 | 547 | 534 | 102.9 |
| C | 3 | 233 | 112670 | 901.61 | 529 | 532 | 124.4 |
| C | 14 | 238 | 87335 | 697.91 | 529 | 532 | 124.4 |
| C | 7 | 247 | 59013 | 470.2 | 529 | 532 | 124.4 |
| D | 8 | 195 | 4189179 | 37181.66 | 475 | 462 | 112.7 |
| D | 7 | 80 | 898812 | 7974.31 | 475 | 462 | 112.7 |
| D | 1 | 52 | 493675 | 4378.07 | 475 | 462 | 112.7 |
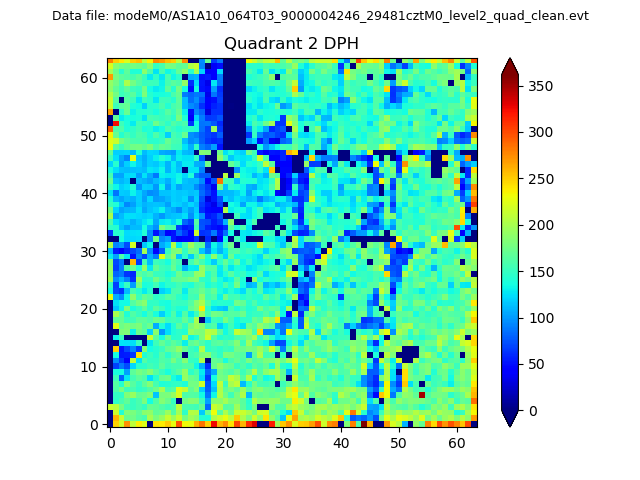
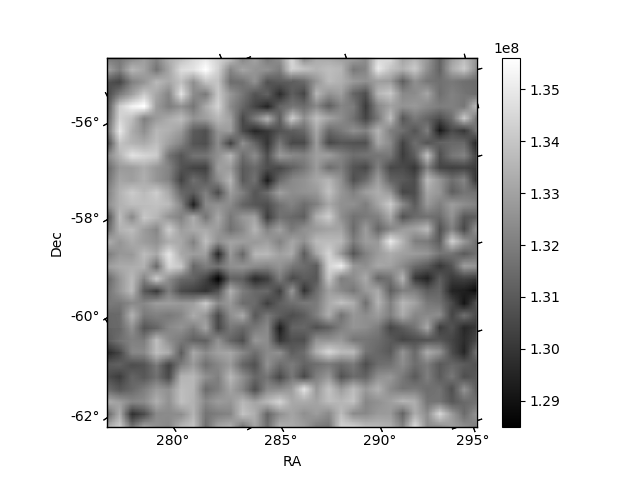
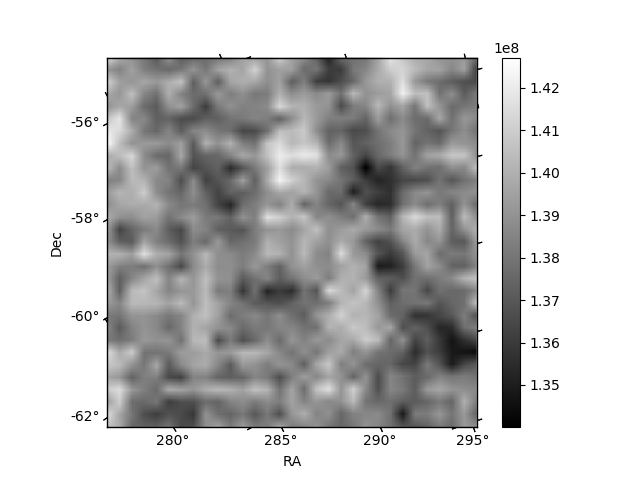
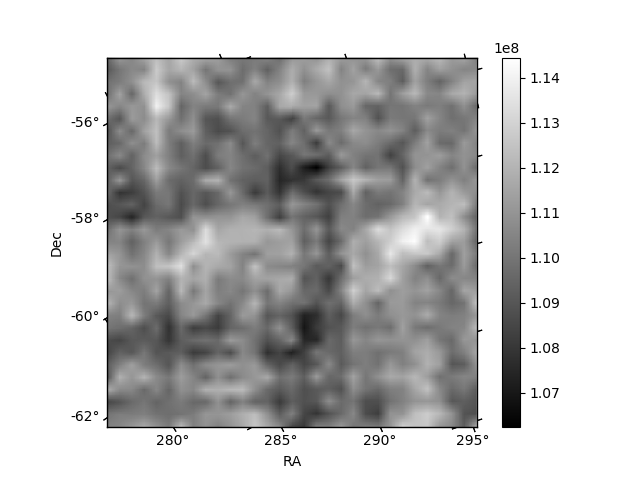
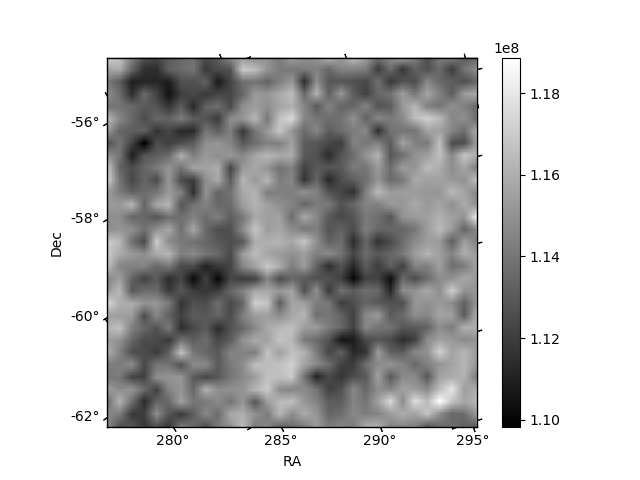
Histogram calculated using DETX and DETY for each event in the final _common_clean file
| Quadrant A | 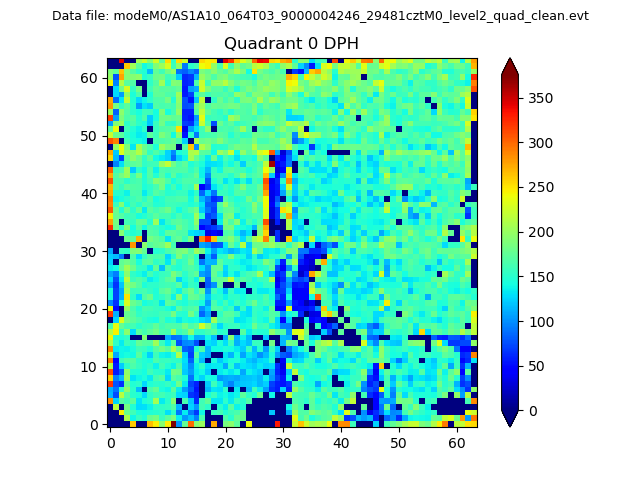 |
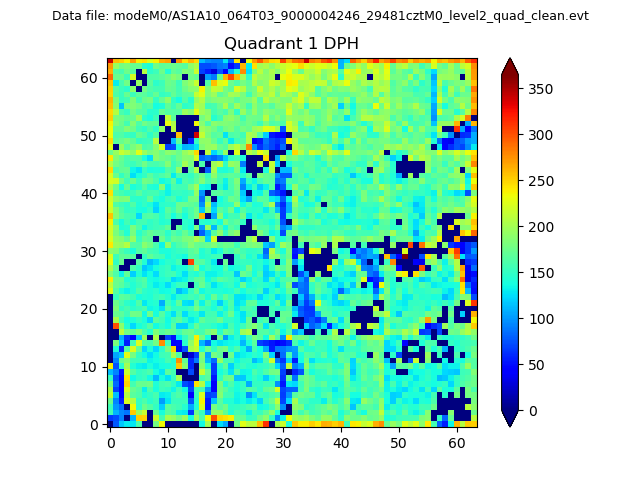 |
Quadrant B |
|---|---|---|---|
| Quadrant D | 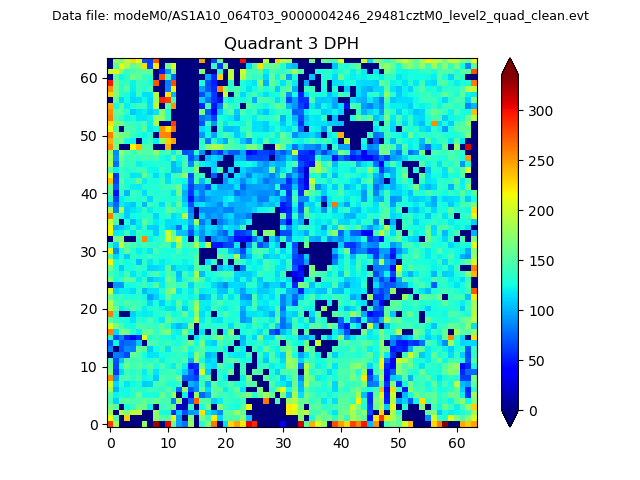 |
 |
Quadrant C |
| Plot type | Count rate plots | Images |
|---|---|---|
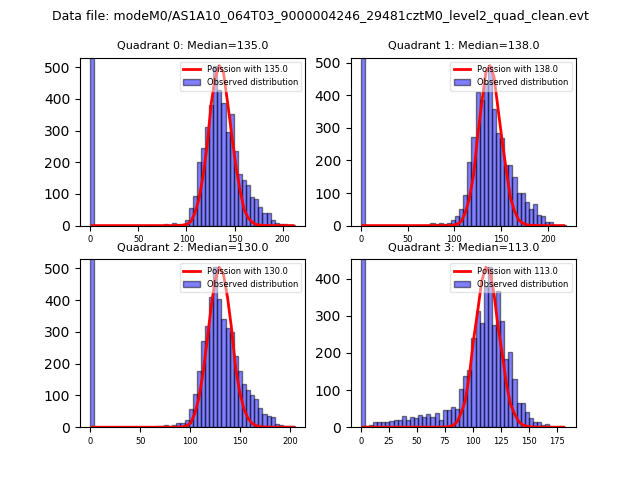
| Comparison with Poisson distribution Blue bars denote a histogram of data divided into 1 sec bins. Red curve is a Poisson curve with rate = median count rate of data. |
 |
 |
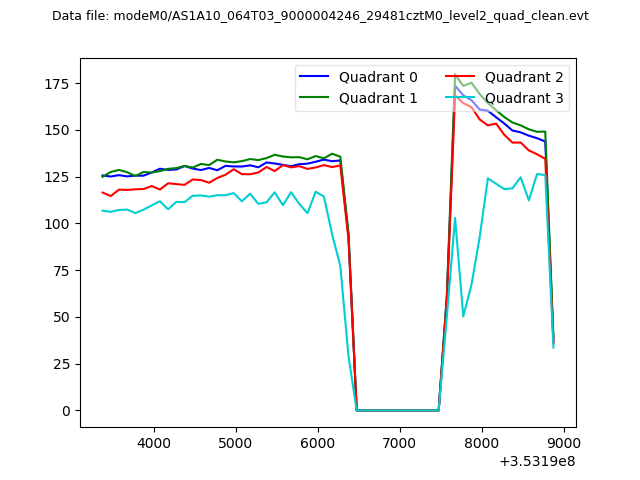
| Quadrant-wise count rates Data is divided into 100 sec bins |
 |
|
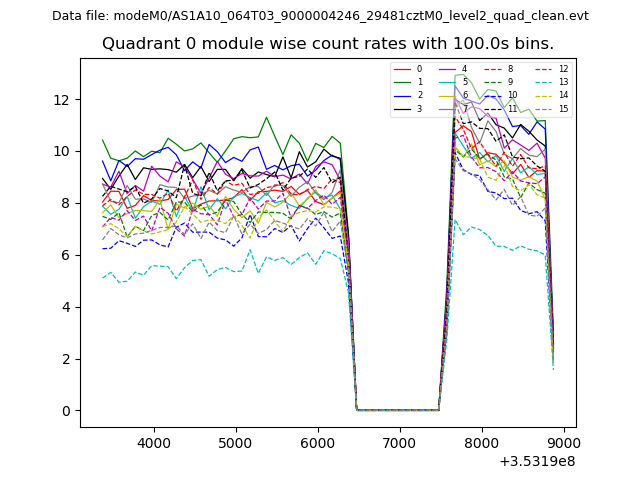
| Module-wise count rates for Quadrant A Data is divided into 100 sec bins |
 |
 |
| Module-wise count rates for Quadrant B Data is divided into 100 sec bins |
 |
 |
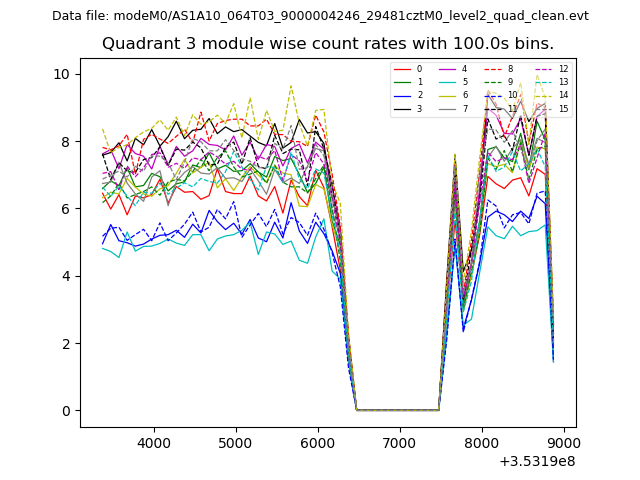
| Module-wise count rates for Quadrant C Data is divided into 100 sec bins |
 |
 |
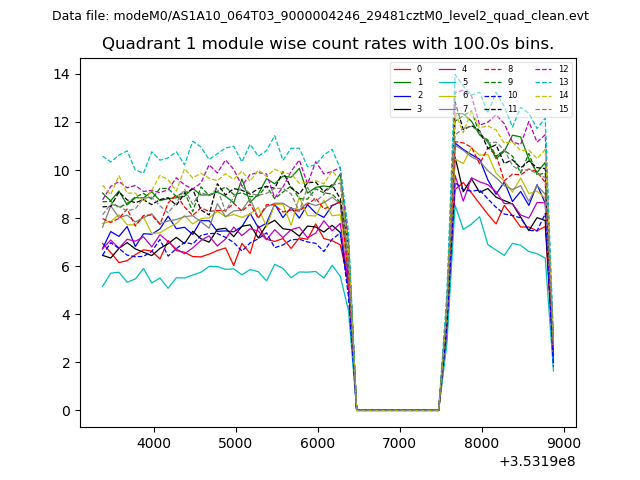
| Module-wise count rates for Quadrant D Data is divided into 100 sec bins |
 |
 |
| Parameter | Plot |
|---|---|
| CZT HV Monitor | 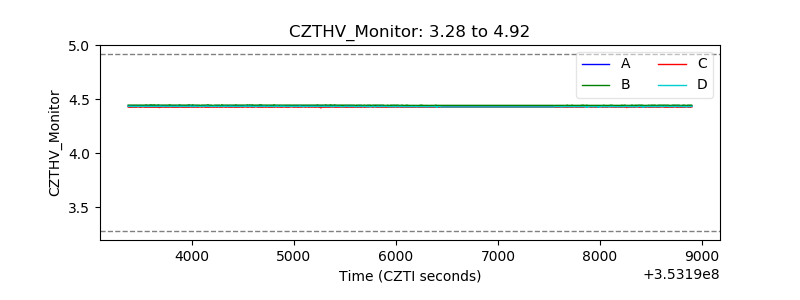 |
| D_VDD | 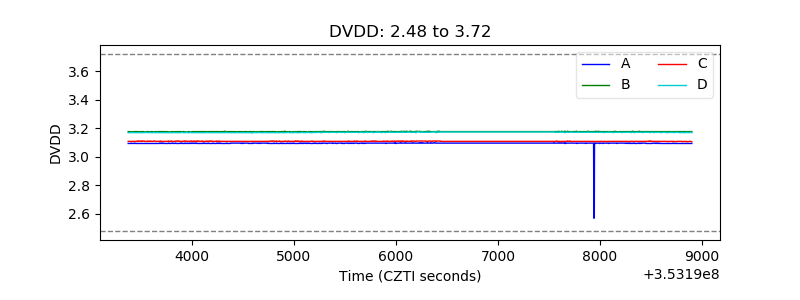 |
| Temperature 1 |  |
| Veto HV Monitor | 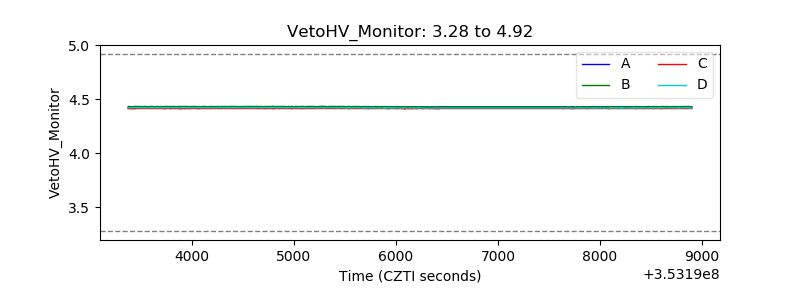 |
| Veto LLD | 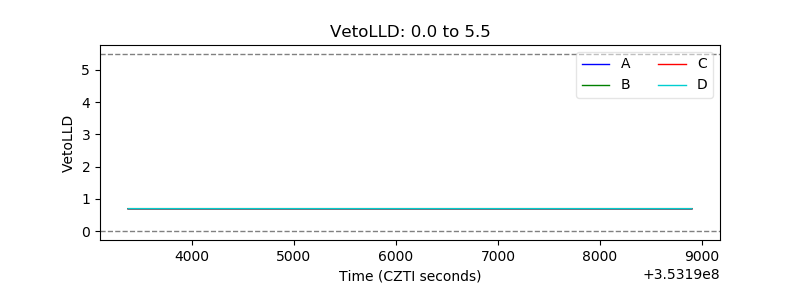 |
| Alpha Counter | 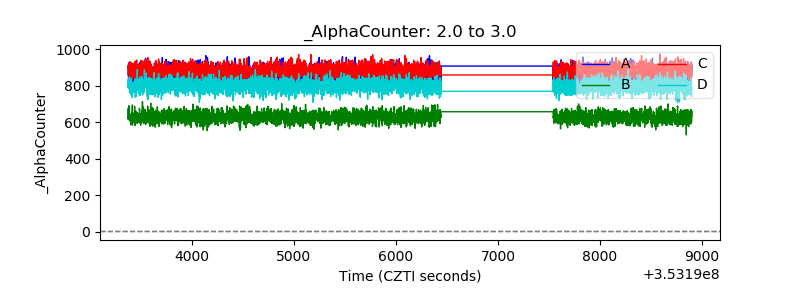 |
| _CPM_Rate | 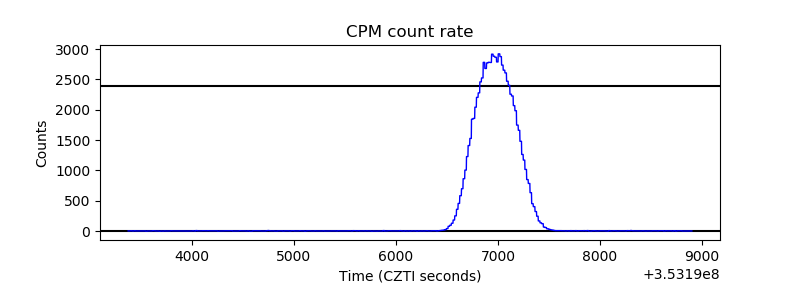 |
| CZT Counter | 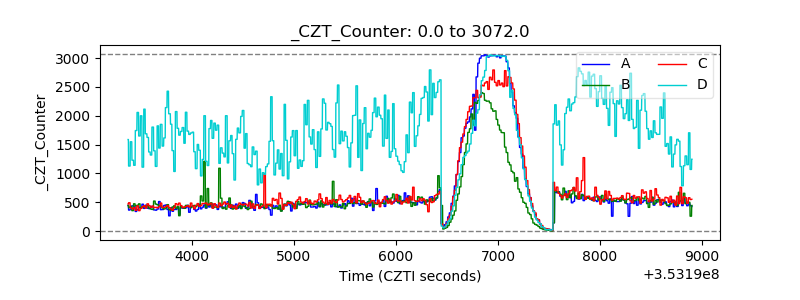 |
| +2.5 Volts monitor |  |
| +5 Volts monitor | 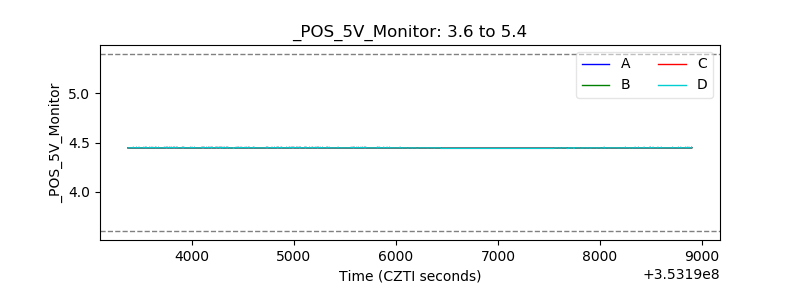 |
| _ROLL_ROT | 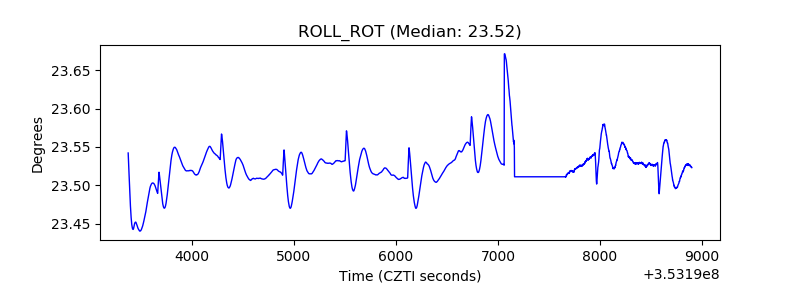 |
| _Roll_DEC | 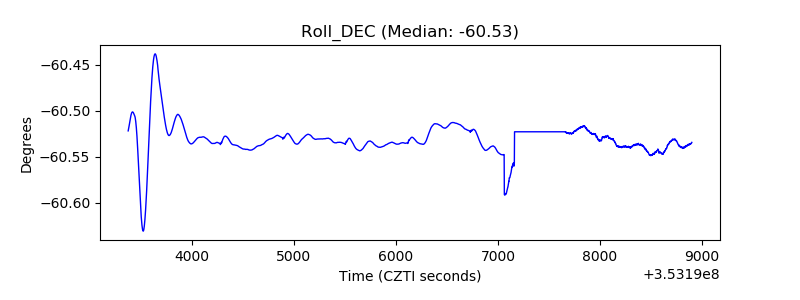 |
| _Roll_RA | 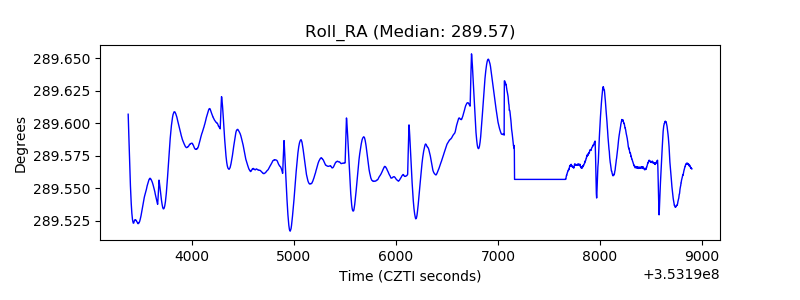 |
| Veto Counter | 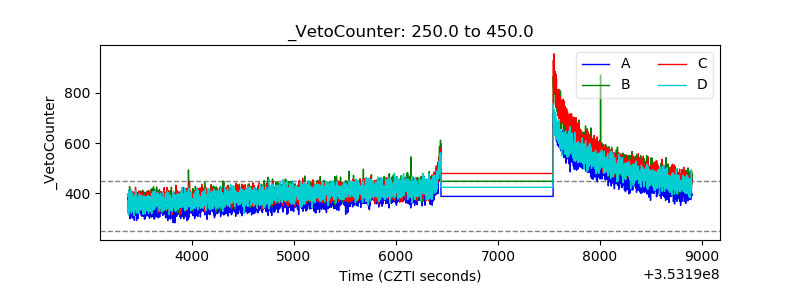 |