| Param | Original file | Final file |
|---|---|---|
| Filename | modeM0/AS1A10_064T03_9000004246_29484cztM0_level2.evt | modeM0/AS1A10_064T03_9000004246_29484cztM0_level2_quad_clean.evt |
| Size (bytes) | 754,401,600 | 119,390,400 |
| Size | 719.5 MB | 113.9 MB |
| Events in quadrant A | 3,133,050 | 854,548 |
| Events in quadrant B | 3,202,745 | 887,347 |
| Events in quadrant C | 3,776,400 | 838,781 |
| Events in quadrant D | 12,323,238 | 608,444 |
| Mode SS | |||
|---|---|---|---|
| Quadrant | BADHDUFLAG | Total packets | Discarded packets |
| A | 0 | 122 | 0 |
| B | 0 | 122 | 0 |
| C | 0 | 122 | 0 |
| D | 0 | 122 | 0 |
| Mode M0 | |||
|---|---|---|---|
| Quadrant | BADHDUFLAG | Total packets | Discarded packets |
| A | 0 | 13080 | 1 |
| B | 0 | 13310 | 1 |
| C | 0 | 15595 | 1 |
| D | 0 | 40818 | 4 |
| Mode M9 | |||
|---|---|---|---|
| Quadrant | BADHDUFLAG | Total packets | Discarded packets |
| A | 0 | 13 | 0 |
| B | 0 | 13 | 0 |
| C | 0 | 13 | 0 |
| D | 0 | 13 | 0 |
| Quadrant | Total seconds | Saturated seconds | Saturation percentage |
|---|---|---|---|
| A | 6104 | 32 | 0.524246% |
| B | 6104 | 47 | 0.769987% |
| C | 6104 | 98 | 1.605505% |
| D | 6104 | 3339 | 54.701835% |
Noise dominated data is calculated using 1-second bins in cleaned event files. If a bin has >2000 counts, and if more than 50% of those come from <1% of pixels, then it is considered to be noise-dominated and hence unusable.
| Quadrant | # 1 sec bins | Bins with >0 counts | Bins with >2000 counts | High rate bins dominated by noise | Noise dominated (total time) | Noise dominated (detector-on time) | Marked lightcurve |
|---|---|---|---|---|---|---|---|
| A | 7389 | 6105 | 0 | 0 | 0.00% | 0.00% |  |
| B | 7389 | 6105 | 4 | 4 | 0.05% | 0.07% |  |
| C | 7389 | 6105 | 1 | 1 | 0.01% | 0.02% |  |
| D | 7389 | 6105 | 3110 | 3110 | 42.09% | 50.94% | 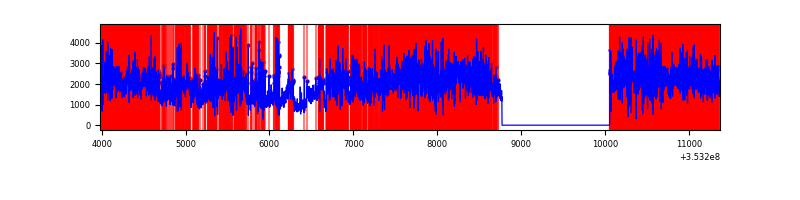 |
Top three noisy pixels from each quadrant. If the there are fewer than three noisy pixels in the level2.evt file, extra rows are filled as -1
| Pixel properties | Quadrant properties | ||||||
|---|---|---|---|---|---|---|---|
| Quadrant | DetID | PixID | Counts | Sigma | Mean | Median | Sigma |
| A | 13 | 254 | 11721 | 69.07 | 807 | 794 | 158.2 |
| A | 11 | 29 | 10034 | 58.41 | 807 | 794 | 158.2 |
| A | 3 | 137 | 7116 | 39.96 | 807 | 794 | 158.2 |
| B | 0 | 190 | 23696 | 154.54 | 809 | 792 | 148.2 |
| B | 12 | 111 | 17113 | 110.12 | 809 | 792 | 148.2 |
| B | 11 | 111 | 15379 | 98.42 | 809 | 792 | 148.2 |
| C | 3 | 233 | 508070 | 2774.18 | 792 | 799 | 182.9 |
| C | 14 | 238 | 130080 | 707.02 | 792 | 799 | 182.9 |
| C | 7 | 247 | 37478 | 200.59 | 792 | 799 | 182.9 |
| D | 8 | 195 | 5985430 | 40676.74 | 634 | 619 | 147.1 |
| D | 1 | 52 | 2453773 | 16673.26 | 634 | 619 | 147.1 |
| D | 12 | 33 | 1131548 | 7686.54 | 634 | 619 | 147.1 |
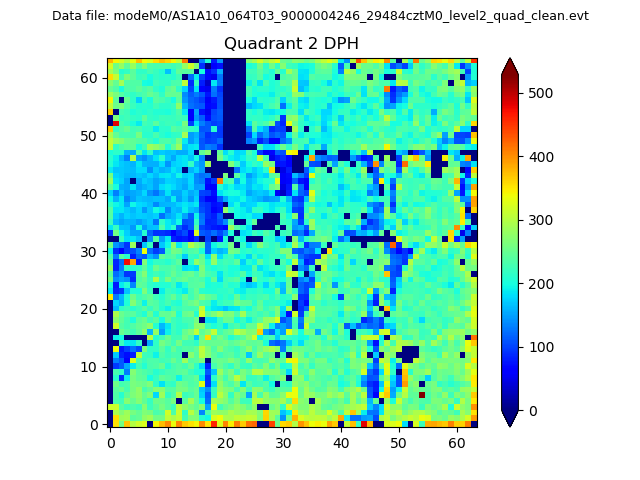
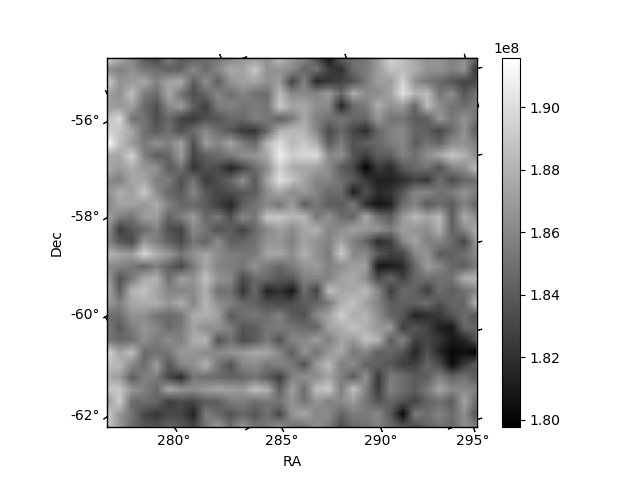
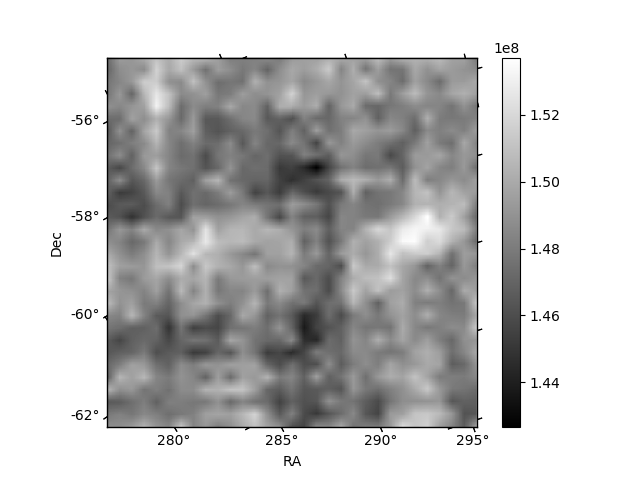
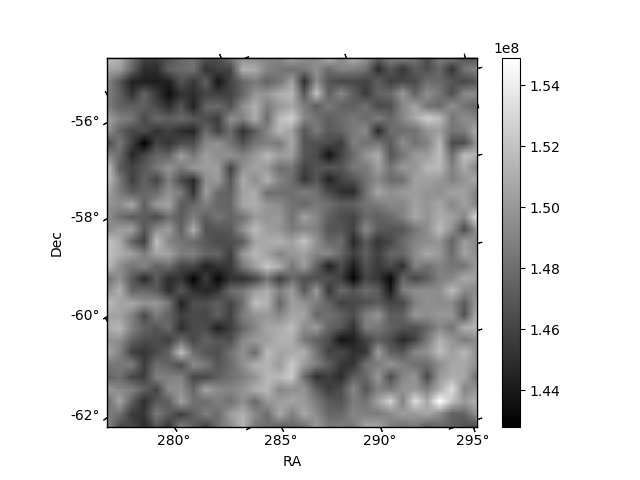
Histogram calculated using DETX and DETY for each event in the final _common_clean file
| Quadrant A | 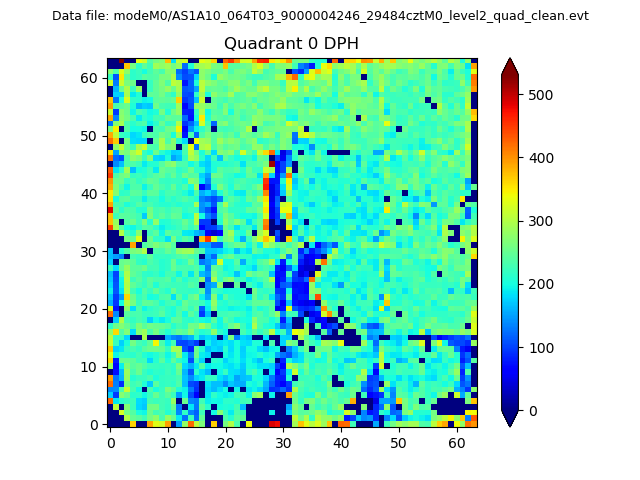 |
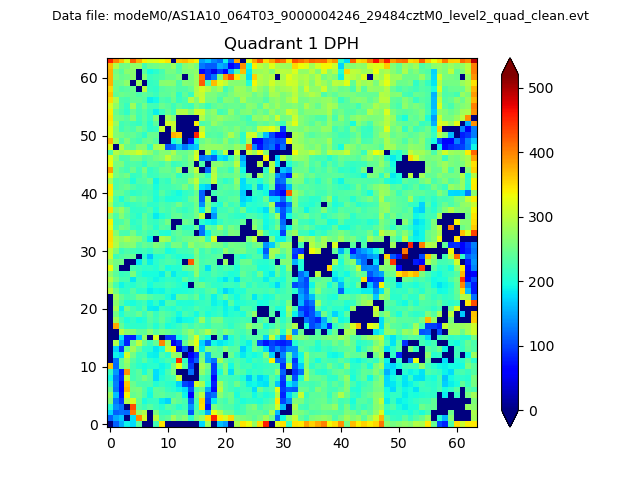 |
Quadrant B |
|---|---|---|---|
| Quadrant D | 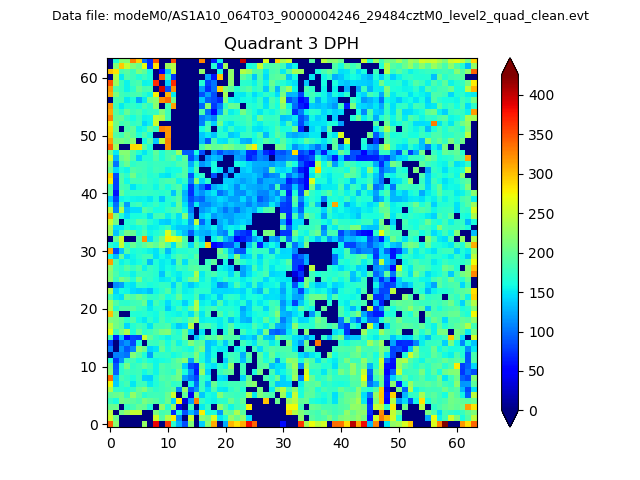 |
 |
Quadrant C |
| Plot type | Count rate plots | Images |
|---|---|---|
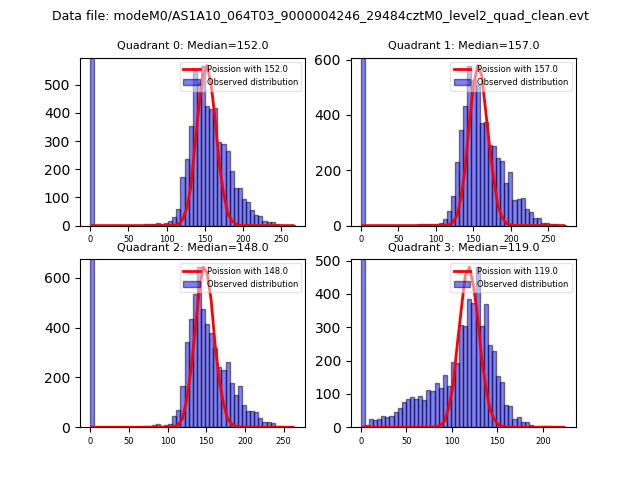
| Comparison with Poisson distribution Blue bars denote a histogram of data divided into 1 sec bins. Red curve is a Poisson curve with rate = median count rate of data. |
 |
 |
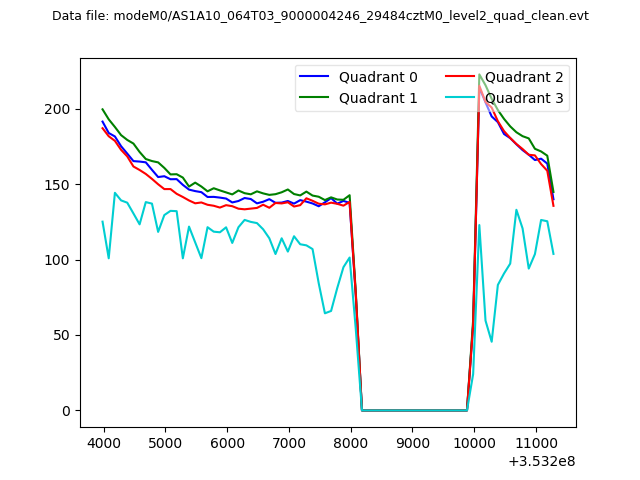
| Quadrant-wise count rates Data is divided into 100 sec bins |
 |
|
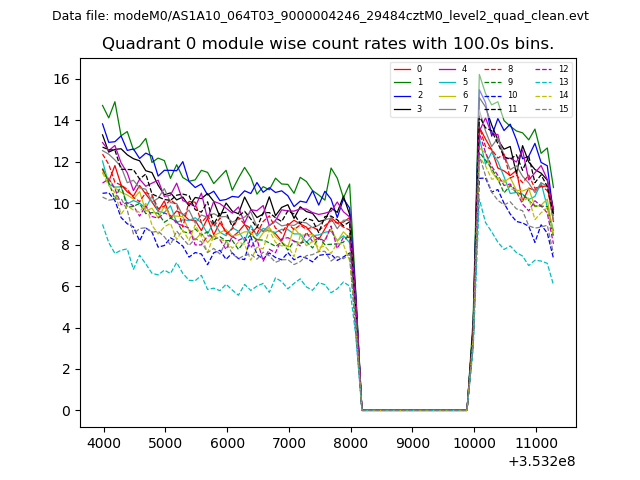
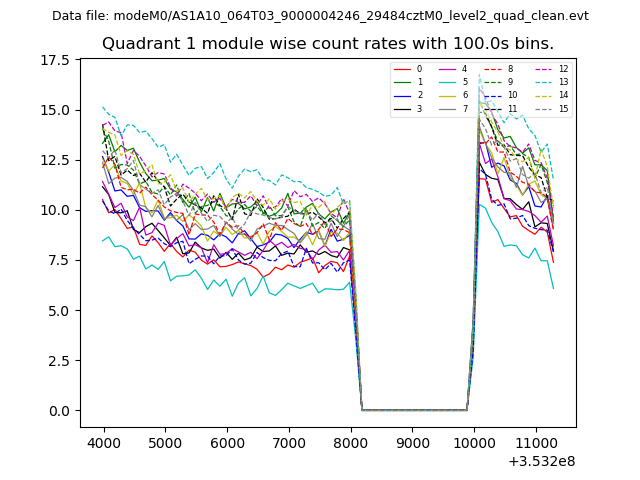
| Module-wise count rates for Quadrant A Data is divided into 100 sec bins |
 |
 |
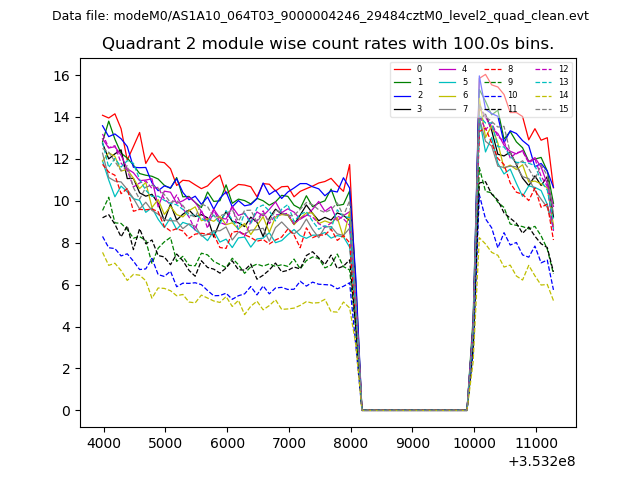
| Module-wise count rates for Quadrant B Data is divided into 100 sec bins |
 |
 |
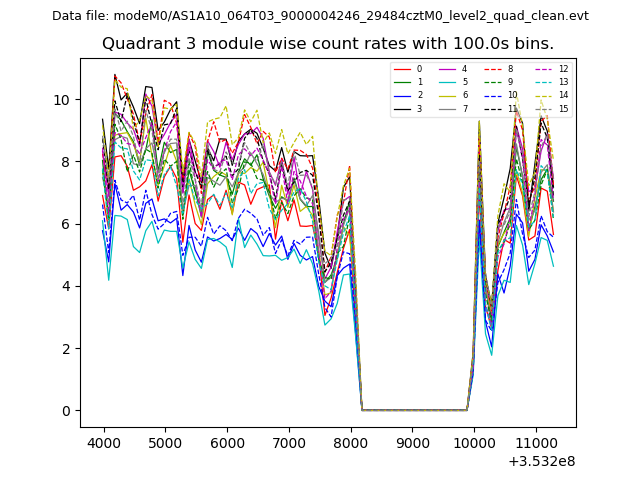
| Module-wise count rates for Quadrant C Data is divided into 100 sec bins |
 |
 |
| Module-wise count rates for Quadrant D Data is divided into 100 sec bins |
 |
 |
| Parameter | Plot |
|---|---|
| CZT HV Monitor | 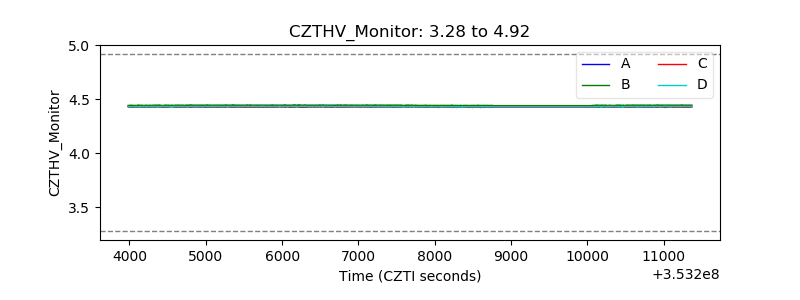 |
| D_VDD |  |
| Temperature 1 | 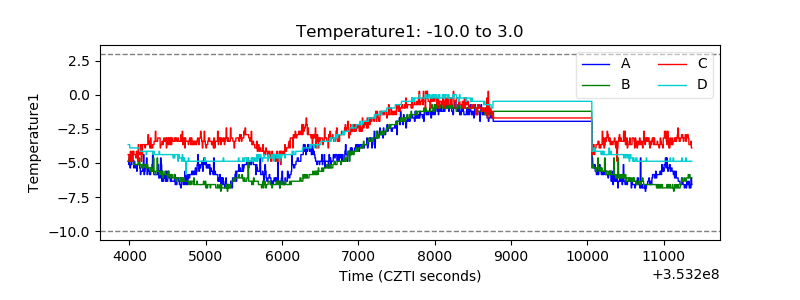 |
| Veto HV Monitor | 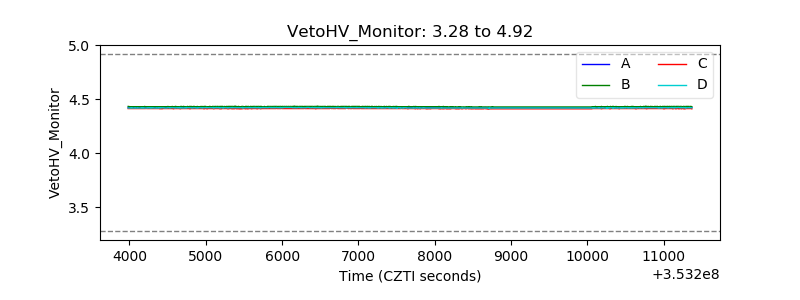 |
| Veto LLD | 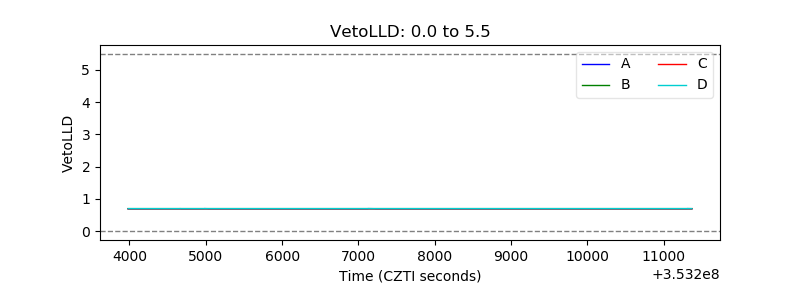 |
| Alpha Counter | 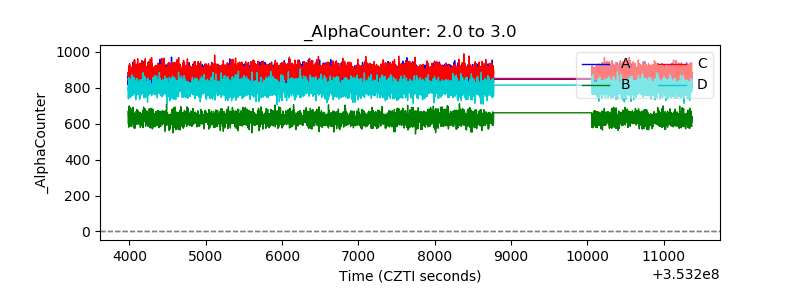 |
| _CPM_Rate | 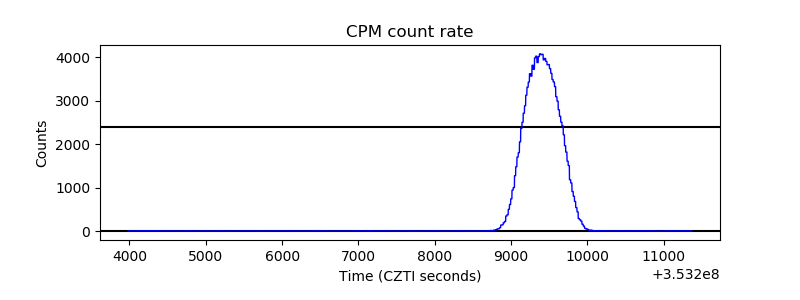 |
| CZT Counter | 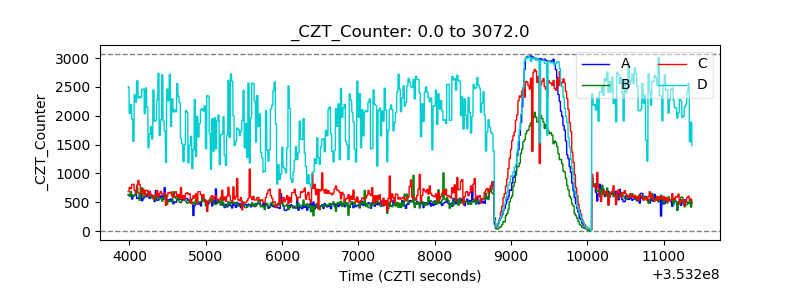 |
| +2.5 Volts monitor |  |
| +5 Volts monitor |  |
| _ROLL_ROT | 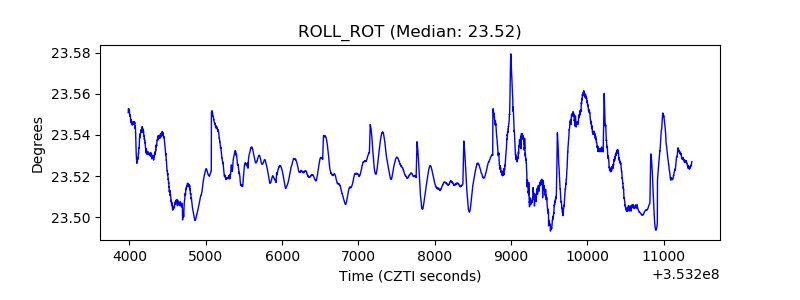 |
| _Roll_DEC | 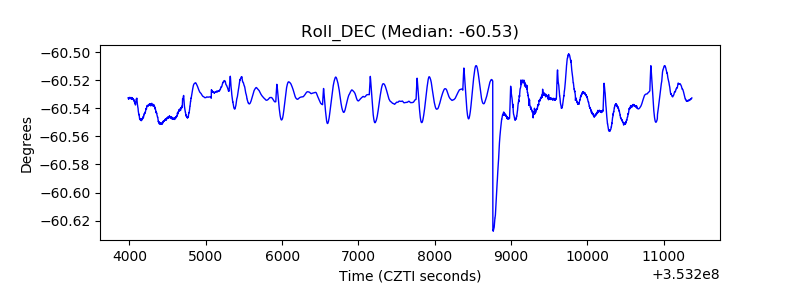 |
| _Roll_RA |  |
| Veto Counter | 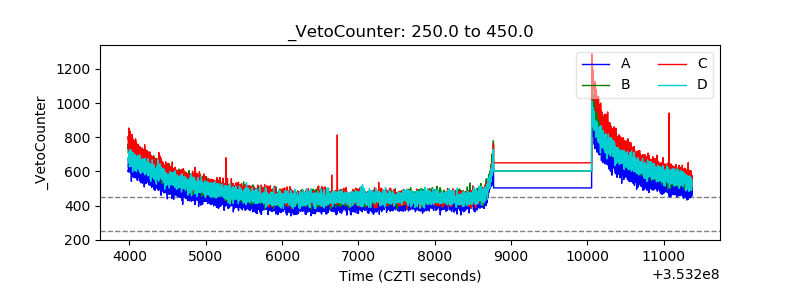 |