| Param | Original file | Final file |
|---|---|---|
| Filename | modeM0/AS1A10_064T03_9000004246_29485cztM0_level2.evt | modeM0/AS1A10_064T03_9000004246_29485cztM0_level2_quad_clean.evt |
| Size (bytes) | 746,974,080 | 104,728,320 |
| Size | 712.4 MB | 99.9 MB |
| Events in quadrant A | 2,912,794 | 751,125 |
| Events in quadrant B | 3,015,511 | 779,649 |
| Events in quadrant C | 3,283,521 | 749,201 |
| Events in quadrant D | 13,026,453 | 493,313 |
| Mode SS | |||
|---|---|---|---|
| Quadrant | BADHDUFLAG | Total packets | Discarded packets |
| A | 0 | 116 | 0 |
| B | 0 | 116 | 0 |
| C | 0 | 116 | 0 |
| D | 0 | 116 | 0 |
| Mode M0 | |||
|---|---|---|---|
| Quadrant | BADHDUFLAG | Total packets | Discarded packets |
| A | 0 | 11962 | 1 |
| B | 0 | 12327 | 1 |
| C | 0 | 13291 | 1 |
| D | 0 | 42579 | 1 |
| Mode M9 | |||
|---|---|---|---|
| Quadrant | BADHDUFLAG | Total packets | Discarded packets |
| A | 0 | 14 | 0 |
| B | 0 | 14 | 0 |
| C | 0 | 14 | 0 |
| D | 0 | 14 | 0 |
| Quadrant | Total seconds | Saturated seconds | Saturation percentage |
|---|---|---|---|
| A | 5676 | 13 | 0.229035% |
| B | 5676 | 33 | 0.581395% |
| C | 5676 | 55 | 0.968992% |
| D | 5677 | 4248 | 74.828254% |
Noise dominated data is calculated using 1-second bins in cleaned event files. If a bin has >2000 counts, and if more than 50% of those come from <1% of pixels, then it is considered to be noise-dominated and hence unusable.
| Quadrant | # 1 sec bins | Bins with >0 counts | Bins with >2000 counts | High rate bins dominated by noise | Noise dominated (total time) | Noise dominated (detector-on time) | Marked lightcurve |
|---|---|---|---|---|---|---|---|
| A | 7067 | 5677 | 0 | 0 | 0.00% | 0.00% | 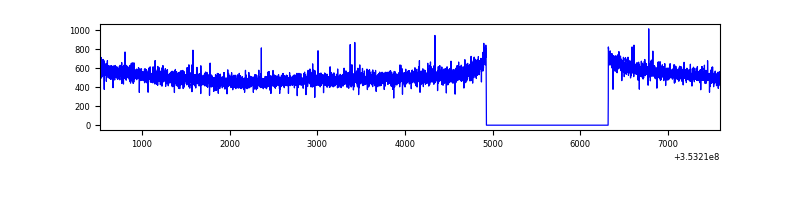 |
| B | 7067 | 5677 | 1 | 1 | 0.01% | 0.02% | 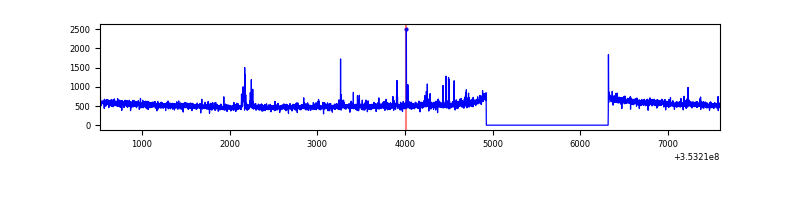 |
| C | 7067 | 5677 | 1 | 1 | 0.01% | 0.02% | 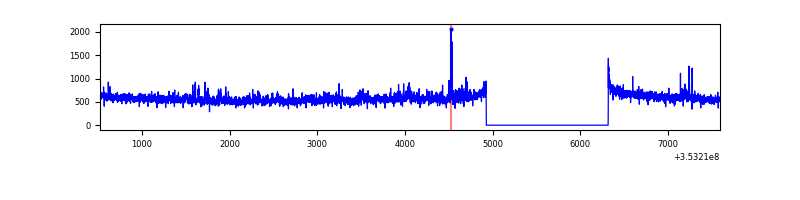 |
| D | 7068 | 5678 | 4136 | 4136 | 58.52% | 72.84% | 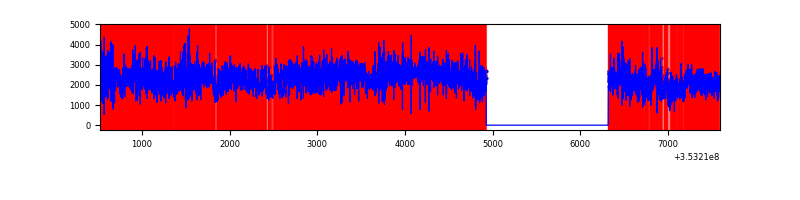 |
Top three noisy pixels from each quadrant. If the there are fewer than three noisy pixels in the level2.evt file, extra rows are filled as -1
| Pixel properties | Quadrant properties | ||||||
|---|---|---|---|---|---|---|---|
| Quadrant | DetID | PixID | Counts | Sigma | Mean | Median | Sigma |
| A | 13 | 254 | 11039 | 68.76 | 750 | 739 | 149.8 |
| A | 1 | 113 | 10477 | 65.01 | 750 | 739 | 149.8 |
| A | 3 | 137 | 6455 | 38.16 | 750 | 739 | 149.8 |
| B | 0 | 230 | 26441 | 187.26 | 754 | 738 | 137.3 |
| B | 12 | 111 | 15573 | 108.08 | 754 | 738 | 137.3 |
| B | 0 | 155 | 15469 | 107.32 | 754 | 738 | 137.3 |
| C | 3 | 233 | 201940 | 1174.68 | 745 | 752 | 171.3 |
| C | 14 | 238 | 120758 | 700.68 | 745 | 752 | 171.3 |
| C | 7 | 247 | 45079 | 258.81 | 745 | 752 | 171.3 |
| D | 8 | 195 | 9080314 | 72321.36 | 538 | 526 | 125.5 |
| D | 1 | 52 | 946851 | 7537.56 | 538 | 526 | 125.5 |
| D | 12 | 33 | 500467 | 3982.07 | 538 | 526 | 125.5 |
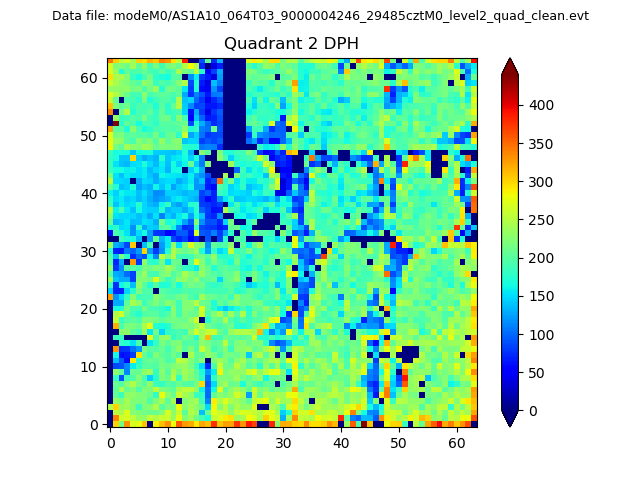
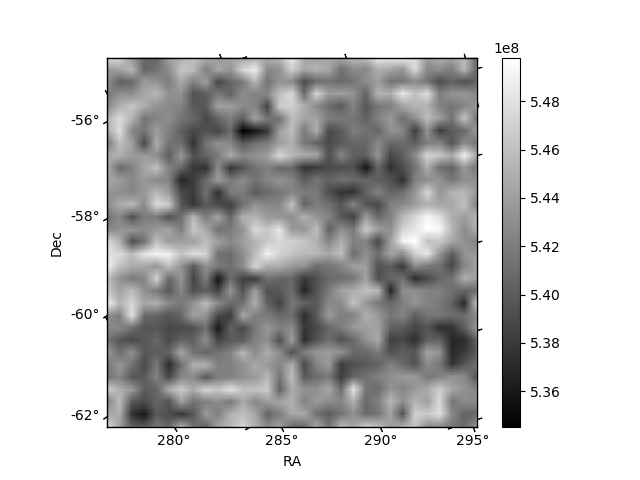
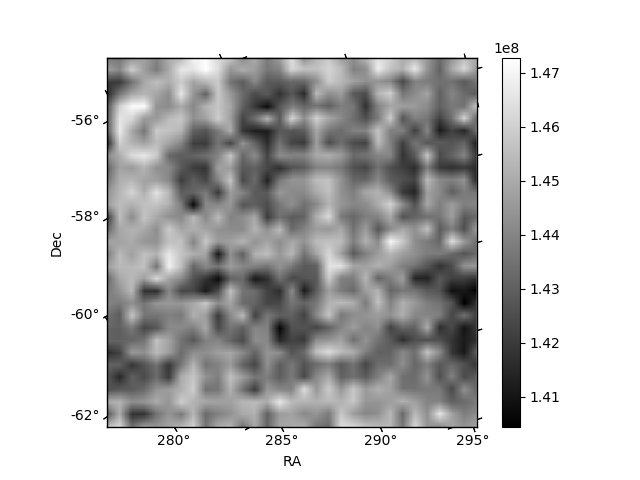
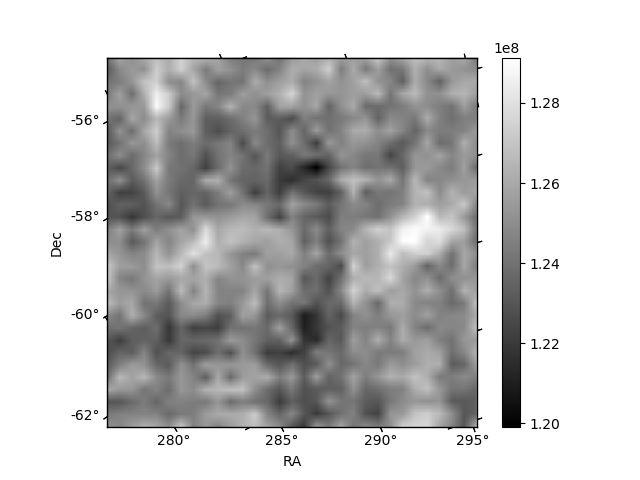
Histogram calculated using DETX and DETY for each event in the final _common_clean file
| Quadrant A | 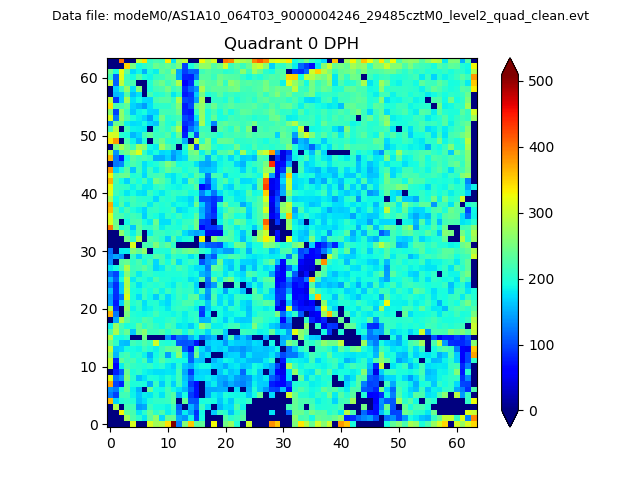 |
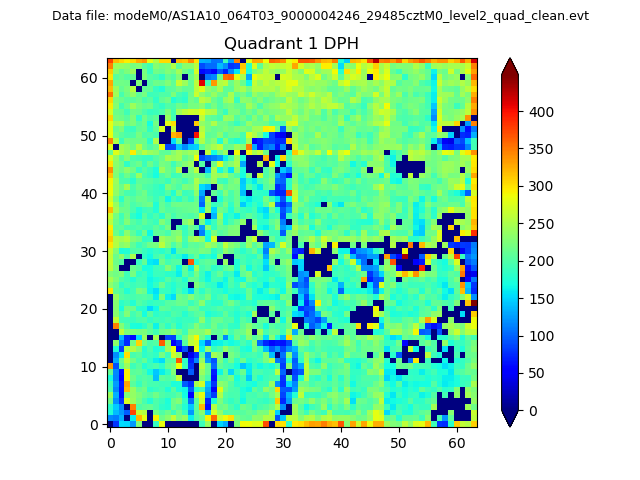 |
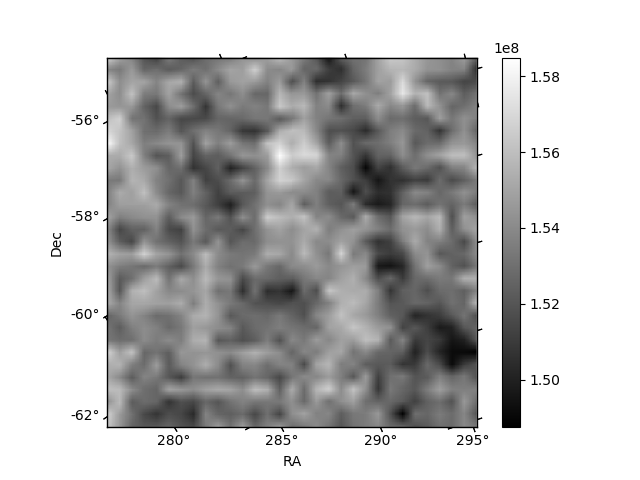
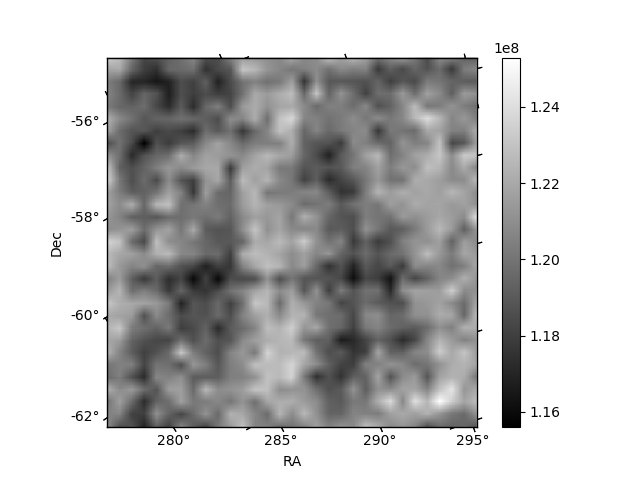
Quadrant B |
|---|---|---|---|
| Quadrant D | 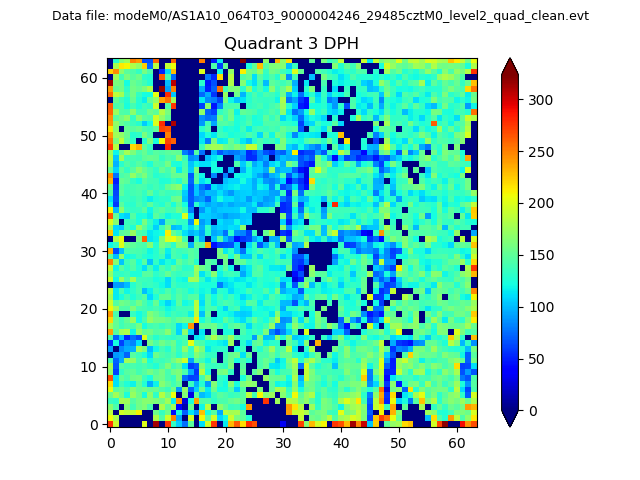 |
 |
Quadrant C |
| Plot type | Count rate plots | Images |
|---|---|---|
| Comparison with Poisson distribution Blue bars denote a histogram of data divided into 1 sec bins. Red curve is a Poisson curve with rate = median count rate of data. |
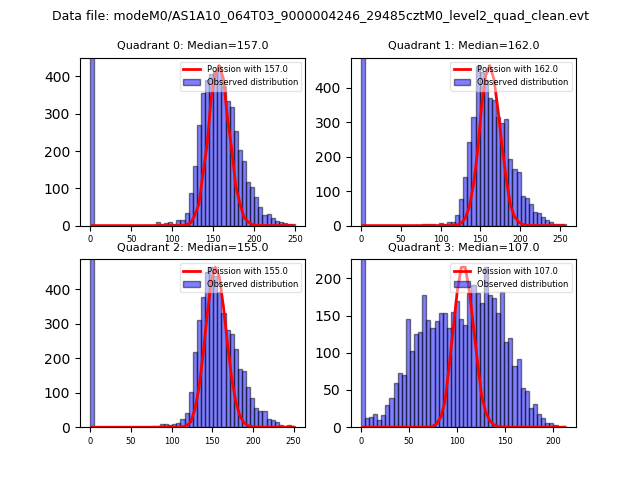 |
 |
| Quadrant-wise count rates Data is divided into 100 sec bins |
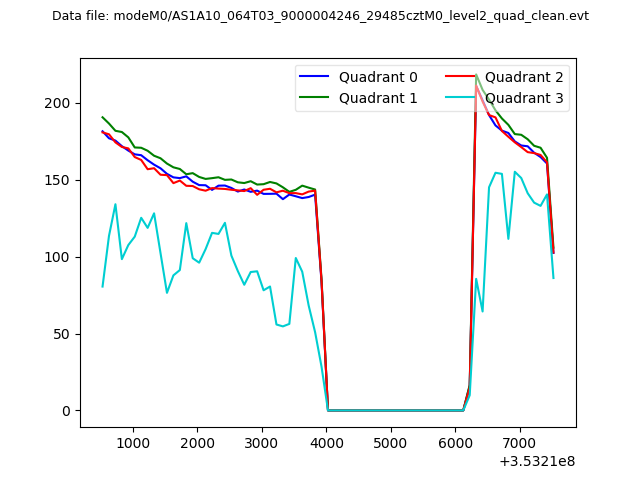 |
|
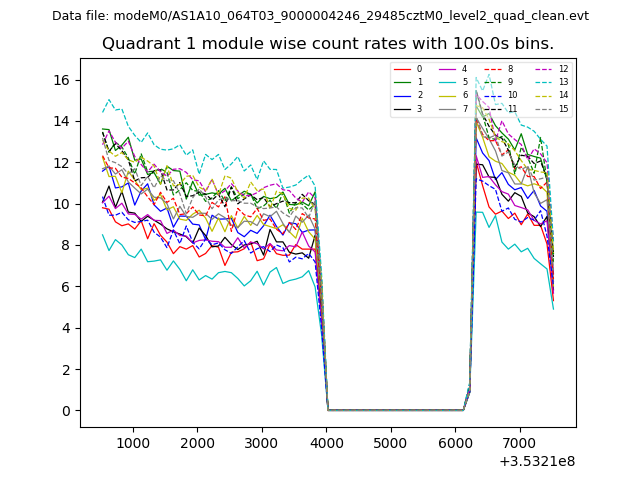
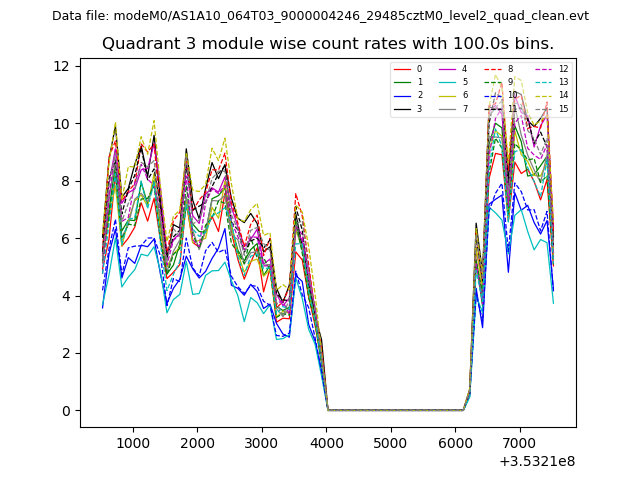
| Module-wise count rates for Quadrant A Data is divided into 100 sec bins |
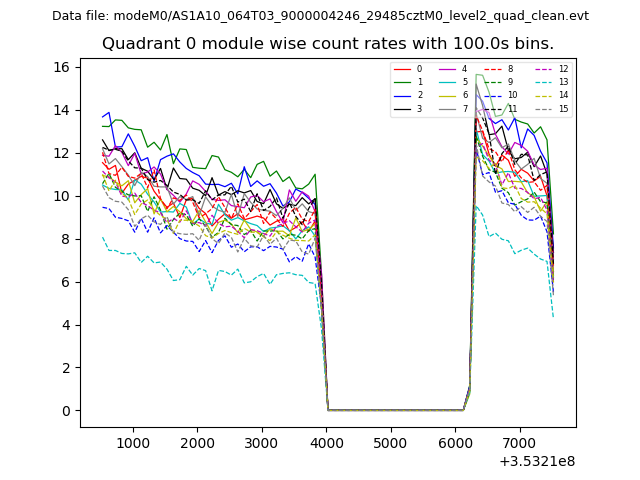 |
 |
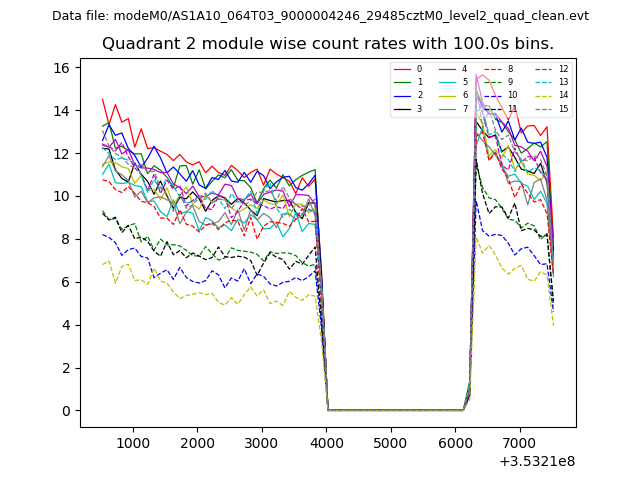
| Module-wise count rates for Quadrant B Data is divided into 100 sec bins |
 |
 |
| Module-wise count rates for Quadrant C Data is divided into 100 sec bins |
 |
 |
| Module-wise count rates for Quadrant D Data is divided into 100 sec bins |
 |
 |
| Parameter | Plot |
|---|---|
| CZT HV Monitor | 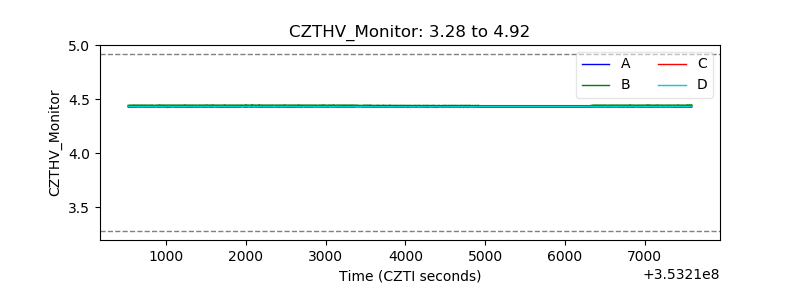 |
| D_VDD | 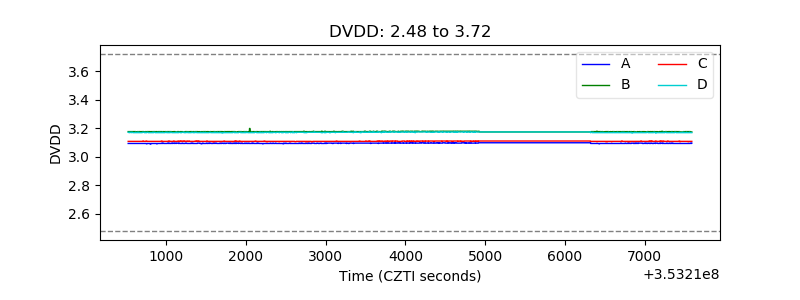 |
| Temperature 1 |  |
| Veto HV Monitor | 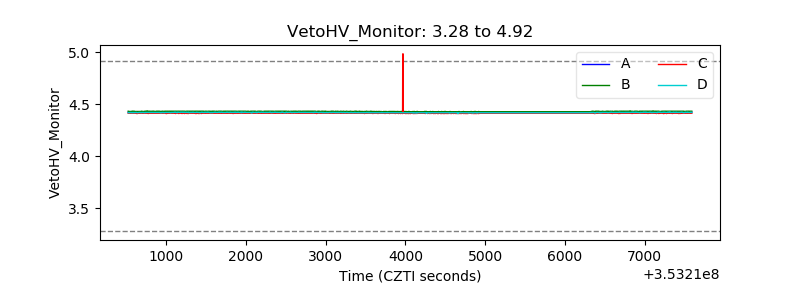 |
| Veto LLD | 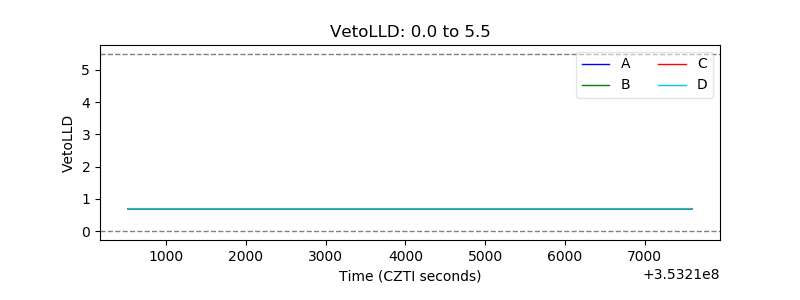 |
| Alpha Counter | 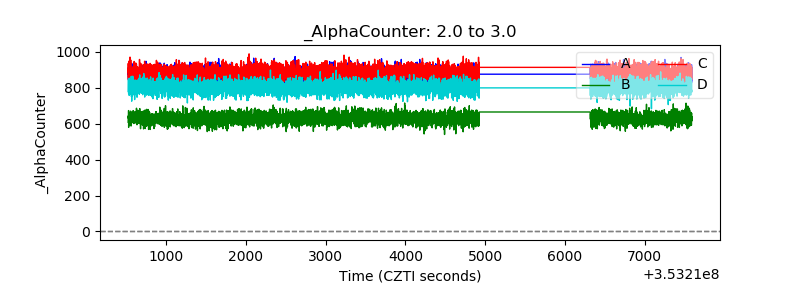 |
| _CPM_Rate |  |
| CZT Counter | 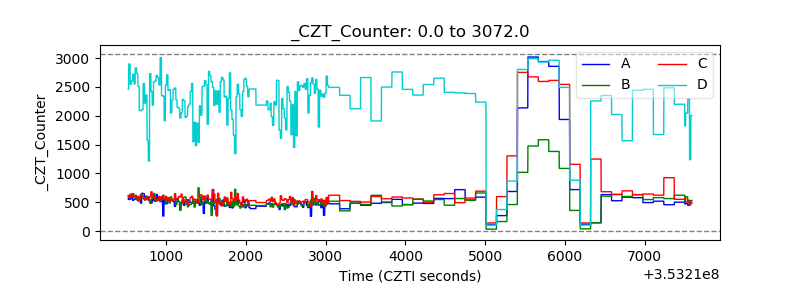 |
| +2.5 Volts monitor |  |
| +5 Volts monitor | 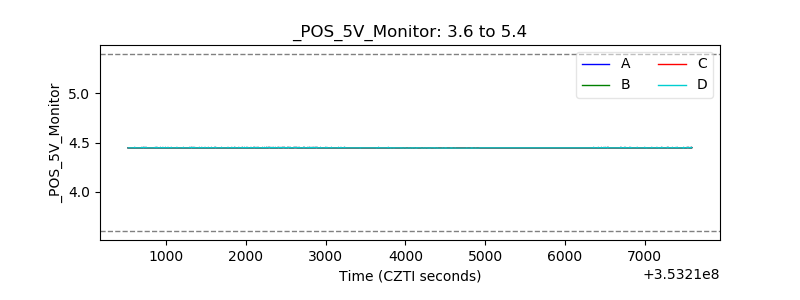 |
| _ROLL_ROT | 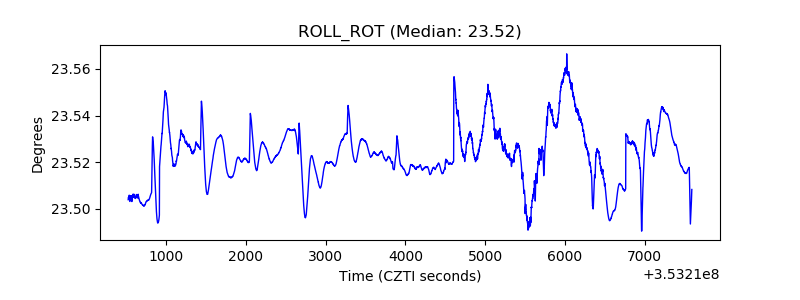 |
| _Roll_DEC | 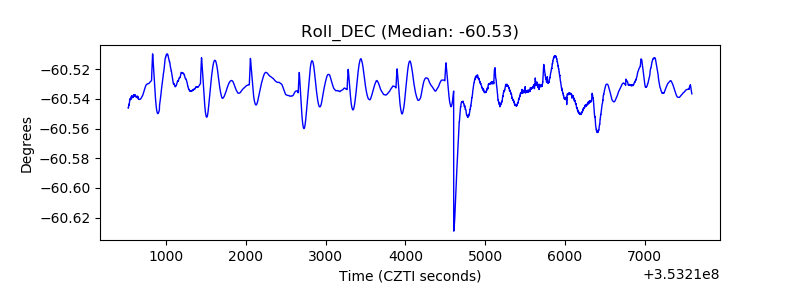 |
| _Roll_RA | 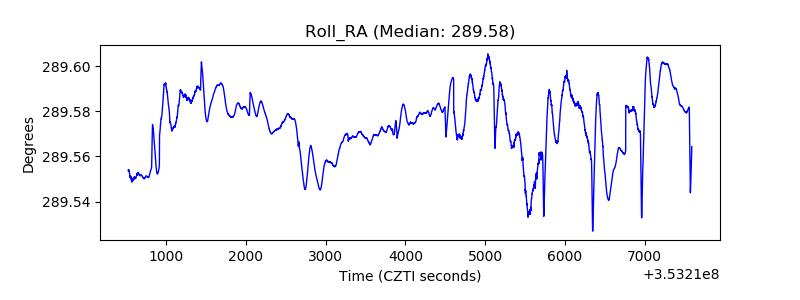 |
| Veto Counter | 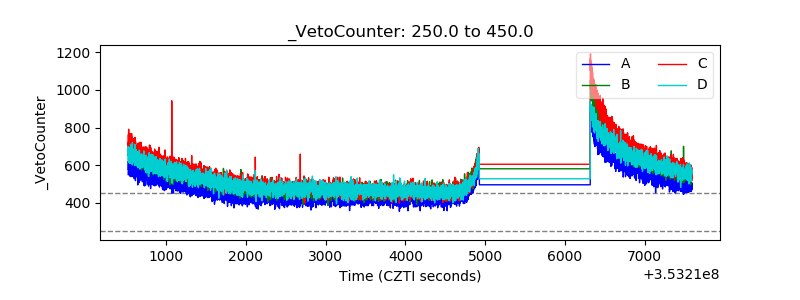 |