| Param | Original file | Final file |
|---|---|---|
| Filename | modeM0/AS1A10_064T03_9000004246_29486cztM0_level2.evt | modeM0/AS1A10_064T03_9000004246_29486cztM0_level2_quad_clean.evt |
| Size (bytes) | 714,493,440 | 98,487,360 |
| Size | 681.4 MB | 93.9 MB |
| Events in quadrant A | 2,887,592 | 692,370 |
| Events in quadrant B | 2,956,707 | 713,165 |
| Events in quadrant C | 3,546,533 | 684,280 |
| Events in quadrant D | 11,867,719 | 498,704 |
| Mode SS | |||
|---|---|---|---|
| Quadrant | BADHDUFLAG | Total packets | Discarded packets |
| A | 0 | 114 | 0 |
| B | 0 | 114 | 0 |
| C | 0 | 114 | 0 |
| D | 0 | 114 | 0 |
| Mode M0 | |||
|---|---|---|---|
| Quadrant | BADHDUFLAG | Total packets | Discarded packets |
| A | 0 | 11805 | 1 |
| B | 0 | 12061 | 1 |
| C | 0 | 14331 | 1 |
| D | 0 | 39105 | 1 |
| Mode M9 | |||
|---|---|---|---|
| Quadrant | BADHDUFLAG | Total packets | Discarded packets |
| A | 0 | 14 | 0 |
| B | 0 | 14 | 0 |
| C | 0 | 14 | 0 |
| D | 0 | 14 | 0 |
| Quadrant | Total seconds | Saturated seconds | Saturation percentage |
|---|---|---|---|
| A | 5619 | 23 | 0.409326% |
| B | 5619 | 44 | 0.783057% |
| C | 5619 | 193 | 3.434775% |
| D | 5620 | 3633 | 64.644128% |
Noise dominated data is calculated using 1-second bins in cleaned event files. If a bin has >2000 counts, and if more than 50% of those come from <1% of pixels, then it is considered to be noise-dominated and hence unusable.
| Quadrant | # 1 sec bins | Bins with >0 counts | Bins with >2000 counts | High rate bins dominated by noise | Noise dominated (total time) | Noise dominated (detector-on time) | Marked lightcurve |
|---|---|---|---|---|---|---|---|
| A | 6984 | 5620 | 7 | 7 | 0.10% | 0.12% | 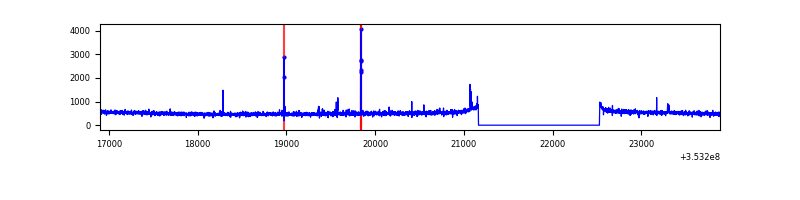 |
| B | 6984 | 5620 | 5 | 5 | 0.07% | 0.09% | 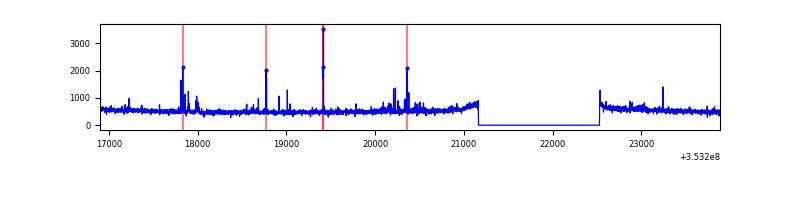 |
| C | 6984 | 5620 | 1 | 1 | 0.01% | 0.02% | 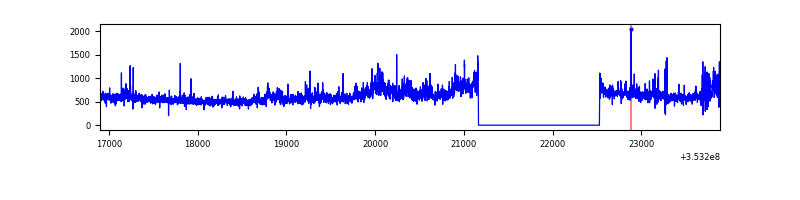 |
| D | 6985 | 5621 | 3413 | 3413 | 48.86% | 60.72% | 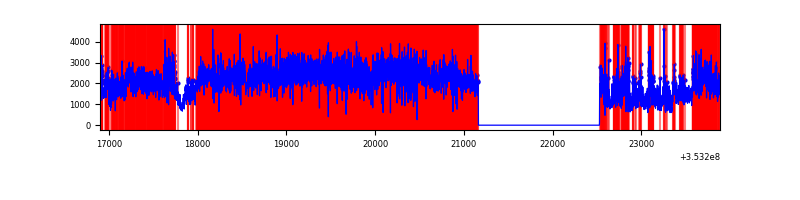 |
Top three noisy pixels from each quadrant. If the there are fewer than three noisy pixels in the level2.evt file, extra rows are filled as -1
| Pixel properties | Quadrant properties | ||||||
|---|---|---|---|---|---|---|---|
| Quadrant | DetID | PixID | Counts | Sigma | Mean | Median | Sigma |
| A | 12 | 96 | 44100 | 296.41 | 734 | 720 | 146.4 |
| A | 13 | 254 | 10471 | 66.63 | 734 | 720 | 146.4 |
| A | 15 | 174 | 6618 | 40.3 | 734 | 720 | 146.4 |
| B | 0 | 230 | 31799 | 230.02 | 733 | 716 | 135.1 |
| B | 0 | 155 | 16602 | 117.56 | 733 | 716 | 135.1 |
| B | 0 | 190 | 15755 | 111.29 | 733 | 716 | 135.1 |
| C | 3 | 233 | 482283 | 2892.27 | 723 | 730 | 166.5 |
| C | 14 | 238 | 141299 | 844.28 | 723 | 730 | 166.5 |
| C | 7 | 247 | 53893 | 319.3 | 723 | 730 | 166.5 |
| D | 8 | 195 | 7608157 | 57230.13 | 566 | 551 | 132.9 |
| D | 1 | 52 | 1631976 | 12272.81 | 566 | 551 | 132.9 |
| D | 12 | 33 | 226511 | 1699.84 | 566 | 551 | 132.9 |
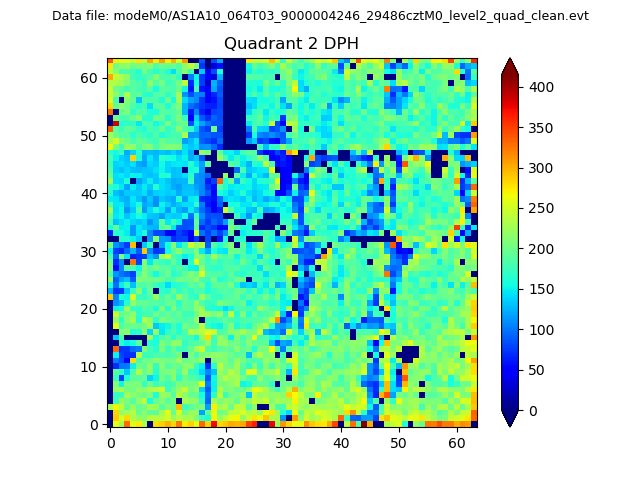
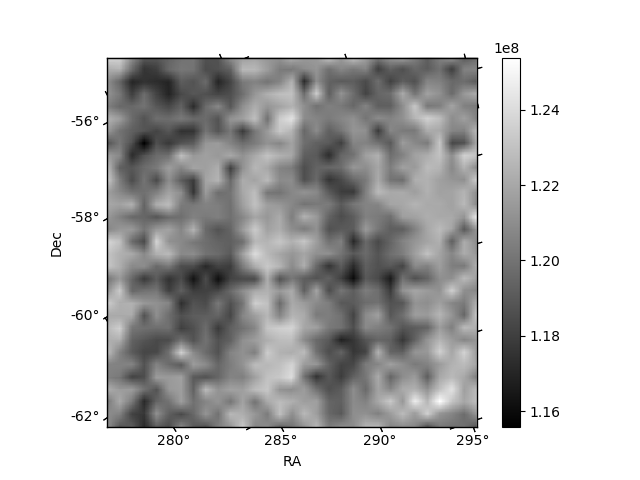
Histogram calculated using DETX and DETY for each event in the final _common_clean file
| Quadrant A | 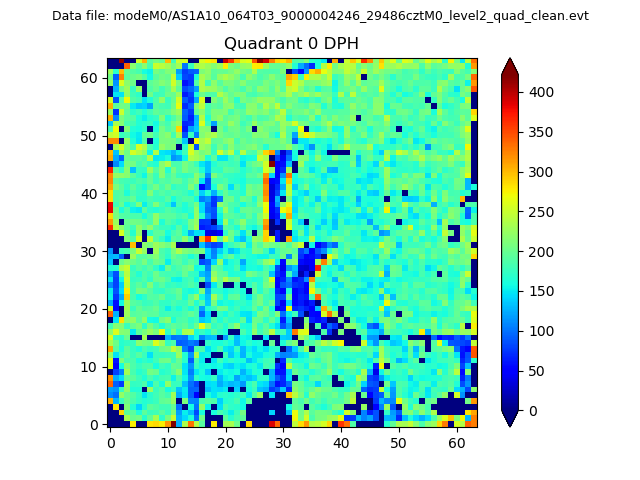 |
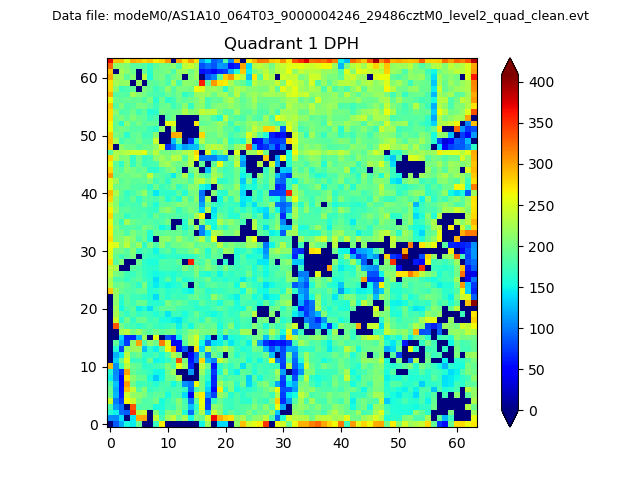 |
Quadrant B |
|---|---|---|---|
| Quadrant D | 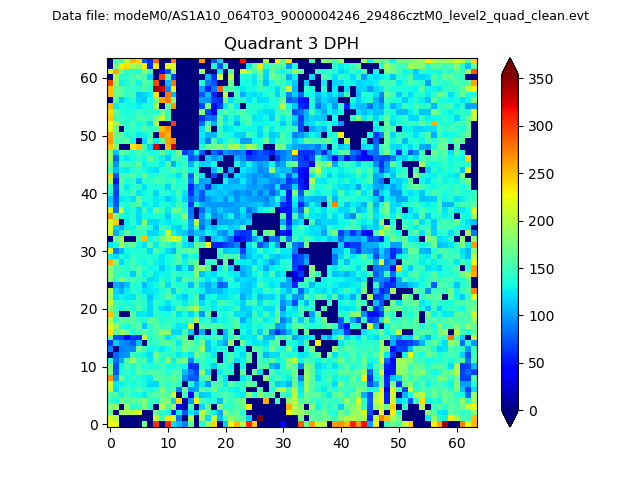 |
 |
Quadrant C |
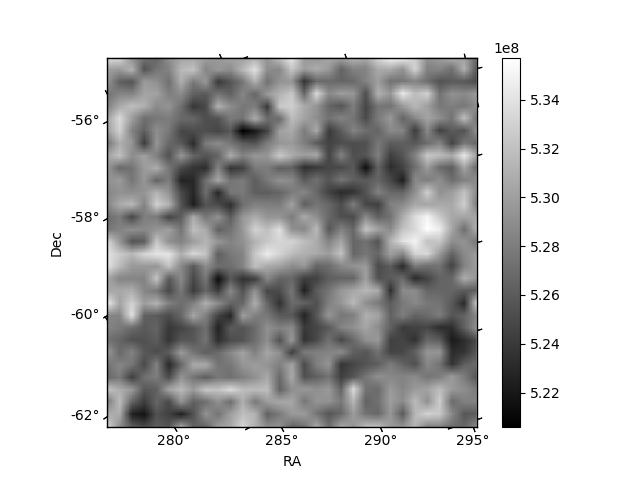
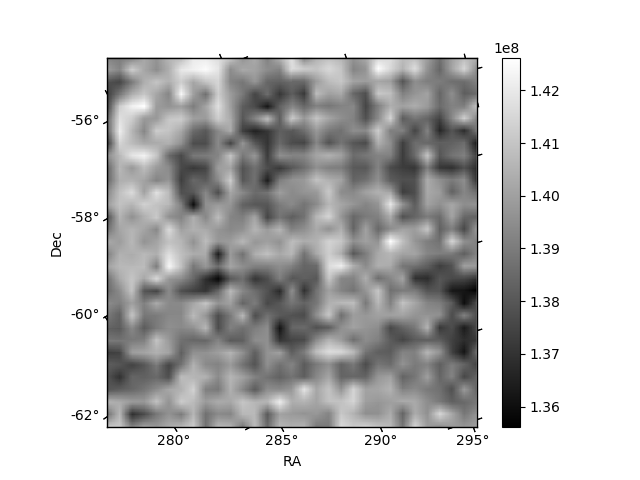
| Plot type | Count rate plots | Images |
|---|---|---|
| Comparison with Poisson distribution Blue bars denote a histogram of data divided into 1 sec bins. Red curve is a Poisson curve with rate = median count rate of data. |
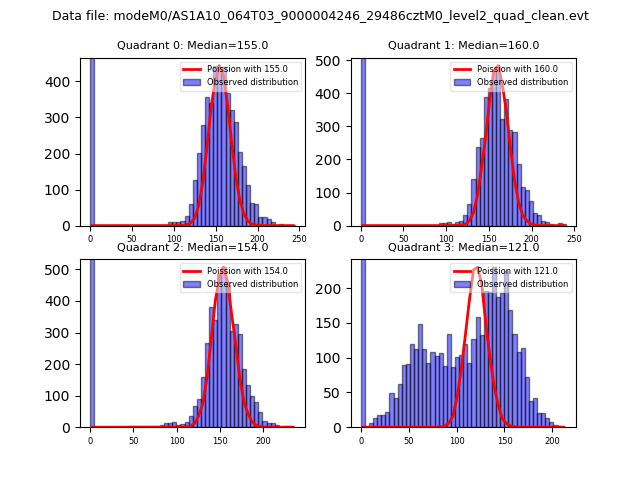 |
 |
| Quadrant-wise count rates Data is divided into 100 sec bins |
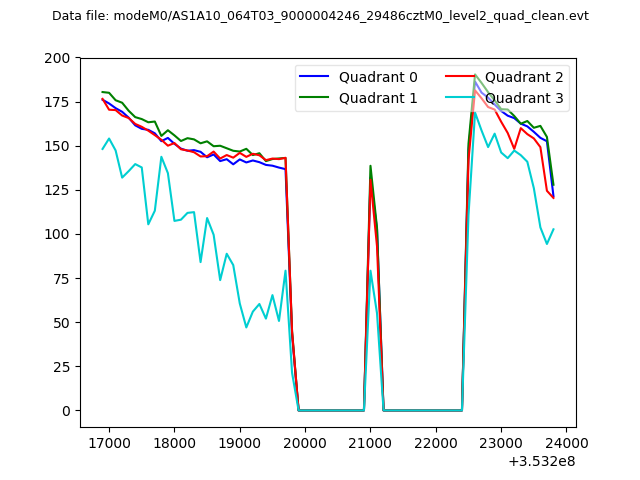 |
|
| Module-wise count rates for Quadrant A Data is divided into 100 sec bins |
 |
 |
| Module-wise count rates for Quadrant B Data is divided into 100 sec bins |
 |
 |
| Module-wise count rates for Quadrant C Data is divided into 100 sec bins |
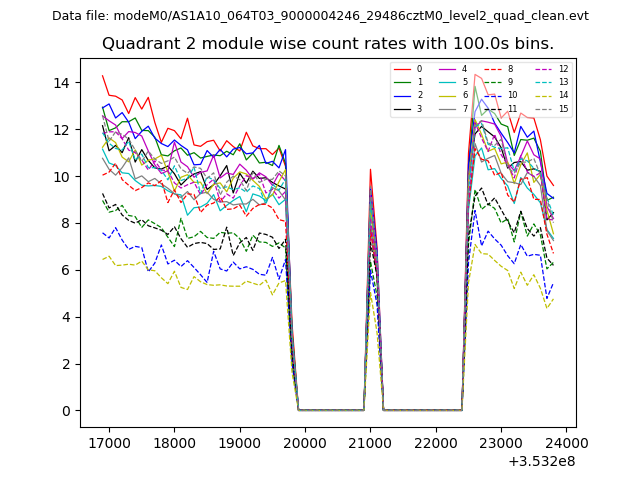 |
 |
| Module-wise count rates for Quadrant D Data is divided into 100 sec bins |
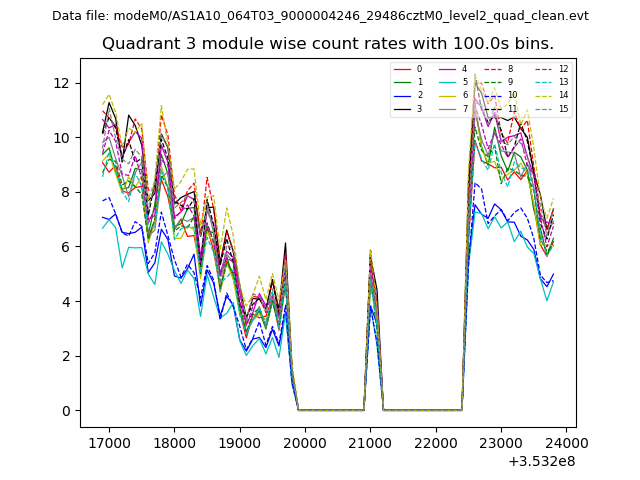 |
 |
| Parameter | Plot |
|---|---|
| CZT HV Monitor | 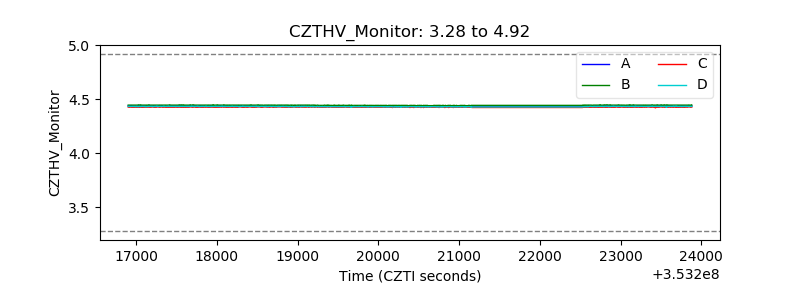 |
| D_VDD | 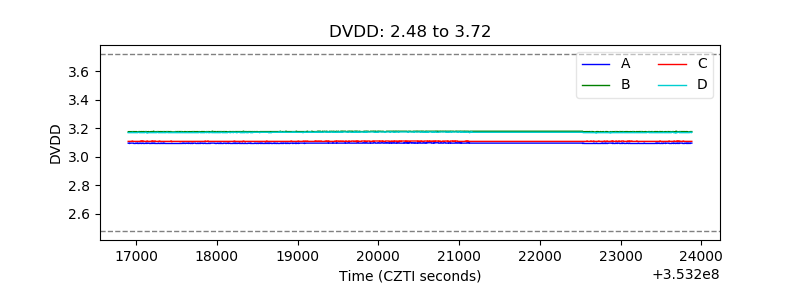 |
| Temperature 1 | 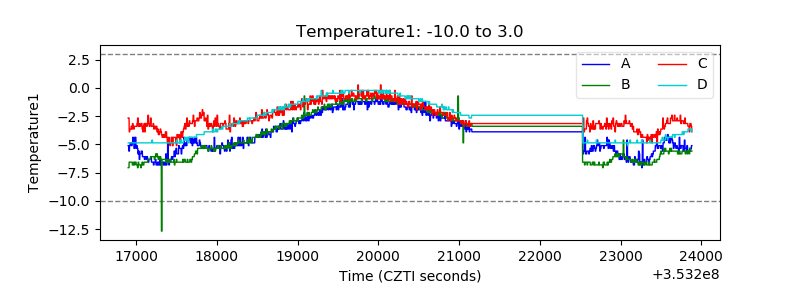 |
| Veto HV Monitor | 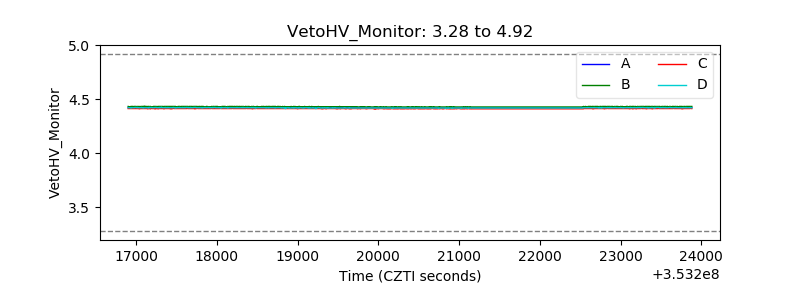 |
| Veto LLD | 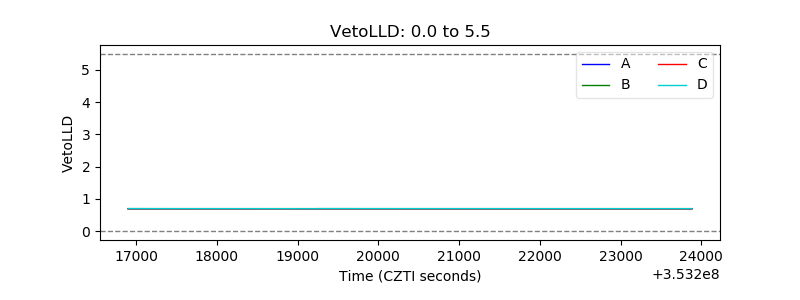 |
| Alpha Counter | 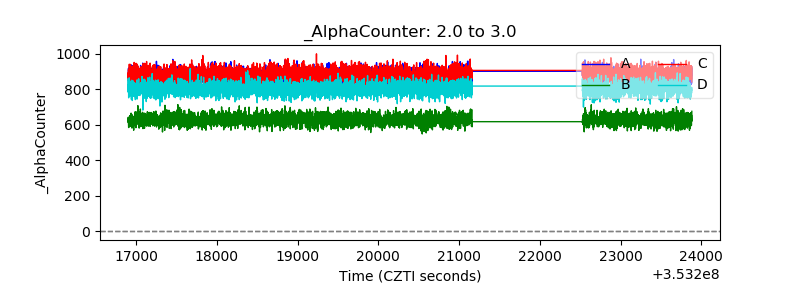 |
| _CPM_Rate | 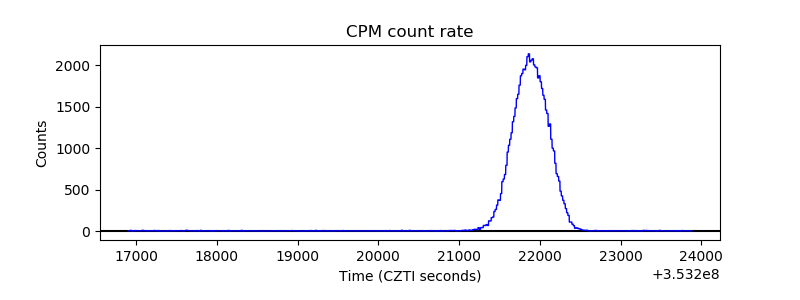 |
| CZT Counter | 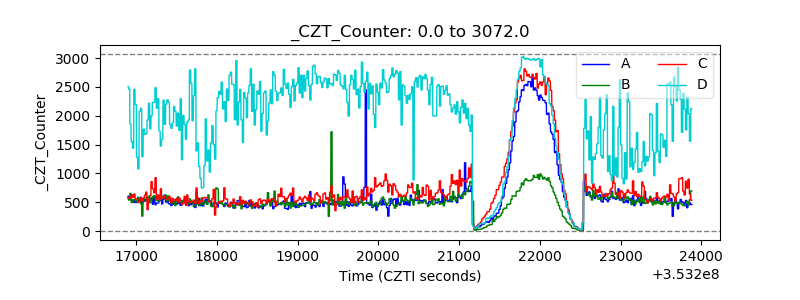 |
| +2.5 Volts monitor |  |
| +5 Volts monitor |  |
| _ROLL_ROT | 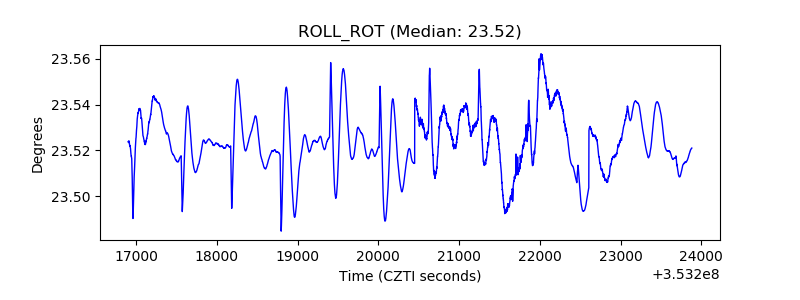 |
| _Roll_DEC | 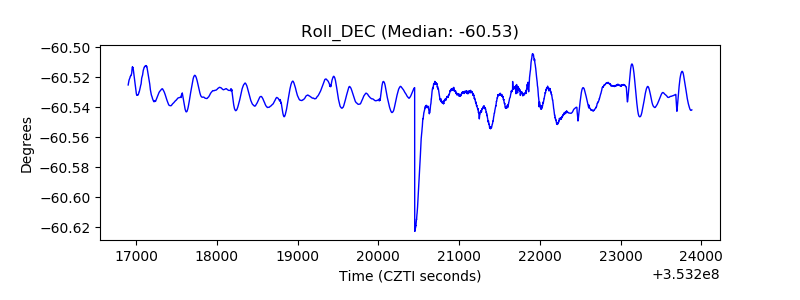 |
| _Roll_RA | 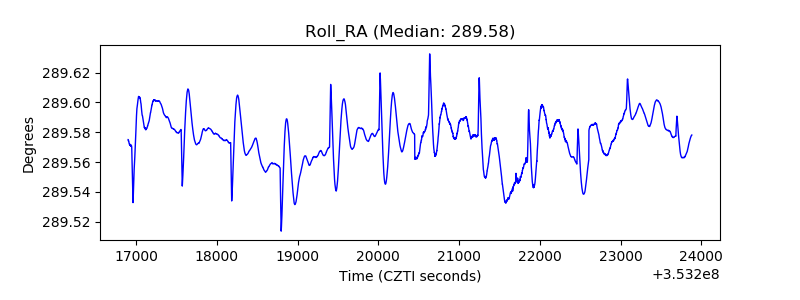 |
| Veto Counter | 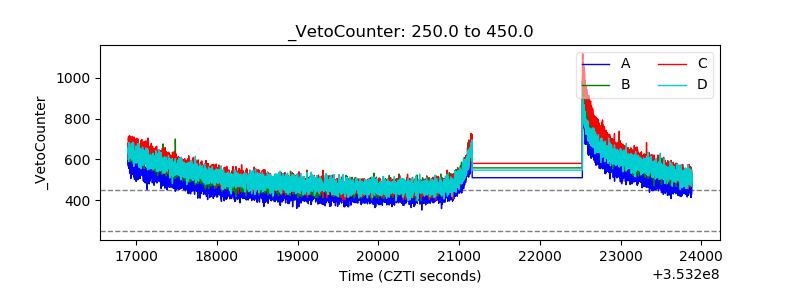 |