| Param | Original file | Final file |
|---|---|---|
| Filename | modeM0/AS1A10_064T03_9000004246_29487cztM0_level2.evt | modeM0/AS1A10_064T03_9000004246_29487cztM0_level2_quad_clean.evt |
| Size (bytes) | 746,948,160 | 95,325,120 |
| Size | 712.3 MB | 90.9 MB |
| Events in quadrant A | 2,878,539 | 675,659 |
| Events in quadrant B | 2,950,419 | 688,654 |
| Events in quadrant C | 4,644,395 | 653,842 |
| Events in quadrant D | 11,758,922 | 464,795 |
| Mode SS | |||
|---|---|---|---|
| Quadrant | BADHDUFLAG | Total packets | Discarded packets |
| A | 0 | 116 | 0 |
| B | 0 | 116 | 0 |
| C | 0 | 116 | 0 |
| D | 0 | 116 | 0 |
| Mode M0 | |||
|---|---|---|---|
| Quadrant | BADHDUFLAG | Total packets | Discarded packets |
| A | 0 | 11985 | 1 |
| B | 0 | 12211 | 1 |
| C | 0 | 18100 | 1 |
| D | 0 | 38894 | 1 |
| Mode M9 | |||
|---|---|---|---|
| Quadrant | BADHDUFLAG | Total packets | Discarded packets |
| A | 0 | 12 | 0 |
| B | 0 | 12 | 0 |
| C | 0 | 12 | 0 |
| D | 0 | 12 | 0 |
| Quadrant | Total seconds | Saturated seconds | Saturation percentage |
|---|---|---|---|
| A | 5766 | 46 | 0.797780% |
| B | 5767 | 67 | 1.161783% |
| C | 5767 | 289 | 5.011271% |
| D | 5767 | 3428 | 59.441651% |
Noise dominated data is calculated using 1-second bins in cleaned event files. If a bin has >2000 counts, and if more than 50% of those come from <1% of pixels, then it is considered to be noise-dominated and hence unusable.
| Quadrant | # 1 sec bins | Bins with >0 counts | Bins with >2000 counts | High rate bins dominated by noise | Noise dominated (total time) | Noise dominated (detector-on time) | Marked lightcurve |
|---|---|---|---|---|---|---|---|
| A | 6966 | 5768 | 0 | 0 | 0.00% | 0.00% | 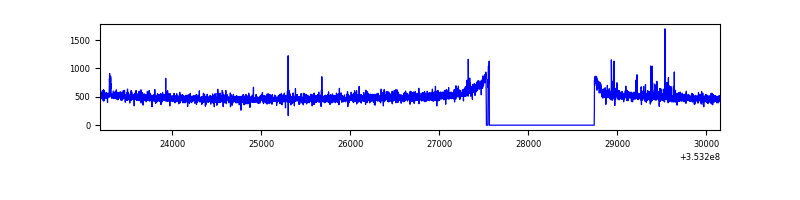 |
| B | 6967 | 5769 | 1 | 1 | 0.01% | 0.02% | 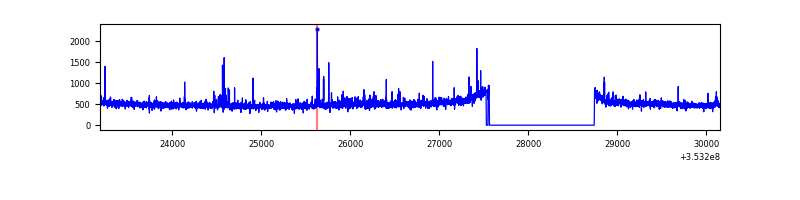 |
| C | 6967 | 5769 | 3 | 3 | 0.04% | 0.05% | 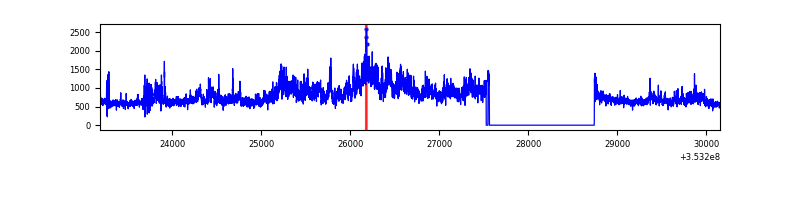 |
| D | 6967 | 5768 | 2927 | 2927 | 42.01% | 50.75% | 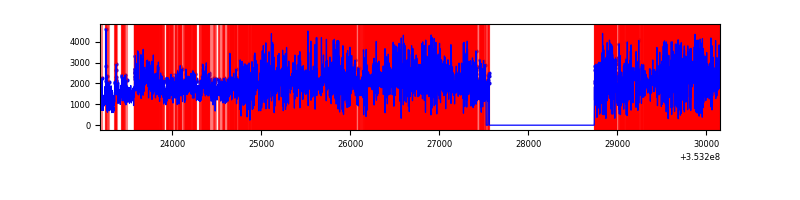 |
Top three noisy pixels from each quadrant. If the there are fewer than three noisy pixels in the level2.evt file, extra rows are filled as -1
| Pixel properties | Quadrant properties | ||||||
|---|---|---|---|---|---|---|---|
| Quadrant | DetID | PixID | Counts | Sigma | Mean | Median | Sigma |
| A | 12 | 96 | 17620 | 114.89 | 738 | 726 | 147.0 |
| A | 13 | 254 | 11619 | 74.08 | 738 | 726 | 147.0 |
| A | 15 | 174 | 7725 | 47.6 | 738 | 726 | 147.0 |
| B | 0 | 190 | 24646 | 177.11 | 731 | 713 | 135.1 |
| B | 15 | 32 | 21147 | 151.22 | 731 | 713 | 135.1 |
| B | 12 | 111 | 15570 | 109.95 | 731 | 713 | 135.1 |
| C | 3 | 233 | 1619692 | 9791.54 | 713 | 719 | 165.3 |
| C | 14 | 238 | 137435 | 826.86 | 713 | 719 | 165.3 |
| C | 7 | 247 | 64177 | 383.79 | 713 | 719 | 165.3 |
| D | 8 | 195 | 5498644 | 41609.49 | 560 | 545 | 132.1 |
| D | 1 | 52 | 3793679 | 28706.36 | 560 | 545 | 132.1 |
| D | 12 | 33 | 138394 | 1043.24 | 560 | 545 | 132.1 |
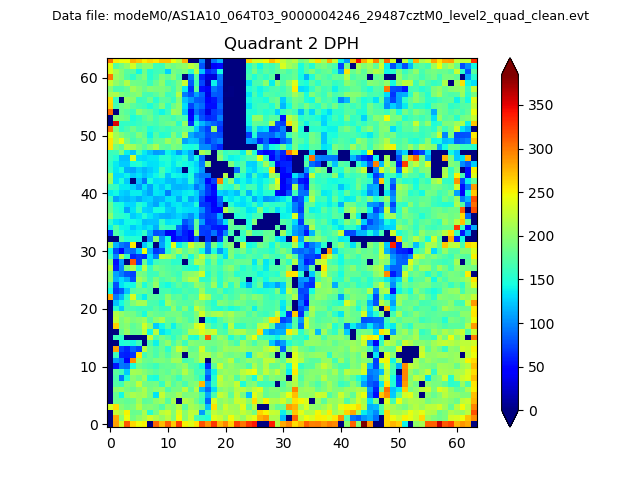
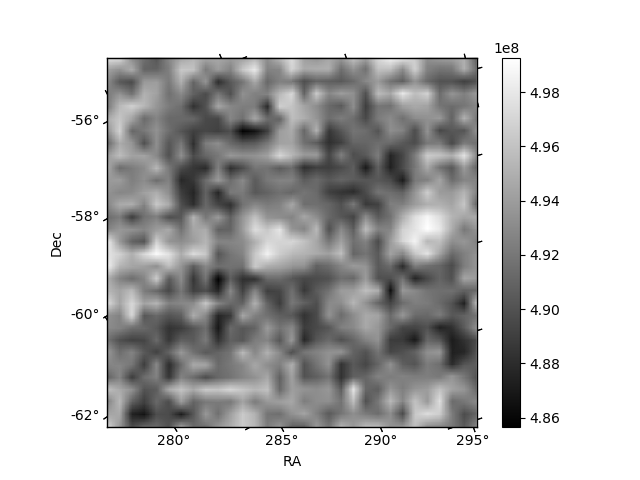
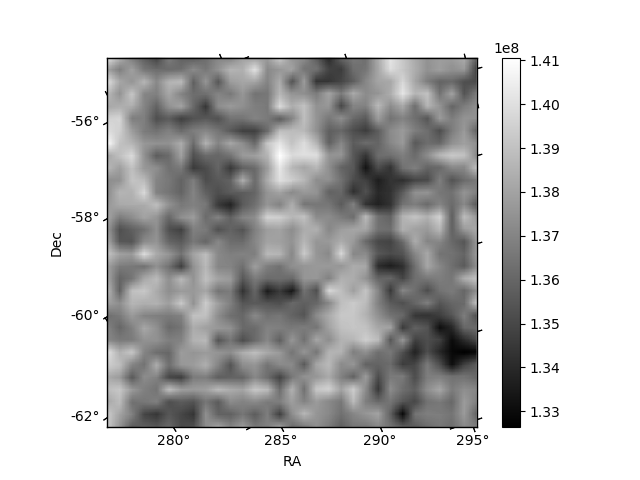
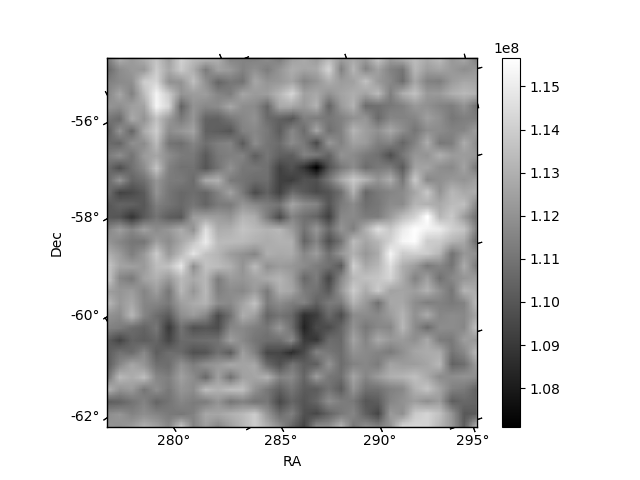
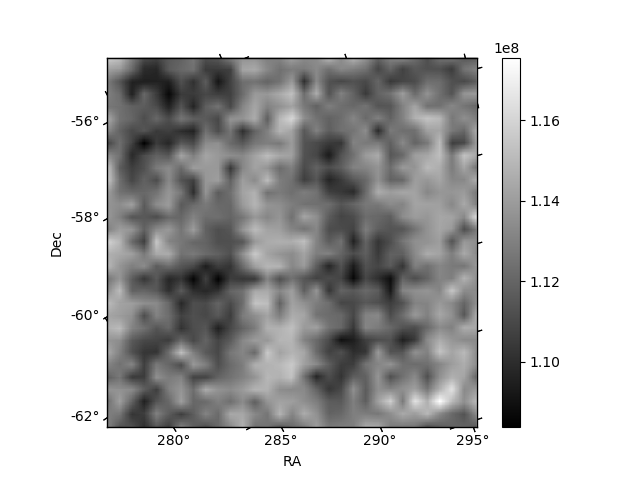
Histogram calculated using DETX and DETY for each event in the final _common_clean file
| Quadrant A | 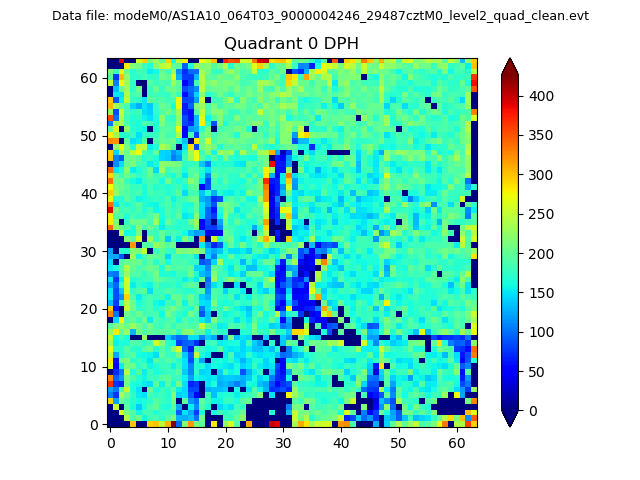 |
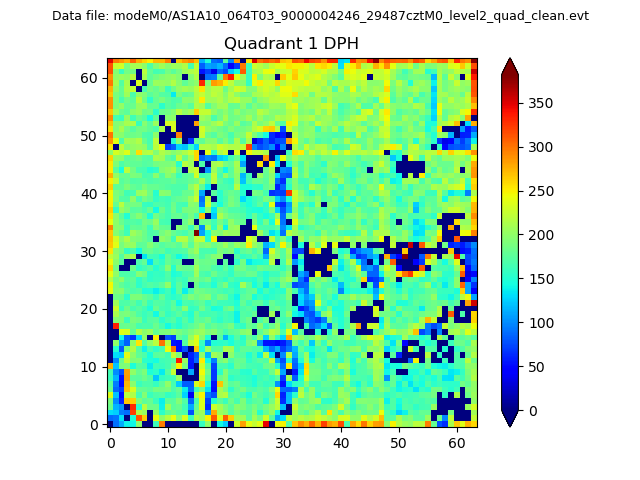 |
Quadrant B |
|---|---|---|---|
| Quadrant D | 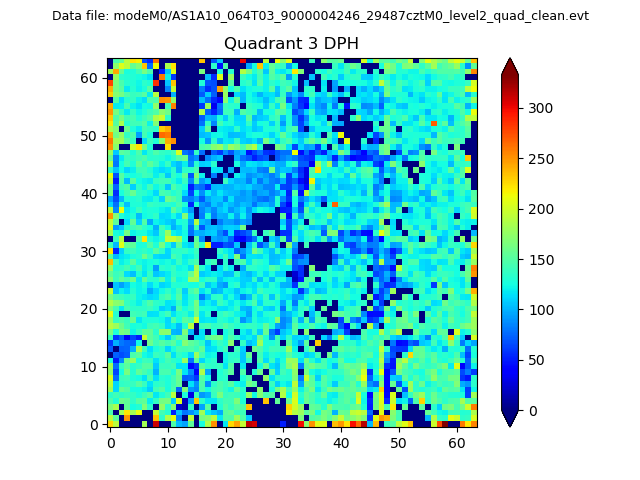 |
 |
Quadrant C |
| Plot type | Count rate plots | Images |
|---|---|---|
| Comparison with Poisson distribution Blue bars denote a histogram of data divided into 1 sec bins. Red curve is a Poisson curve with rate = median count rate of data. |
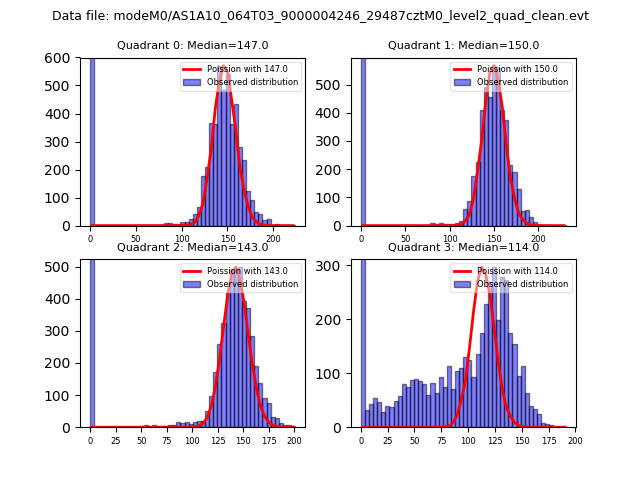 |
 |
| Quadrant-wise count rates Data is divided into 100 sec bins |
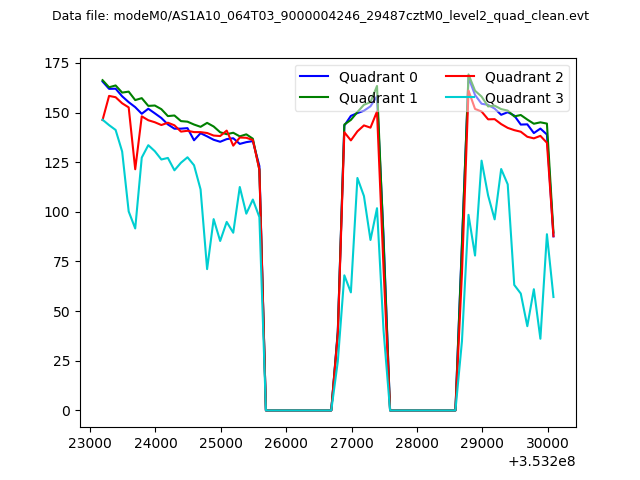 |
|
| Module-wise count rates for Quadrant A Data is divided into 100 sec bins |
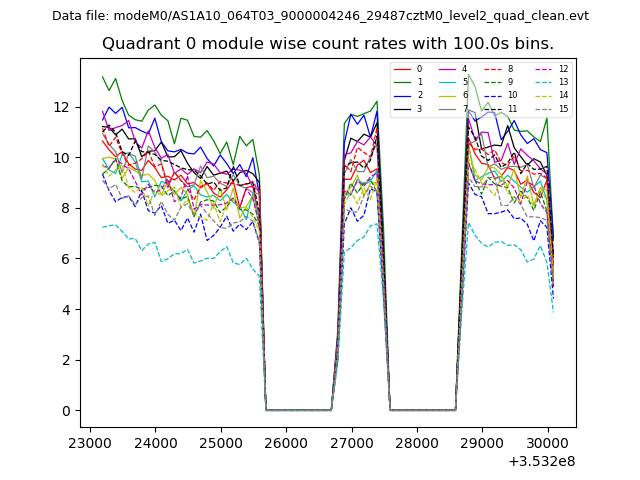 |
 |
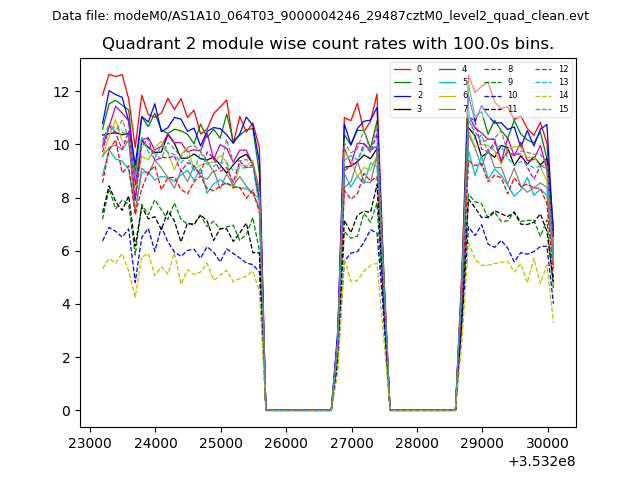
| Module-wise count rates for Quadrant B Data is divided into 100 sec bins |
 |
 |
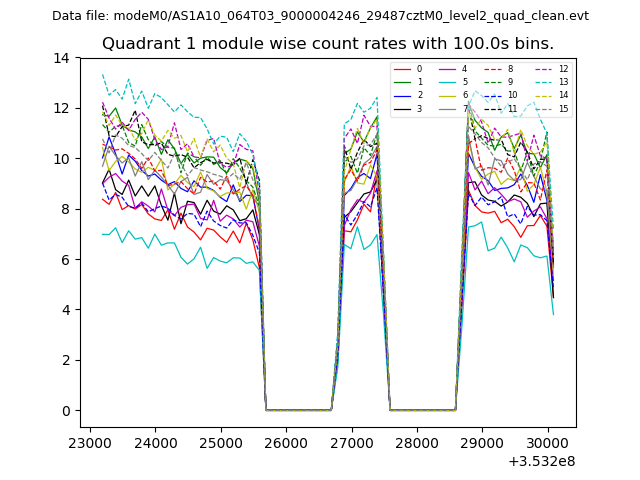
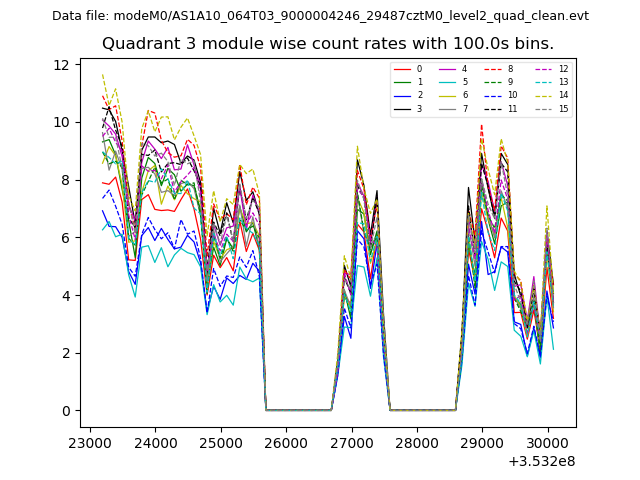
| Module-wise count rates for Quadrant C Data is divided into 100 sec bins |
 |
 |
| Module-wise count rates for Quadrant D Data is divided into 100 sec bins |
 |
 |
| Parameter | Plot |
|---|---|
| CZT HV Monitor | 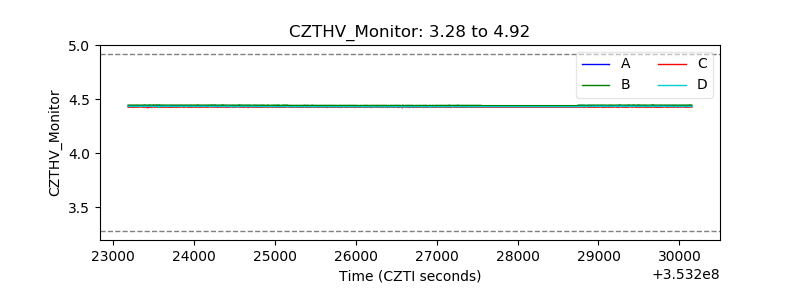 |
| D_VDD | 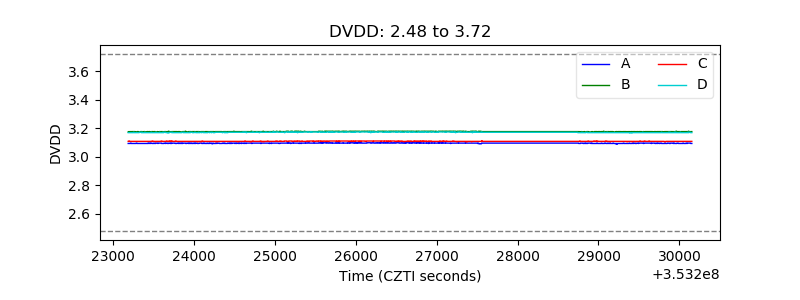 |
| Temperature 1 |  |
| Veto HV Monitor | 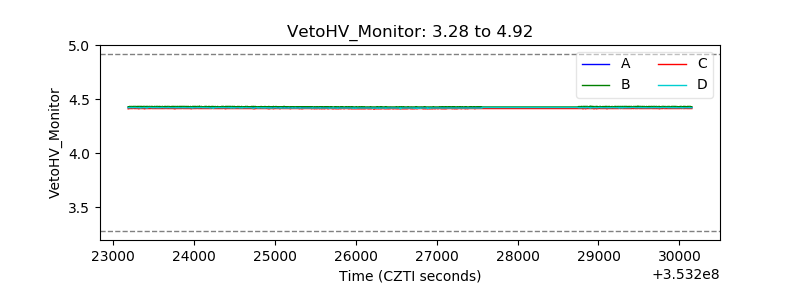 |
| Veto LLD | 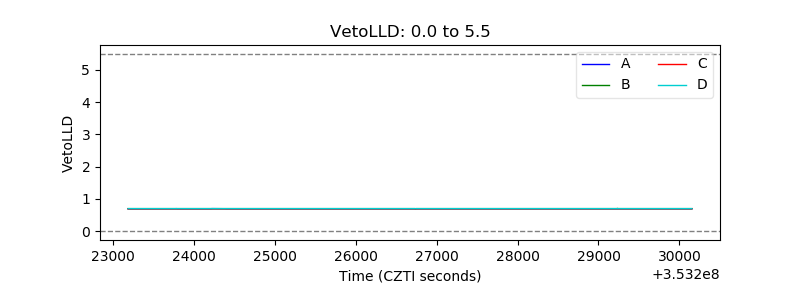 |
| Alpha Counter | 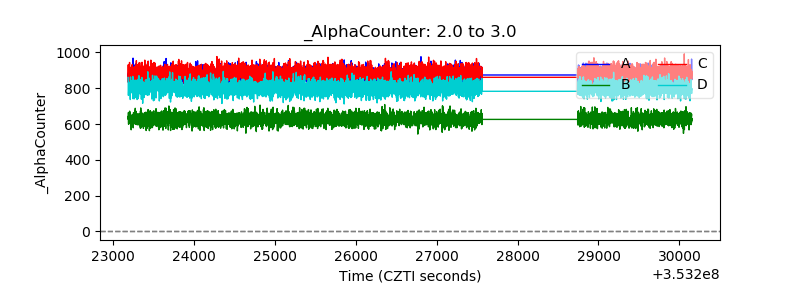 |
| _CPM_Rate | 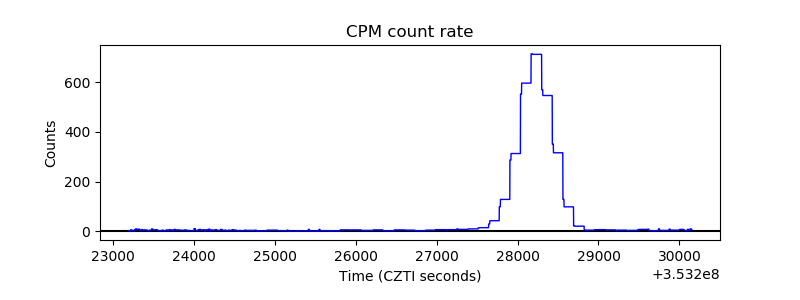 |
| CZT Counter | 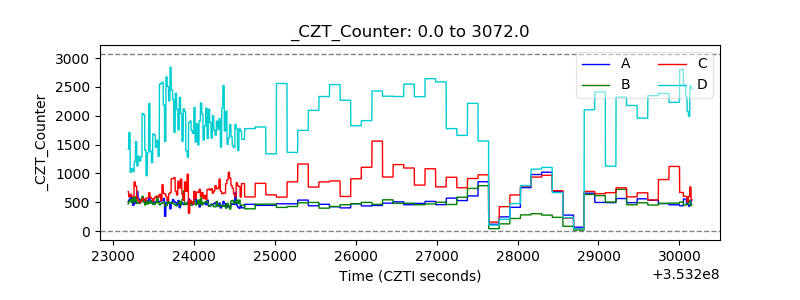 |
| +2.5 Volts monitor |  |
| +5 Volts monitor |  |
| _ROLL_ROT | 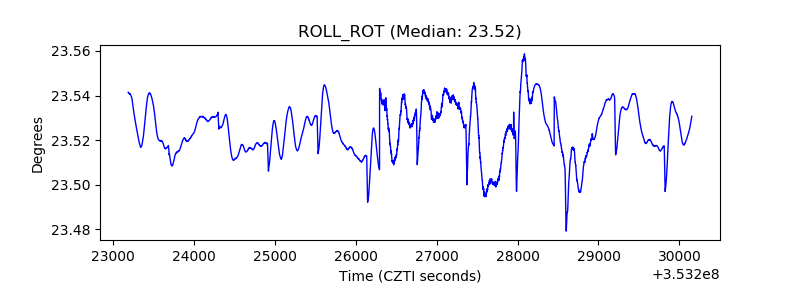 |
| _Roll_DEC | 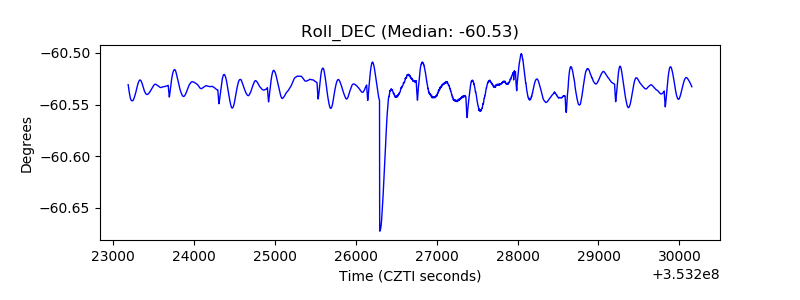 |
| _Roll_RA | 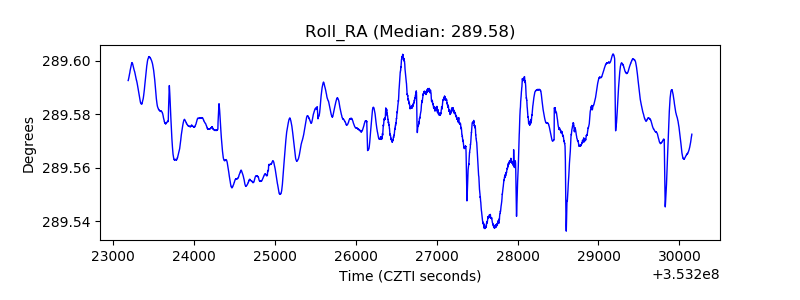 |
| Veto Counter | 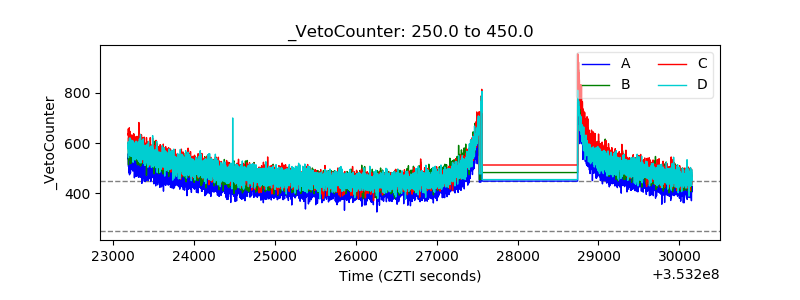 |