| Param | Original file | Final file |
|---|---|---|
| Filename | modeM0/AS1A10_064T03_9000004246_29488cztM0_level2.evt | modeM0/AS1A10_064T03_9000004246_29488cztM0_level2_quad_clean.evt |
| Size (bytes) | 871,027,200 | 106,312,320 |
| Size | 830.7 MB | 101.4 MB |
| Events in quadrant A | 3,296,320 | 768,670 |
| Events in quadrant B | 3,311,618 | 784,081 |
| Events in quadrant C | 4,384,057 | 745,281 |
| Events in quadrant D | 14,933,481 | 451,942 |
| Mode SS | |||
|---|---|---|---|
| Quadrant | BADHDUFLAG | Total packets | Discarded packets |
| A | 0 | 136 | 0 |
| B | 0 | 136 | 0 |
| C | 0 | 136 | 0 |
| D | 0 | 136 | 0 |
| Mode M0 | |||
|---|---|---|---|
| Quadrant | BADHDUFLAG | Total packets | Discarded packets |
| A | 0 | 13936 | 1 |
| B | 0 | 13918 | 1 |
| C | 0 | 17866 | 1 |
| D | 0 | 48987 | 1 |
| Mode M9 | |||
|---|---|---|---|
| Quadrant | BADHDUFLAG | Total packets | Discarded packets |
| A | 0 | 8 | 0 |
| B | 0 | 8 | 0 |
| C | 0 | 8 | 0 |
| D | 0 | 8 | 0 |
| Quadrant | Total seconds | Saturated seconds | Saturation percentage |
|---|---|---|---|
| A | 6711 | 107 | 1.594397% |
| B | 6712 | 76 | 1.132300% |
| C | 6712 | 232 | 3.456496% |
| D | 6712 | 5216 | 77.711561% |
Noise dominated data is calculated using 1-second bins in cleaned event files. If a bin has >2000 counts, and if more than 50% of those come from <1% of pixels, then it is considered to be noise-dominated and hence unusable.
| Quadrant | # 1 sec bins | Bins with >0 counts | Bins with >2000 counts | High rate bins dominated by noise | Noise dominated (total time) | Noise dominated (detector-on time) | Marked lightcurve |
|---|---|---|---|---|---|---|---|
| A | 7531 | 6712 | 8 | 8 | 0.11% | 0.12% | 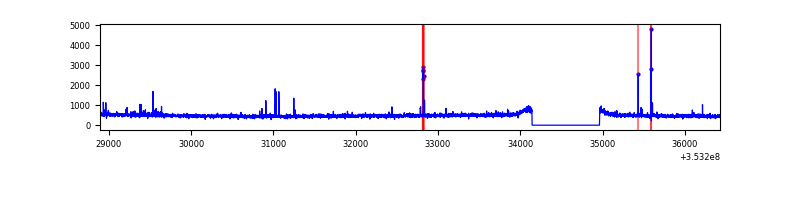 |
| B | 7532 | 6713 | 0 | 0 | 0.00% | 0.00% | 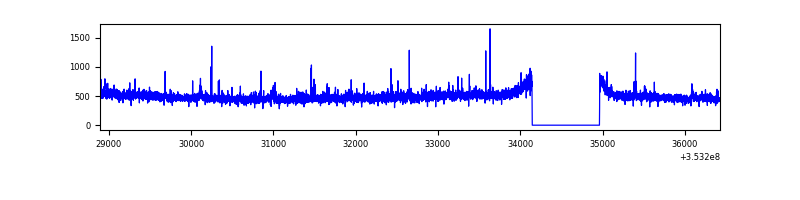 |
| C | 7532 | 6713 | 1 | 1 | 0.01% | 0.01% | 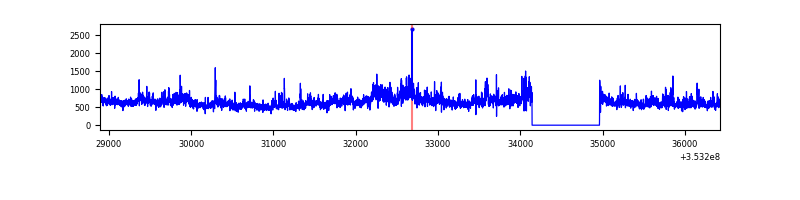 |
| D | 7532 | 6713 | 4493 | 4493 | 59.65% | 66.93% | 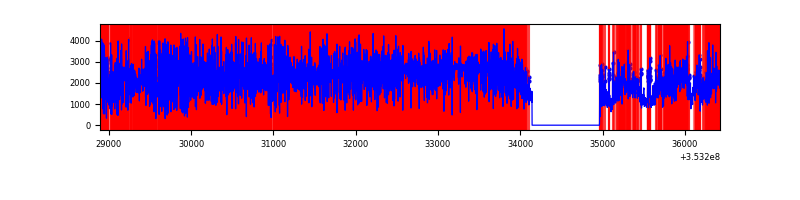 |
Top three noisy pixels from each quadrant. If the there are fewer than three noisy pixels in the level2.evt file, extra rows are filled as -1
| Pixel properties | Quadrant properties | ||||||
|---|---|---|---|---|---|---|---|
| Quadrant | DetID | PixID | Counts | Sigma | Mean | Median | Sigma |
| A | 12 | 96 | 51538 | 302.67 | 834 | 816 | 167.6 |
| A | 5 | 98 | 18308 | 104.38 | 834 | 816 | 167.6 |
| A | 13 | 254 | 12530 | 69.9 | 834 | 816 | 167.6 |
| B | 0 | 190 | 21474 | 133.25 | 827 | 804 | 155.1 |
| B | 12 | 111 | 18533 | 114.29 | 827 | 804 | 155.1 |
| B | 11 | 111 | 16588 | 101.75 | 827 | 804 | 155.1 |
| C | 3 | 233 | 964097 | 5195.79 | 805 | 810 | 185.4 |
| C | 14 | 238 | 154548 | 829.23 | 805 | 810 | 185.4 |
| C | 7 | 247 | 79755 | 425.81 | 805 | 810 | 185.4 |
| D | 8 | 195 | 6323199 | 49616.04 | 539 | 523 | 127.4 |
| D | 1 | 52 | 5169395 | 40561.78 | 539 | 523 | 127.4 |
| D | 12 | 33 | 1207002 | 9467.62 | 539 | 523 | 127.4 |
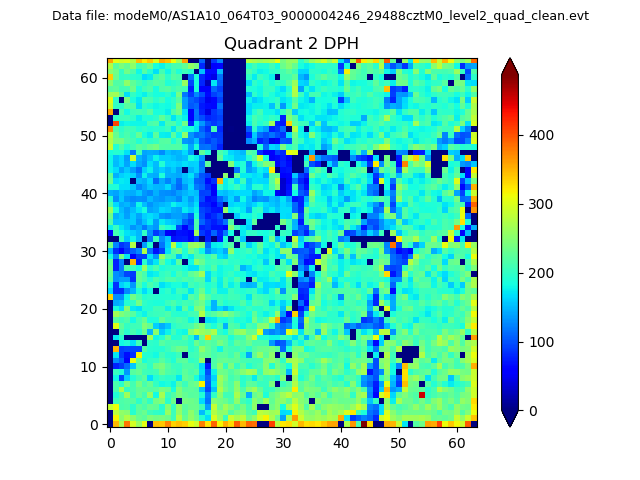
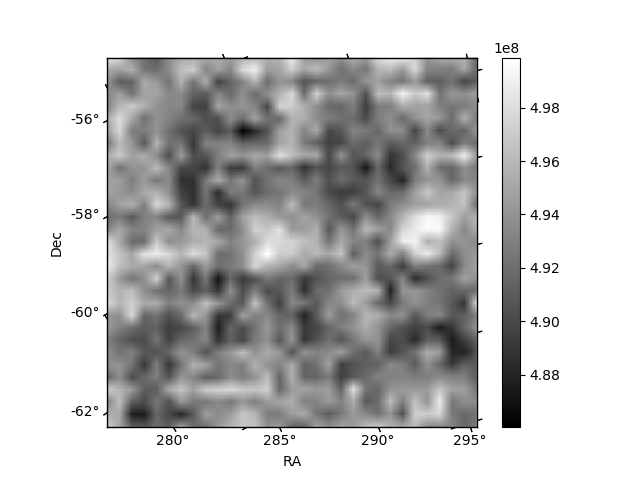
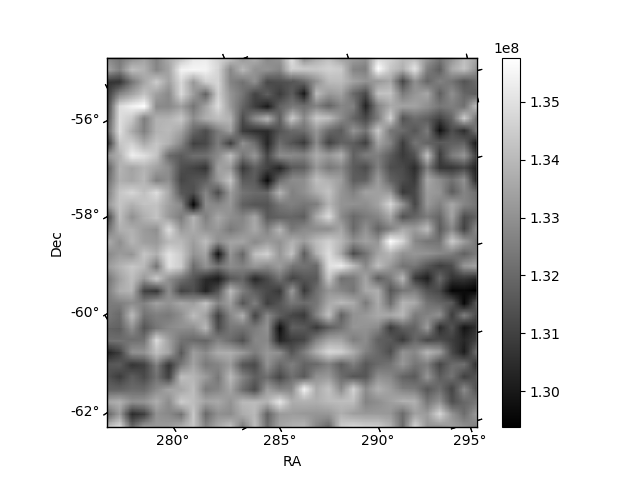
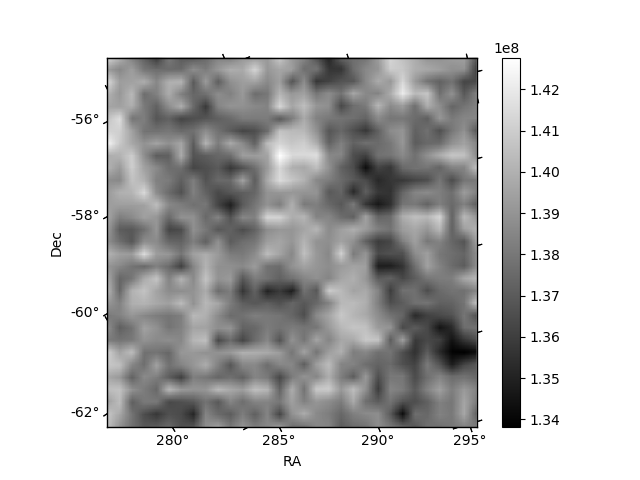
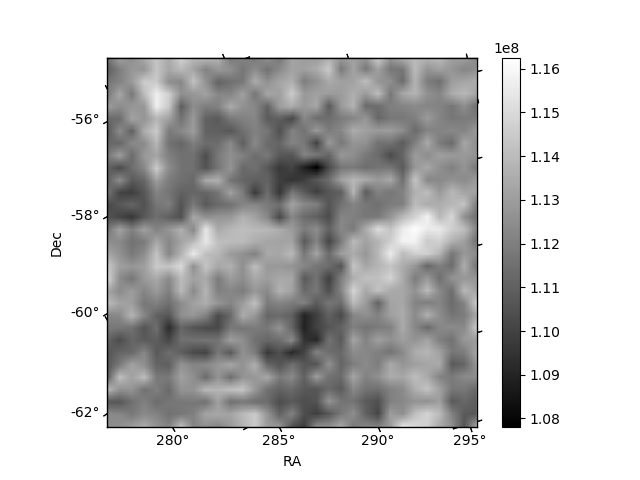
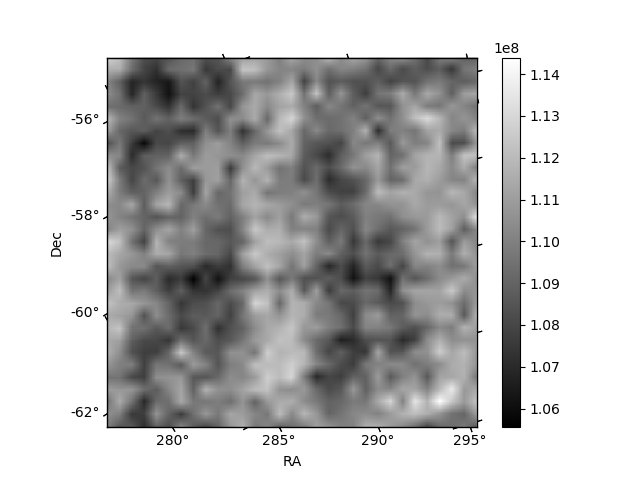
Histogram calculated using DETX and DETY for each event in the final _common_clean file
| Quadrant A | 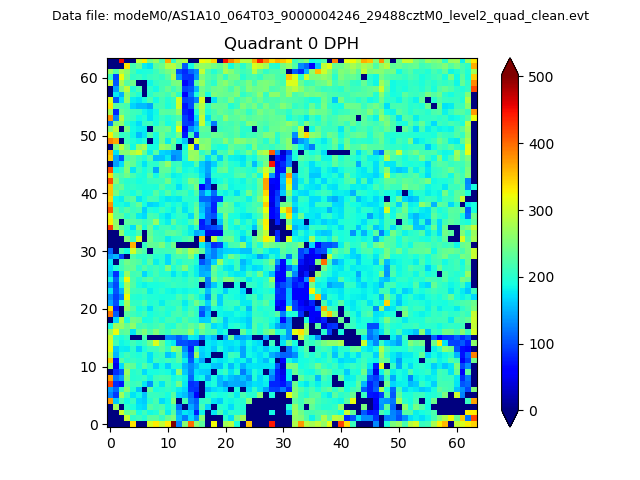 |
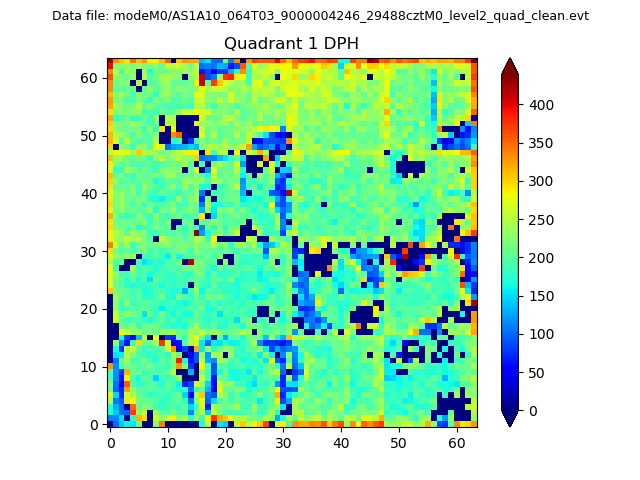 |
Quadrant B |
|---|---|---|---|
| Quadrant D | 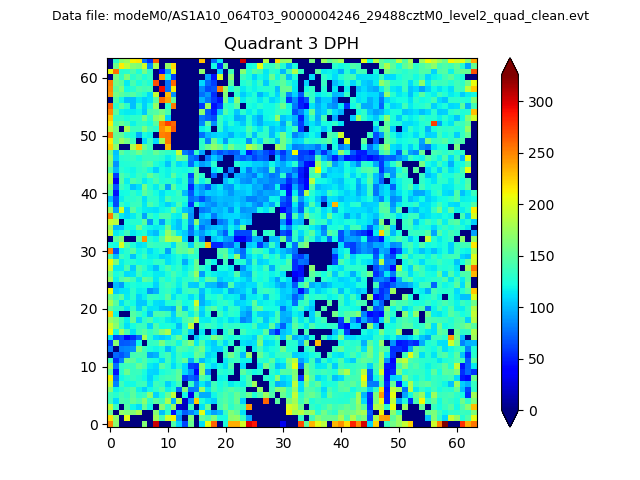 |
 |
Quadrant C |
| Plot type | Count rate plots | Images |
|---|---|---|
| Comparison with Poisson distribution Blue bars denote a histogram of data divided into 1 sec bins. Red curve is a Poisson curve with rate = median count rate of data. |
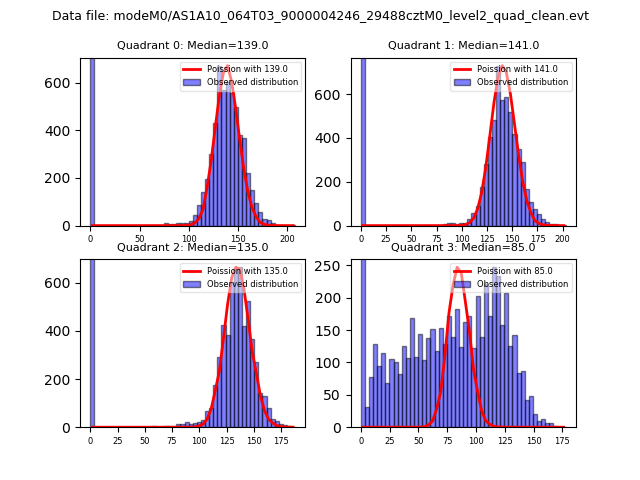 |
 |
| Quadrant-wise count rates Data is divided into 100 sec bins |
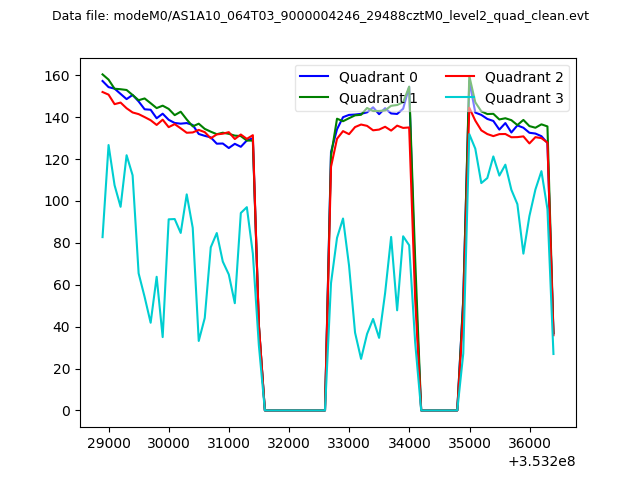 |
|
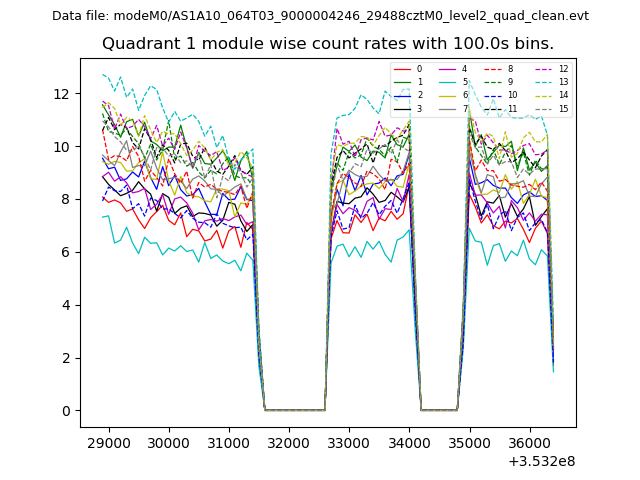
| Module-wise count rates for Quadrant A Data is divided into 100 sec bins |
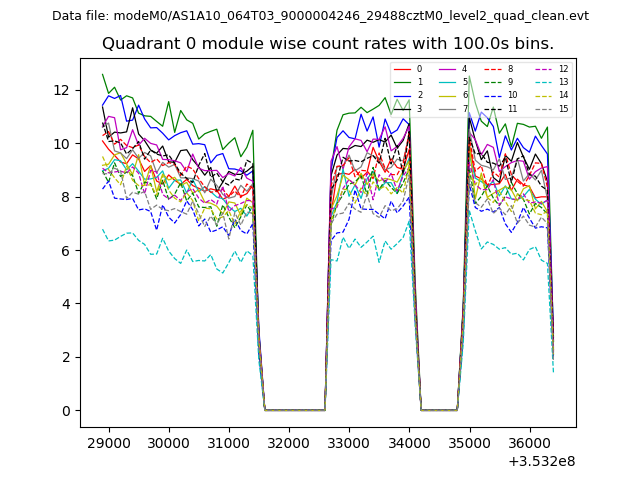 |
 |
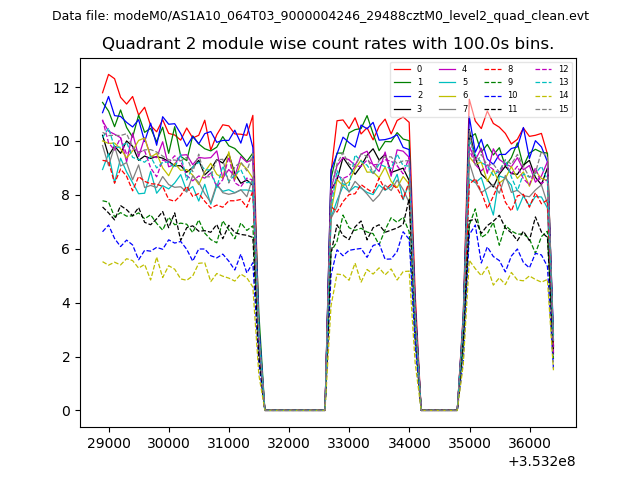
| Module-wise count rates for Quadrant B Data is divided into 100 sec bins |
 |
 |
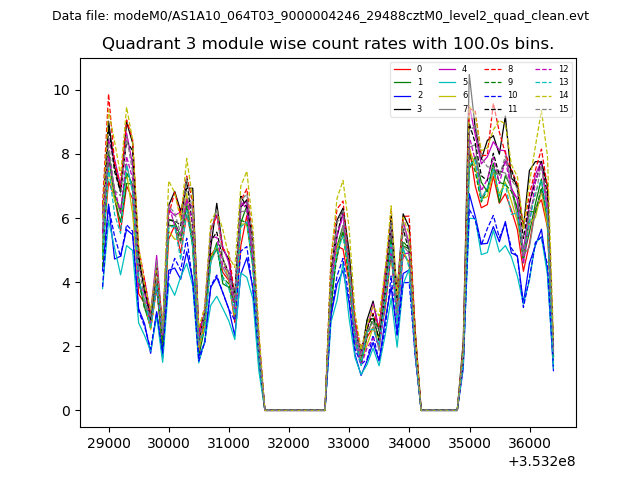
| Module-wise count rates for Quadrant C Data is divided into 100 sec bins |
 |
 |
| Module-wise count rates for Quadrant D Data is divided into 100 sec bins |
 |
 |
| Parameter | Plot |
|---|---|
| CZT HV Monitor | 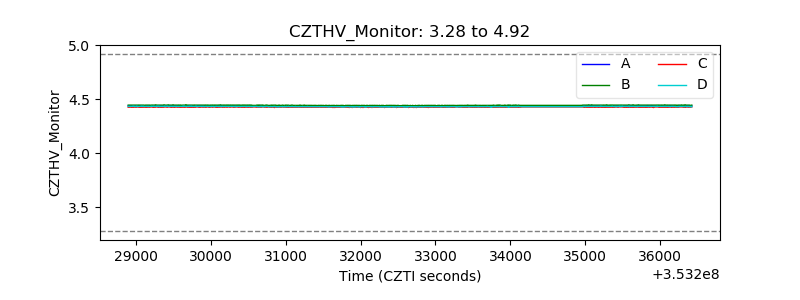 |
| D_VDD |  |
| Temperature 1 |  |
| Veto HV Monitor | 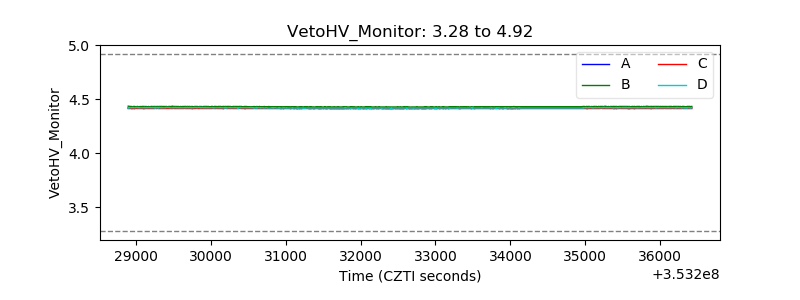 |
| Veto LLD |  |
| Alpha Counter | 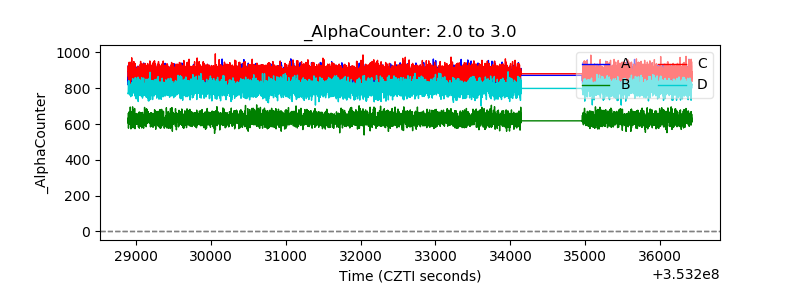 |
| _CPM_Rate | 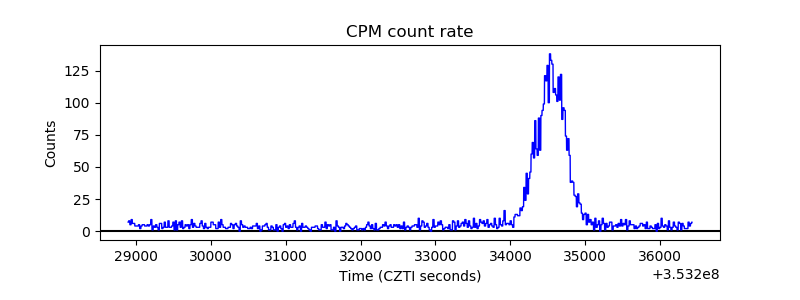 |
| CZT Counter | 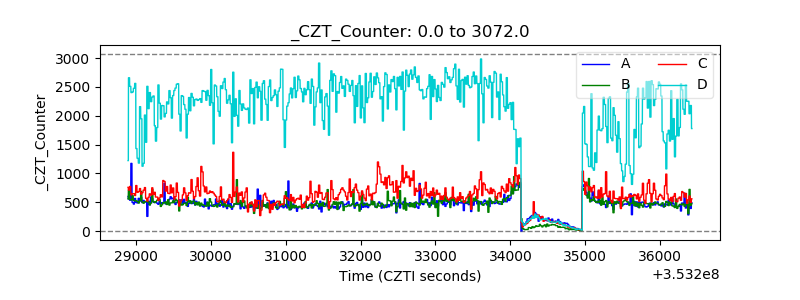 |
| +2.5 Volts monitor |  |
| +5 Volts monitor |  |
| _ROLL_ROT | 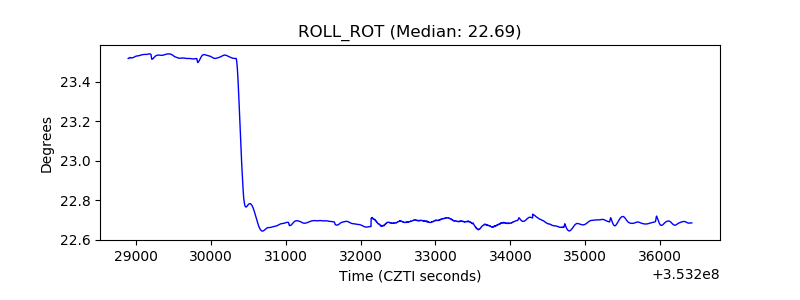 |
| _Roll_DEC | 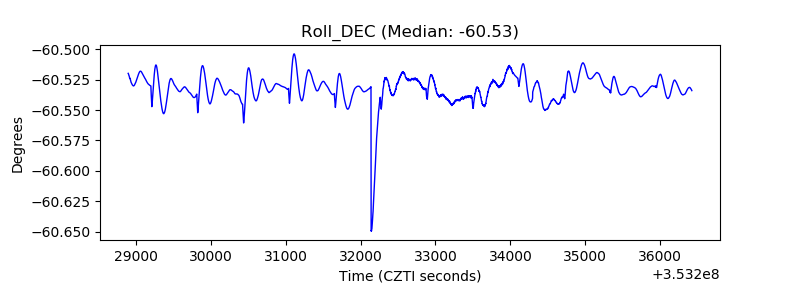 |
| _Roll_RA | 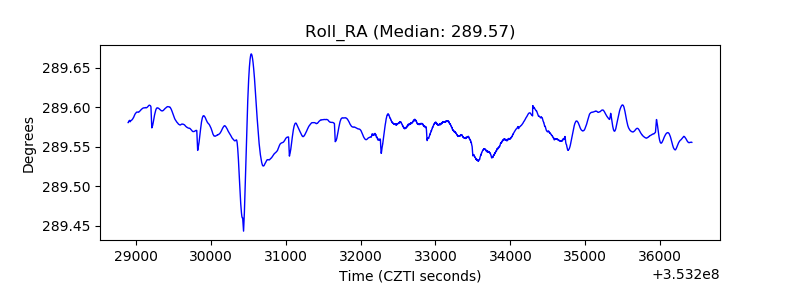 |
| Veto Counter | 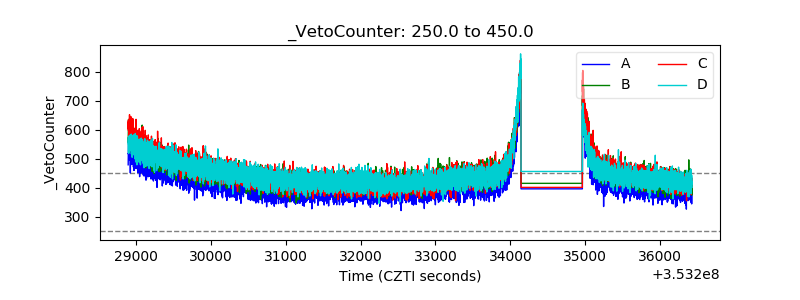 |