| Param | Original file | Final file |
|---|---|---|
| Filename | modeM0/AS1A10_064T03_9000004246_29489cztM0_level2.evt | modeM0/AS1A10_064T03_9000004246_29489cztM0_level2_quad_clean.evt |
| Size (bytes) | 906,217,920 | 116,821,440 |
| Size | 864.2 MB | 111.4 MB |
| Events in quadrant A | 3,467,430 | 819,251 |
| Events in quadrant B | 3,562,301 | 835,340 |
| Events in quadrant C | 4,587,734 | 775,098 |
| Events in quadrant D | 15,326,801 | 590,931 |
| Mode SS | |||
|---|---|---|---|
| Quadrant | BADHDUFLAG | Total packets | Discarded packets |
| A | 0 | 152 | 0 |
| B | 0 | 152 | 0 |
| C | 0 | 152 | 0 |
| D | 0 | 152 | 0 |
| Mode M0 | |||
|---|---|---|---|
| Quadrant | BADHDUFLAG | Total packets | Discarded packets |
| A | 0 | 15144 | 1 |
| B | 0 | 15286 | 1 |
| C | 0 | 18646 | 1 |
| D | 0 | 50635 | 1 |
| Mode M9 | |||
|---|---|---|---|
| Quadrant | BADHDUFLAG | Total packets | Discarded packets |
| A | 0 | 3 | 0 |
| B | 0 | 3 | 0 |
| C | 0 | 3 | 0 |
| D | 0 | 3 | 0 |
| Quadrant | Total seconds | Saturated seconds | Saturation percentage |
|---|---|---|---|
| A | 7401 | 112 | 1.513309% |
| B | 7402 | 144 | 1.945420% |
| C | 7402 | 423 | 5.714672% |
| D | 7402 | 4676 | 63.172116% |
Noise dominated data is calculated using 1-second bins in cleaned event files. If a bin has >2000 counts, and if more than 50% of those come from <1% of pixels, then it is considered to be noise-dominated and hence unusable.
| Quadrant | # 1 sec bins | Bins with >0 counts | Bins with >2000 counts | High rate bins dominated by noise | Noise dominated (total time) | Noise dominated (detector-on time) | Marked lightcurve |
|---|---|---|---|---|---|---|---|
| A | 7761 | 7402 | 3 | 3 | 0.04% | 0.04% | 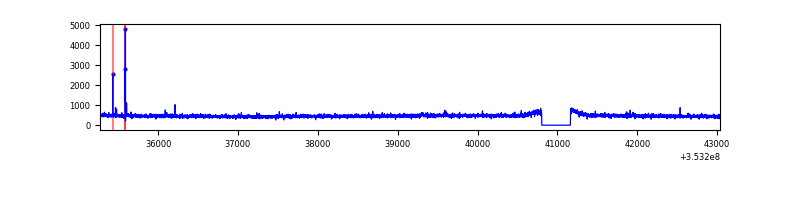 |
| B | 7762 | 7403 | 6 | 6 | 0.08% | 0.08% | 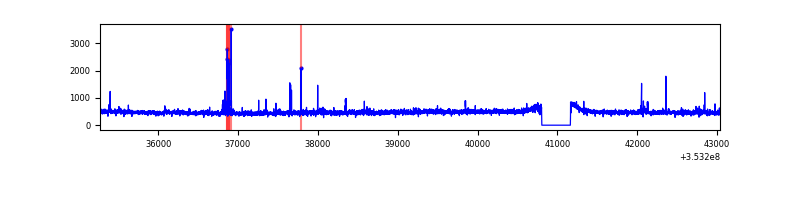 |
| C | 7762 | 7403 | 3 | 3 | 0.04% | 0.04% |  |
| D | 7762 | 7403 | 4232 | 4232 | 54.52% | 57.17% | 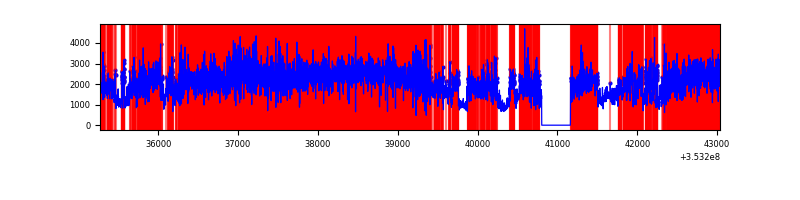 |
Top three noisy pixels from each quadrant. If the there are fewer than three noisy pixels in the level2.evt file, extra rows are filled as -1
| Pixel properties | Quadrant properties | ||||||
|---|---|---|---|---|---|---|---|
| Quadrant | DetID | PixID | Counts | Sigma | Mean | Median | Sigma |
| A | 12 | 96 | 17519 | 92.84 | 890 | 870 | 179.3 |
| A | 13 | 254 | 13794 | 72.07 | 890 | 870 | 179.3 |
| A | 5 | 98 | 9202 | 46.46 | 890 | 870 | 179.3 |
| B | 0 | 190 | 27485 | 159.66 | 882 | 857 | 166.8 |
| B | 0 | 156 | 26914 | 156.23 | 882 | 857 | 166.8 |
| B | 0 | 230 | 21328 | 122.74 | 882 | 857 | 166.8 |
| C | 3 | 233 | 817092 | 4200.87 | 840 | 843 | 194.3 |
| C | 14 | 238 | 205939 | 1055.54 | 840 | 843 | 194.3 |
| C | 7 | 247 | 163511 | 837.18 | 840 | 843 | 194.3 |
| D | 8 | 195 | 7181972 | 43224.67 | 695 | 674 | 166.1 |
| D | 1 | 52 | 2994970 | 18022.85 | 695 | 674 | 166.1 |
| D | 12 | 33 | 2274844 | 13688.37 | 695 | 674 | 166.1 |
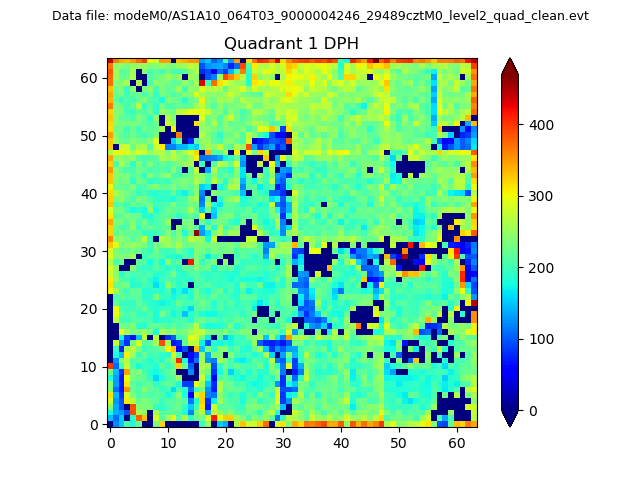
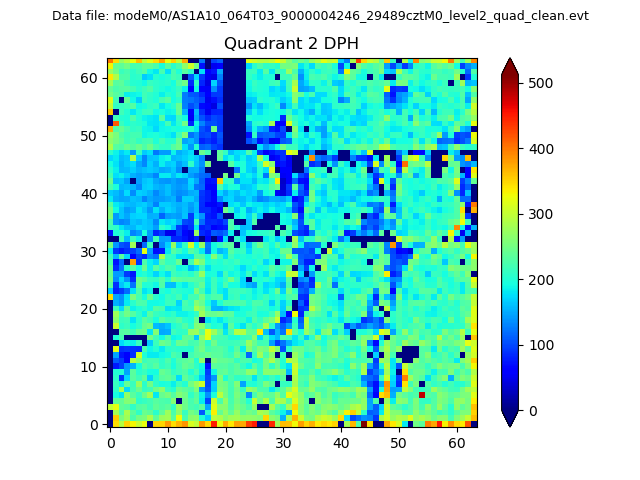
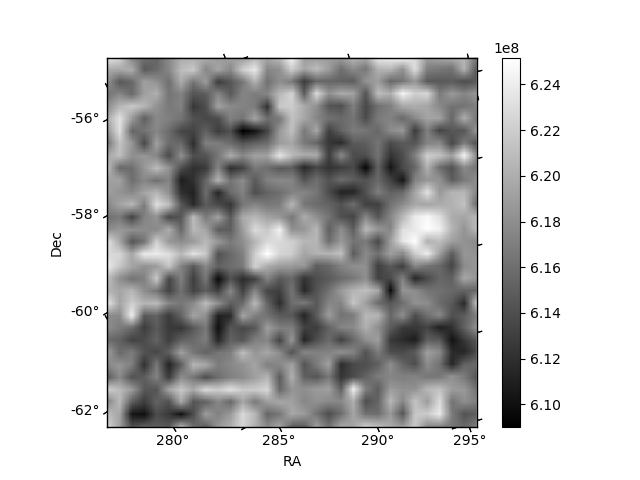
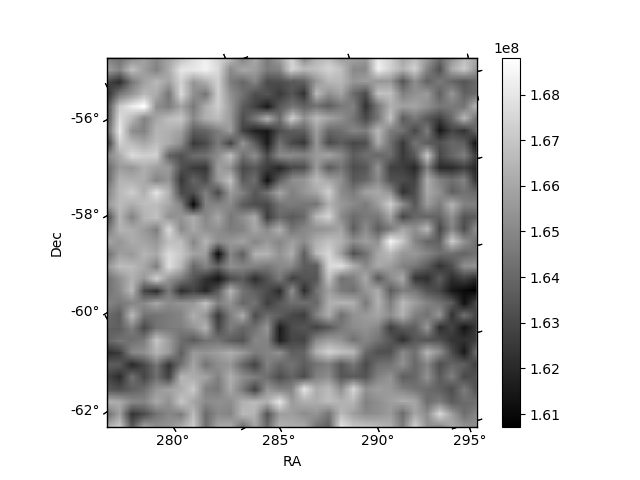
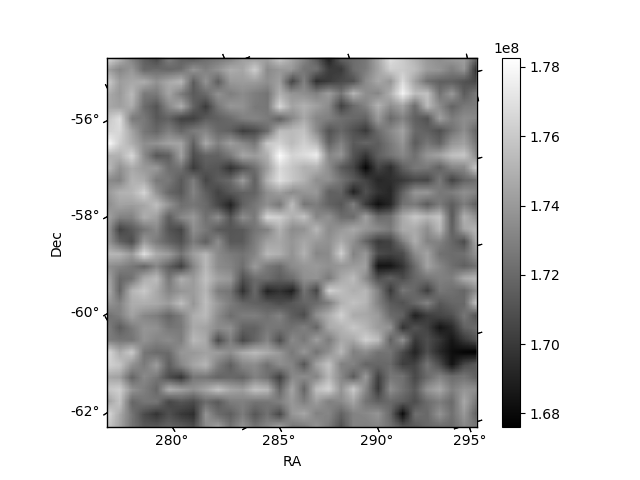
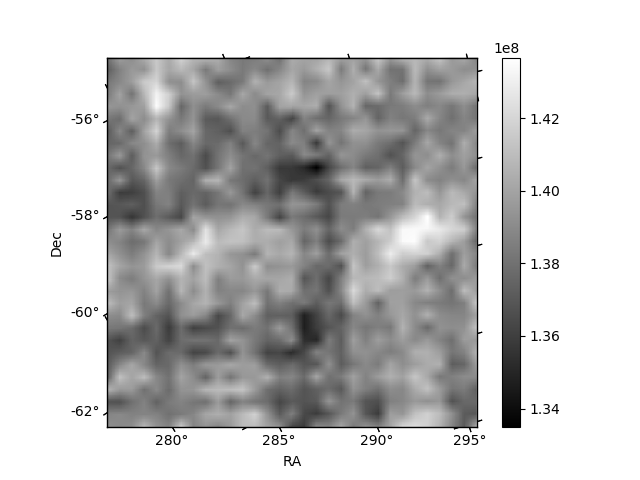
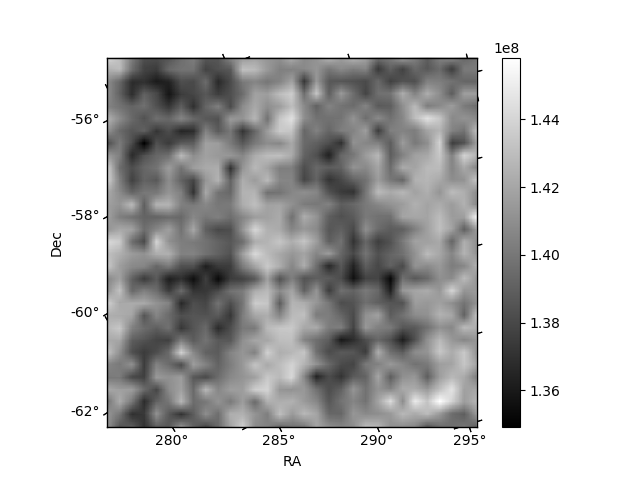
Histogram calculated using DETX and DETY for each event in the final _common_clean file
| Quadrant A | 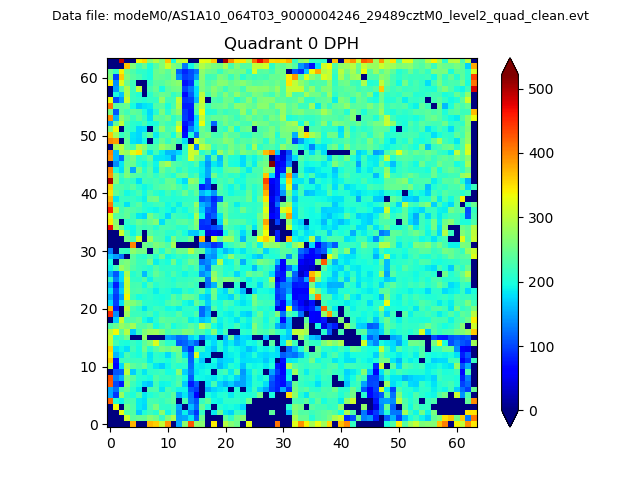 |
 |
Quadrant B |
|---|---|---|---|
| Quadrant D | 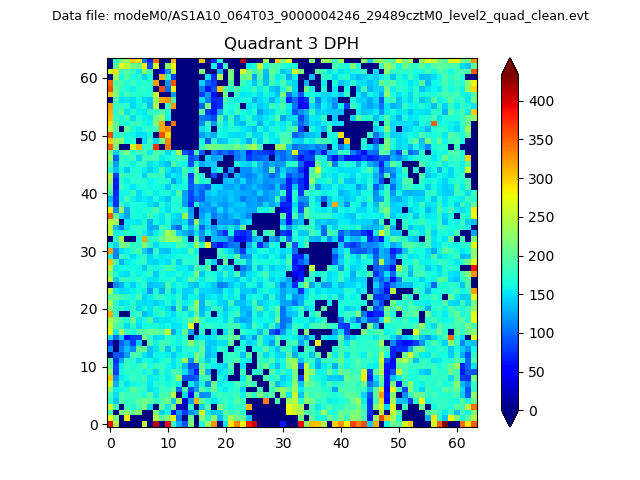 |
 |
Quadrant C |
| Plot type | Count rate plots | Images |
|---|---|---|
| Comparison with Poisson distribution Blue bars denote a histogram of data divided into 1 sec bins. Red curve is a Poisson curve with rate = median count rate of data. |
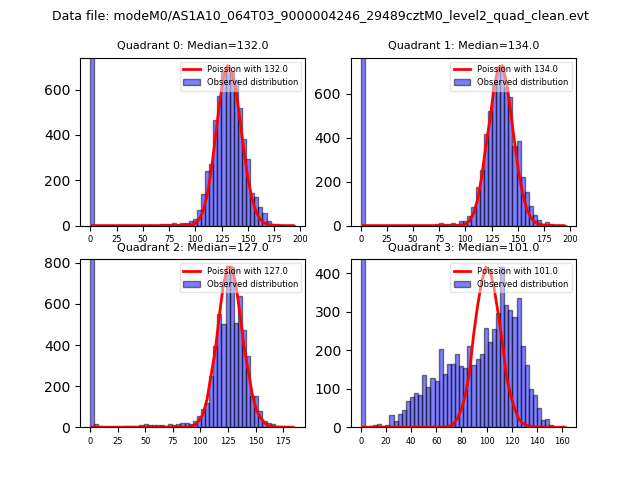 |
 |
| Quadrant-wise count rates Data is divided into 100 sec bins |
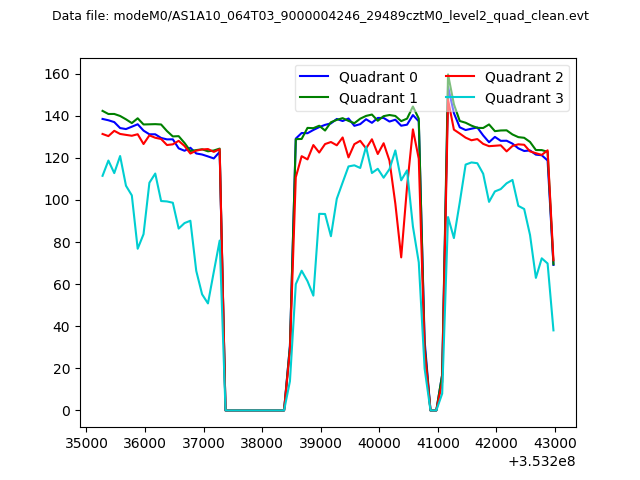 |
|
| Module-wise count rates for Quadrant A Data is divided into 100 sec bins |
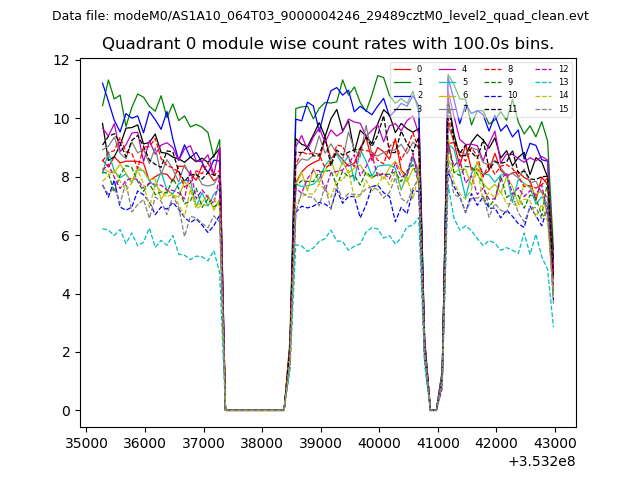 |
 |
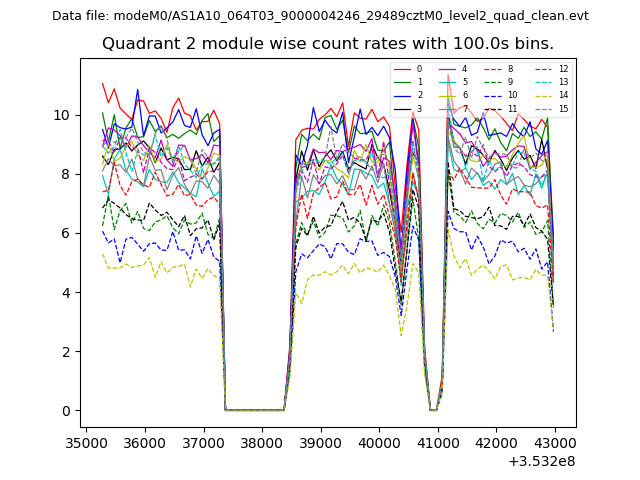
| Module-wise count rates for Quadrant B Data is divided into 100 sec bins |
 |
 |
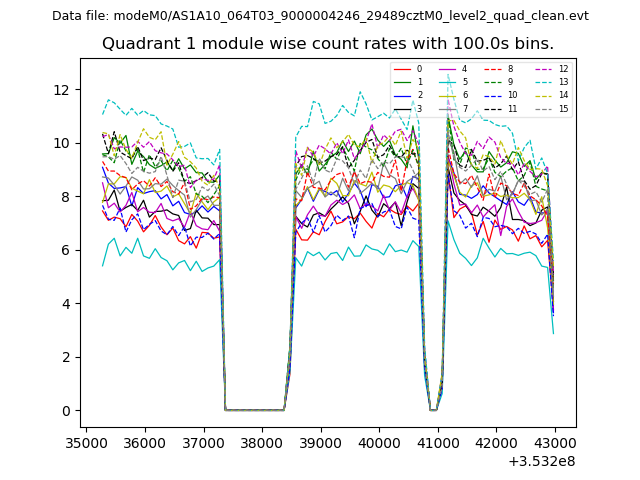
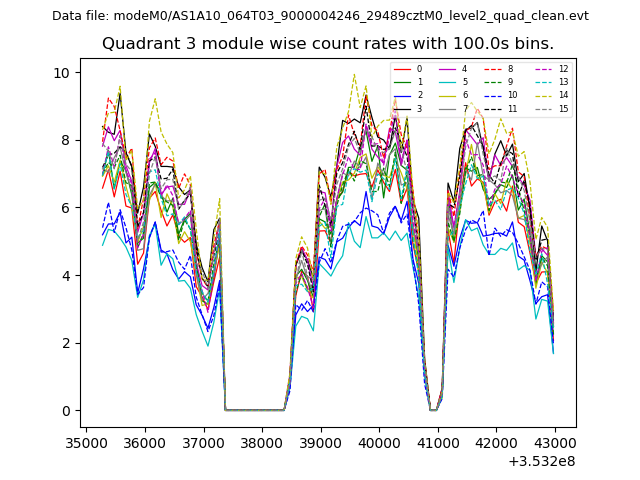
| Module-wise count rates for Quadrant C Data is divided into 100 sec bins |
 |
 |
| Module-wise count rates for Quadrant D Data is divided into 100 sec bins |
 |
 |
| Parameter | Plot |
|---|---|
| CZT HV Monitor | 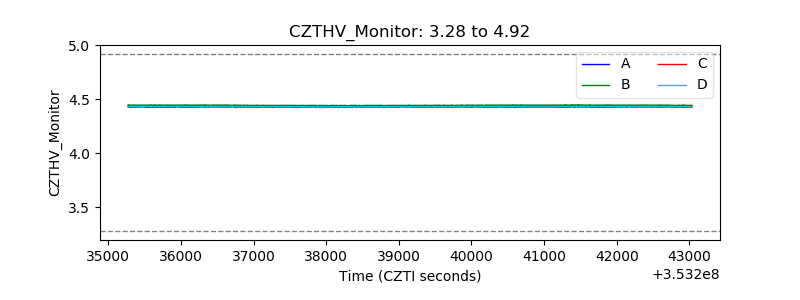 |
| D_VDD | 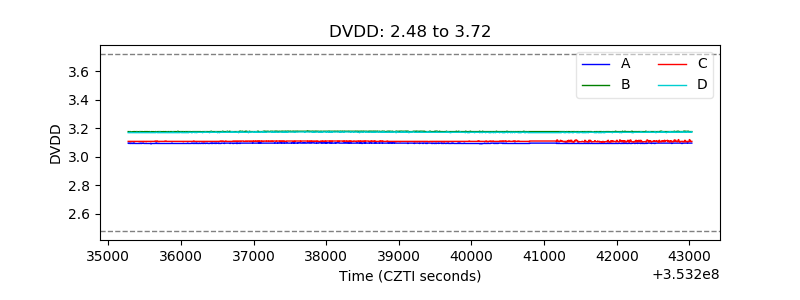 |
| Temperature 1 | 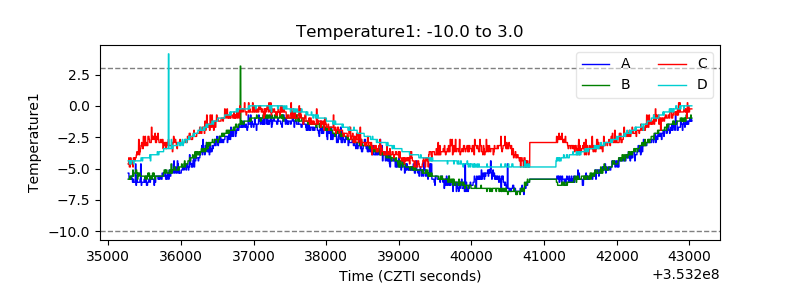 |
| Veto HV Monitor | 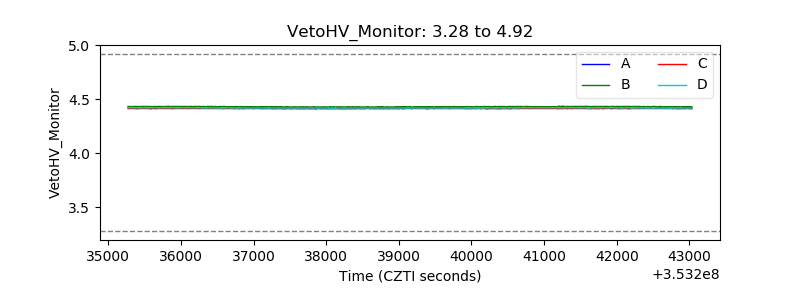 |
| Veto LLD | 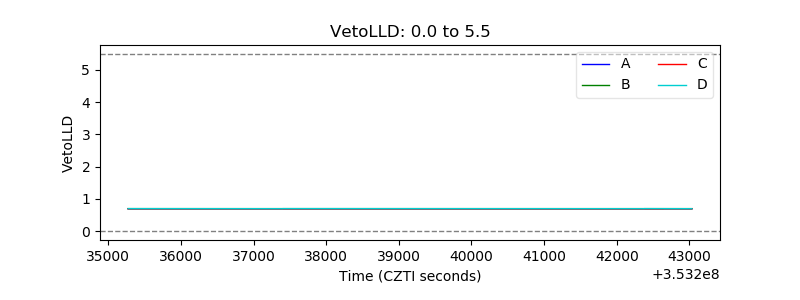 |
| Alpha Counter | 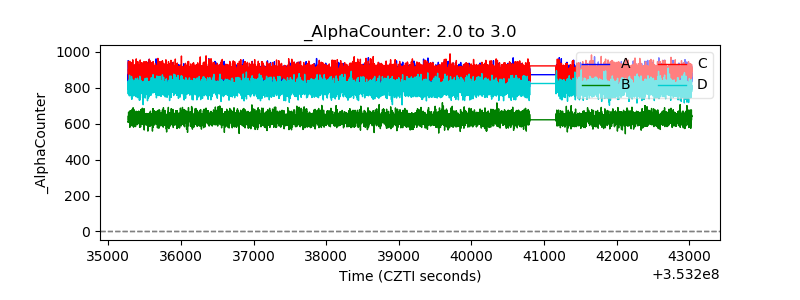 |
| _CPM_Rate | 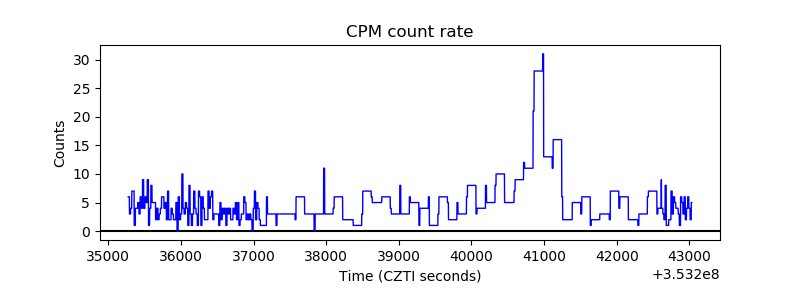 |
| CZT Counter | 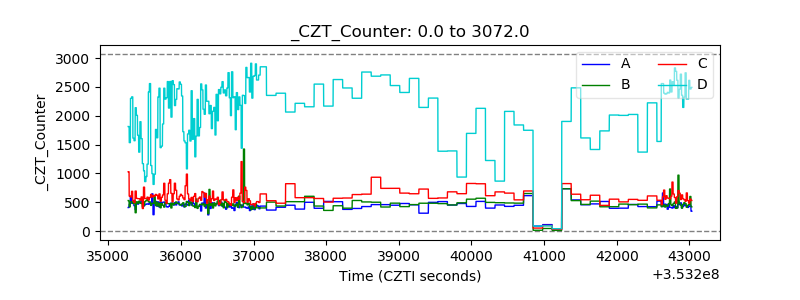 |
| +2.5 Volts monitor |  |
| +5 Volts monitor |  |
| _ROLL_ROT | 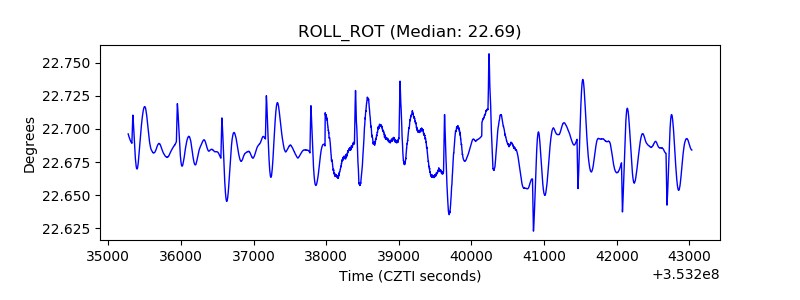 |
| _Roll_DEC | 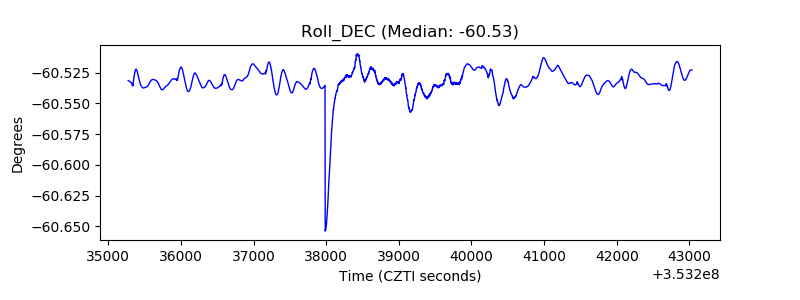 |
| _Roll_RA | 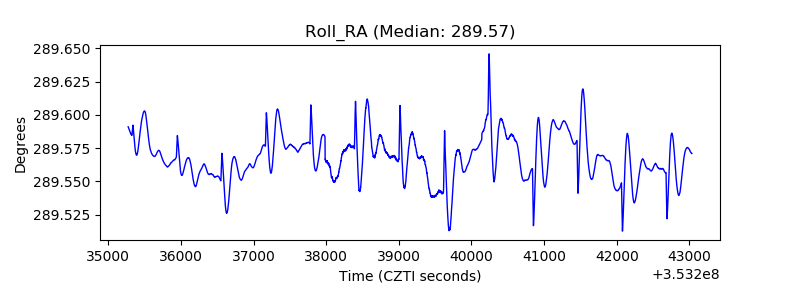 |
| Veto Counter | 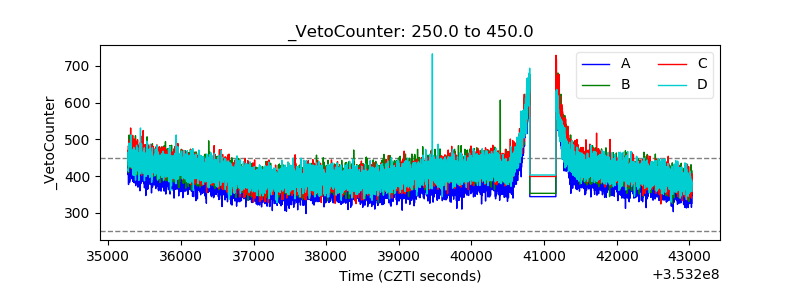 |