| Param | Original file | Final file |
|---|---|---|
| Filename | modeM0/AS1A10_064T03_9000004246_29490cztM0_level2.evt | modeM0/AS1A10_064T03_9000004246_29490cztM0_level2_quad_clean.evt |
| Size (bytes) | 843,733,440 | 102,061,440 |
| Size | 804.6 MB | 97.3 MB |
| Events in quadrant A | 3,214,986 | 708,439 |
| Events in quadrant B | 3,306,269 | 721,405 |
| Events in quadrant C | 3,793,023 | 688,596 |
| Events in quadrant D | 14,775,458 | 493,880 |
| Mode SS | |||
|---|---|---|---|
| Quadrant | BADHDUFLAG | Total packets | Discarded packets |
| A | 0 | 140 | 0 |
| B | 0 | 140 | 0 |
| C | 0 | 138 | 0 |
| D | 0 | 138 | 0 |
| Mode M0 | |||
|---|---|---|---|
| Quadrant | BADHDUFLAG | Total packets | Discarded packets |
| A | 0 | 14067 | 2 |
| B | 0 | 14253 | 2 |
| C | 0 | 15622 | 2 |
| D | 0 | 48579 | 2 |
| Quadrant | Total seconds | Saturated seconds | Saturation percentage |
|---|---|---|---|
| A | 6831 | 152 | 2.225150% |
| B | 6832 | 177 | 2.590749% |
| C | 6832 | 212 | 3.103044% |
| D | 6831 | 4940 | 72.317377% |
Noise dominated data is calculated using 1-second bins in cleaned event files. If a bin has >2000 counts, and if more than 50% of those come from <1% of pixels, then it is considered to be noise-dominated and hence unusable.
| Quadrant | # 1 sec bins | Bins with >0 counts | Bins with >2000 counts | High rate bins dominated by noise | Noise dominated (total time) | Noise dominated (detector-on time) | Marked lightcurve |
|---|---|---|---|---|---|---|---|
| A | 6901 | 6834 | 0 | 0 | 0.00% | 0.00% |  |
| B | 6902 | 6835 | 3 | 3 | 0.04% | 0.04% |  |
| C | 6902 | 6835 | 8 | 8 | 0.12% | 0.12% |  |
| D | 6901 | 6834 | 4403 | 4403 | 63.80% | 64.43% |  |
Top three noisy pixels from each quadrant. If the there are fewer than three noisy pixels in the level2.evt file, extra rows are filled as -1
| Pixel properties | Quadrant properties | ||||||
|---|---|---|---|---|---|---|---|
| Quadrant | DetID | PixID | Counts | Sigma | Mean | Median | Sigma |
| A | 13 | 254 | 13846 | 77.42 | 829 | 807 | 168.4 |
| A | 5 | 98 | 11866 | 65.66 | 829 | 807 | 168.4 |
| A | 3 | 137 | 8131 | 43.48 | 829 | 807 | 168.4 |
| B | 5 | 172 | 26974 | 168.0 | 821 | 798 | 155.8 |
| B | 0 | 190 | 26139 | 162.64 | 821 | 798 | 155.8 |
| B | 12 | 111 | 19123 | 117.61 | 821 | 798 | 155.8 |
| C | 3 | 233 | 290292 | 1544.2 | 795 | 798 | 187.5 |
| C | 7 | 247 | 232836 | 1237.72 | 795 | 798 | 187.5 |
| C | 14 | 238 | 134520 | 713.29 | 795 | 798 | 187.5 |
| D | 8 | 195 | 6649619 | 45956.5 | 613 | 593 | 144.7 |
| D | 1 | 52 | 2803529 | 19373.23 | 613 | 593 | 144.7 |
| D | 12 | 33 | 2717956 | 18781.77 | 613 | 593 | 144.7 |
Histogram calculated using DETX and DETY for each event in the final _common_clean file
| Quadrant A |  |
 |
Quadrant B |
|---|---|---|---|
| Quadrant D |  |
 |
Quadrant C |
| Plot type | Count rate plots | Images |
|---|---|---|
| Comparison with Poisson distribution Blue bars denote a histogram of data divided into 1 sec bins. Red curve is a Poisson curve with rate = median count rate of data. |
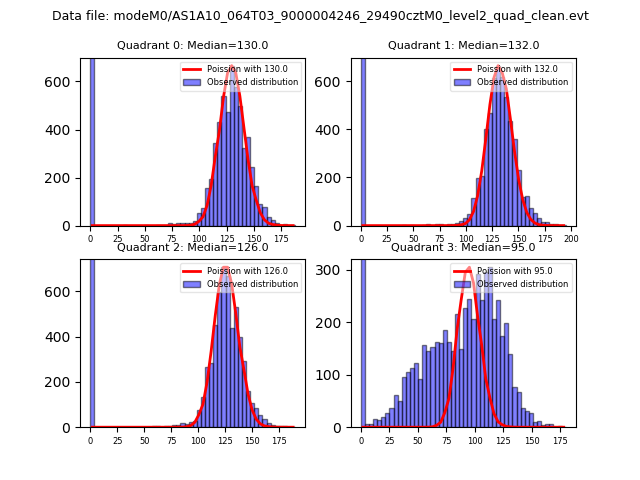 |
 |
| Quadrant-wise count rates Data is divided into 100 sec bins |
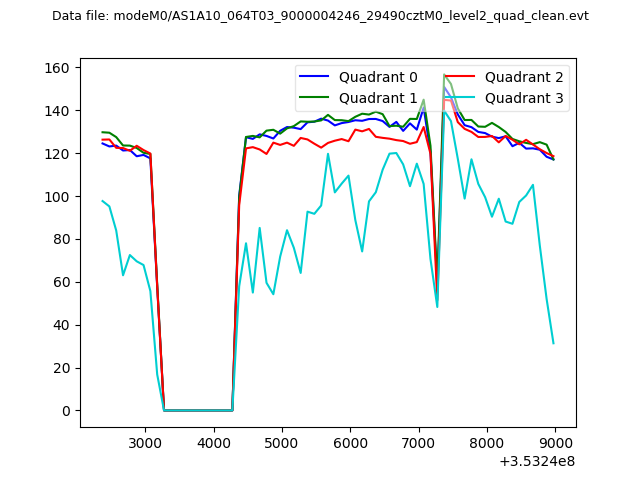 |
|
| Module-wise count rates for Quadrant A Data is divided into 100 sec bins |
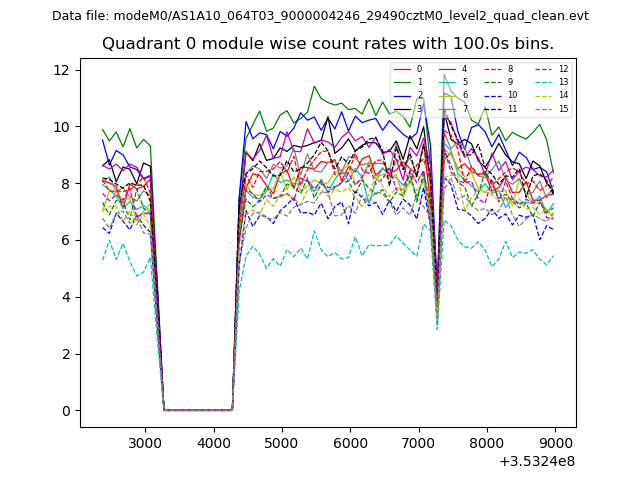 |
 |
| Module-wise count rates for Quadrant B Data is divided into 100 sec bins |
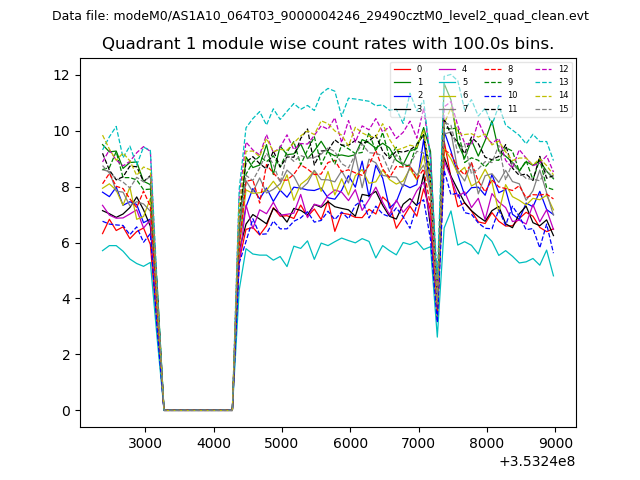 |
 |
| Module-wise count rates for Quadrant C Data is divided into 100 sec bins |
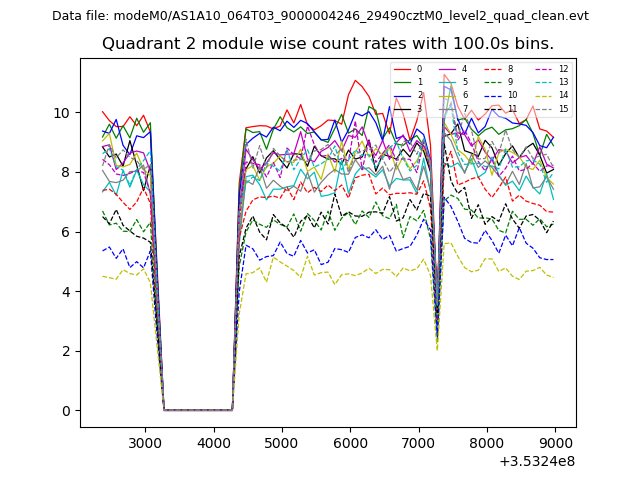 |
 |
| Module-wise count rates for Quadrant D Data is divided into 100 sec bins |
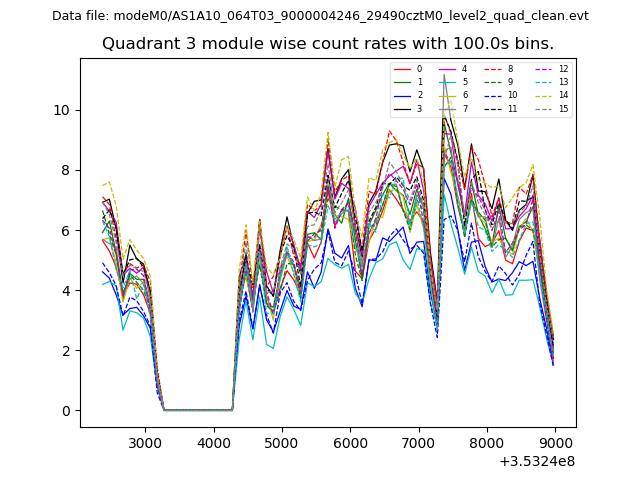 |
 |
| Parameter | Plot |
|---|---|
| CZT HV Monitor | 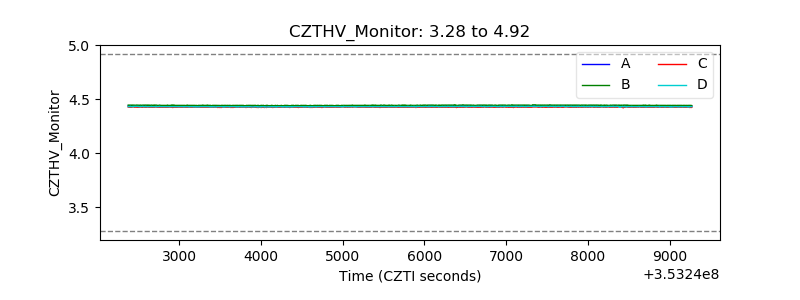 |
| D_VDD |  |
| Temperature 1 |  |
| Veto HV Monitor |  |
| Veto LLD |  |
| Alpha Counter | 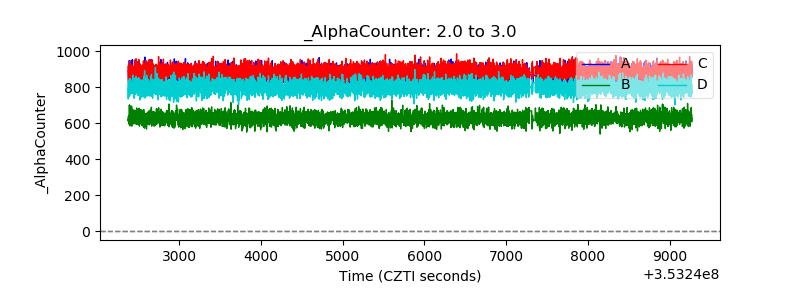 |
| _CPM_Rate | 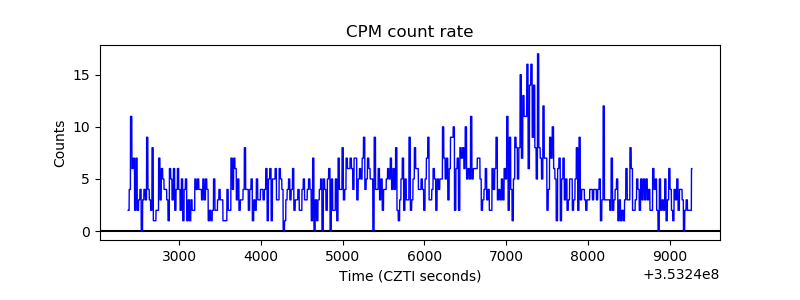 |
| CZT Counter |  |
| +2.5 Volts monitor |  |
| +5 Volts monitor |  |
| _ROLL_ROT | 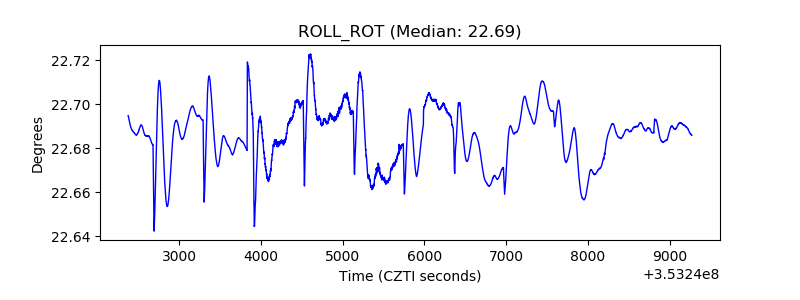 |
| _Roll_DEC | 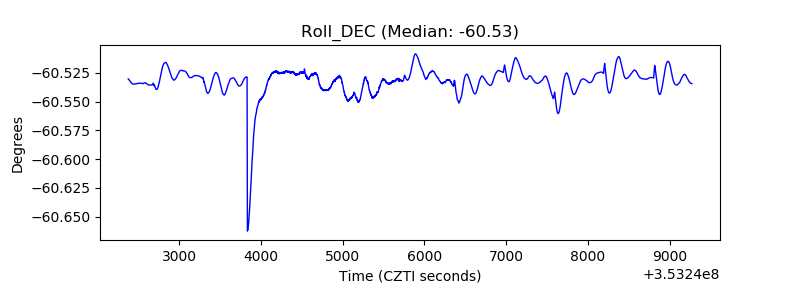 |
| _Roll_RA |  |
| Veto Counter | 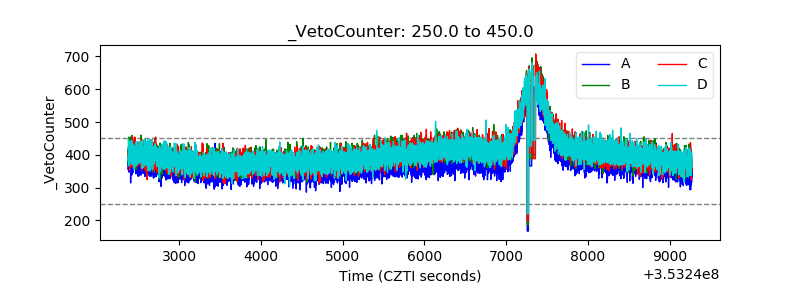 |