| Param | Original file | Final file |
|---|---|---|
| Filename | modeM0/AS1A10_064T03_9000004246_29491cztM0_level2.evt | modeM0/AS1A10_064T03_9000004246_29491cztM0_level2_quad_clean.evt |
| Size (bytes) | 822,481,920 | 102,009,600 |
| Size | 784.4 MB | 97.3 MB |
| Events in quadrant A | 3,321,623 | 696,378 |
| Events in quadrant B | 3,387,595 | 706,309 |
| Events in quadrant C | 3,544,047 | 677,712 |
| Events in quadrant D | 14,177,485 | 515,330 |
| Mode SS | |||
|---|---|---|---|
| Quadrant | BADHDUFLAG | Total packets | Discarded packets |
| A | 0 | 144 | 0 |
| B | 0 | 144 | 0 |
| C | 0 | 144 | 0 |
| D | 0 | 144 | 0 |
| Mode M0 | |||
|---|---|---|---|
| Quadrant | BADHDUFLAG | Total packets | Discarded packets |
| A | 0 | 14528 | 1 |
| B | 0 | 14639 | 1 |
| C | 0 | 14812 | 1 |
| D | 0 | 46921 | 6 |
| Mode M9 | |||
|---|---|---|---|
| Quadrant | BADHDUFLAG | Total packets | Discarded packets |
| A | 0 | 2 | 0 |
| B | 0 | 2 | 0 |
| C | 0 | 2 | 0 |
| D | 0 | 2 | 0 |
| Quadrant | Total seconds | Saturated seconds | Saturation percentage |
|---|---|---|---|
| A | 7064 | 132 | 1.868630% |
| B | 7064 | 156 | 2.208381% |
| C | 7064 | 225 | 3.185164% |
| D | 7063 | 4359 | 61.715985% |
Noise dominated data is calculated using 1-second bins in cleaned event files. If a bin has >2000 counts, and if more than 50% of those come from <1% of pixels, then it is considered to be noise-dominated and hence unusable.
| Quadrant | # 1 sec bins | Bins with >0 counts | Bins with >2000 counts | High rate bins dominated by noise | Noise dominated (total time) | Noise dominated (detector-on time) | Marked lightcurve |
|---|---|---|---|---|---|---|---|
| A | 7274 | 7065 | 1 | 1 | 0.01% | 0.01% | 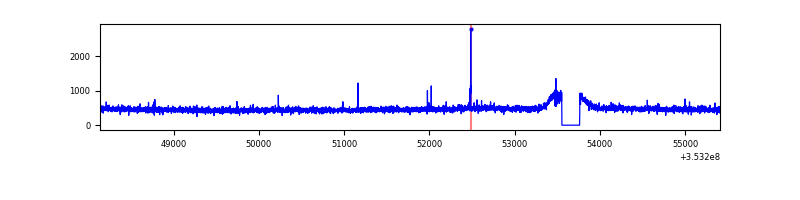 |
| B | 7274 | 7065 | 0 | 0 | 0.00% | 0.00% | 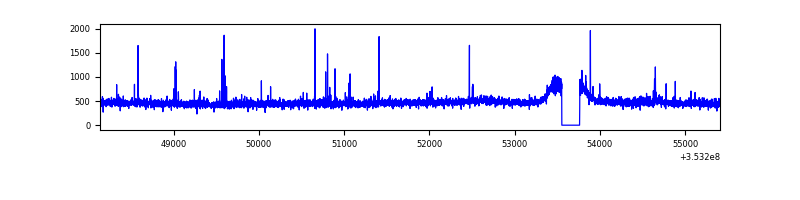 |
| C | 7274 | 7065 | 4 | 4 | 0.05% | 0.06% | 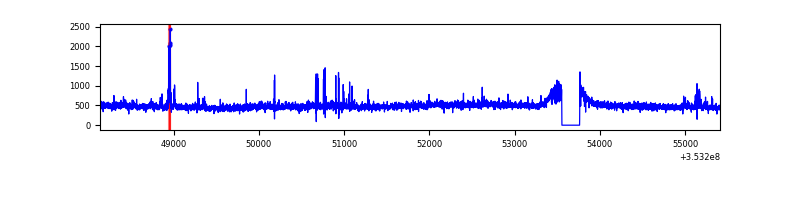 |
| D | 7273 | 7064 | 3932 | 3932 | 54.06% | 55.66% | 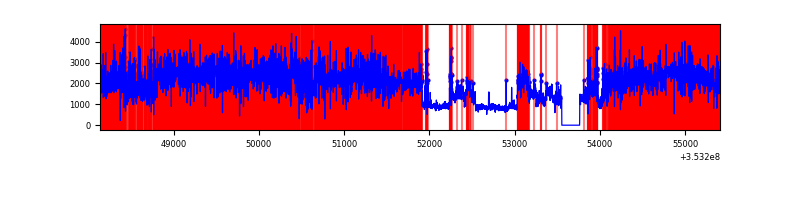 |
Top three noisy pixels from each quadrant. If the there are fewer than three noisy pixels in the level2.evt file, extra rows are filled as -1
| Pixel properties | Quadrant properties | ||||||
|---|---|---|---|---|---|---|---|
| Quadrant | DetID | PixID | Counts | Sigma | Mean | Median | Sigma |
| A | 13 | 254 | 14094 | 76.18 | 855 | 834 | 174.1 |
| A | 15 | 174 | 10834 | 57.45 | 855 | 834 | 174.1 |
| A | 3 | 137 | 8368 | 43.28 | 855 | 834 | 174.1 |
| B | 0 | 190 | 20157 | 118.97 | 844 | 821 | 162.5 |
| B | 12 | 111 | 19574 | 115.39 | 844 | 821 | 162.5 |
| B | 5 | 255 | 19488 | 114.86 | 844 | 821 | 162.5 |
| C | 14 | 238 | 155872 | 808.54 | 815 | 818 | 191.8 |
| C | 3 | 233 | 118469 | 613.5 | 815 | 818 | 191.8 |
| C | 7 | 247 | 45116 | 231.0 | 815 | 818 | 191.8 |
| D | 8 | 195 | 7078456 | 45035.98 | 664 | 645 | 157.2 |
| D | 1 | 52 | 2273047 | 14459.25 | 664 | 645 | 157.2 |
| D | 12 | 33 | 1897257 | 12068.11 | 664 | 645 | 157.2 |
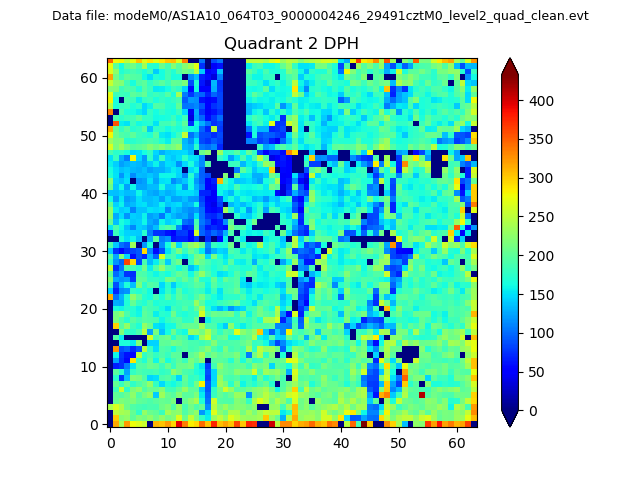
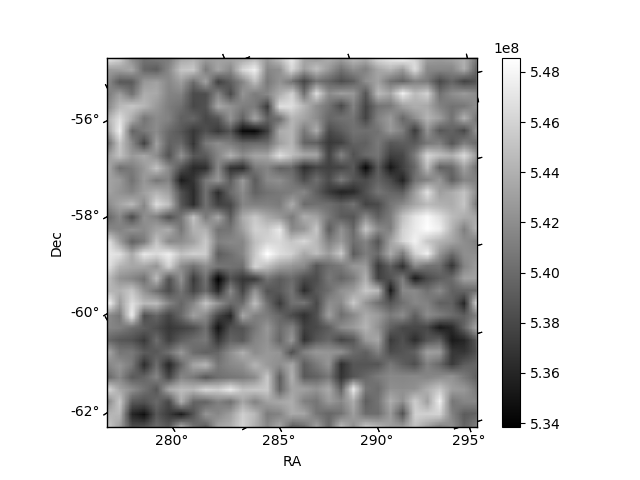
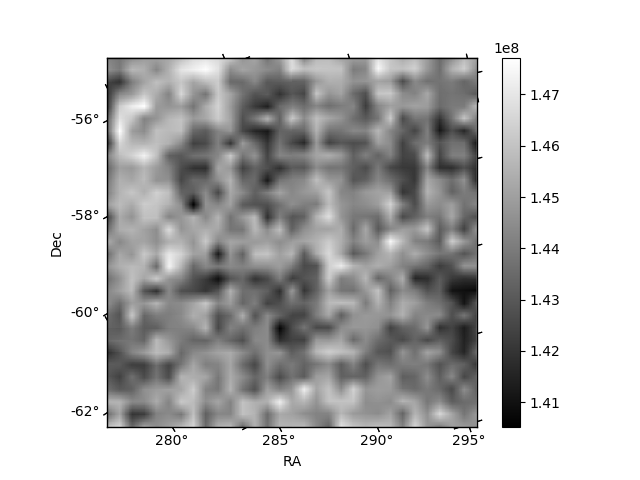
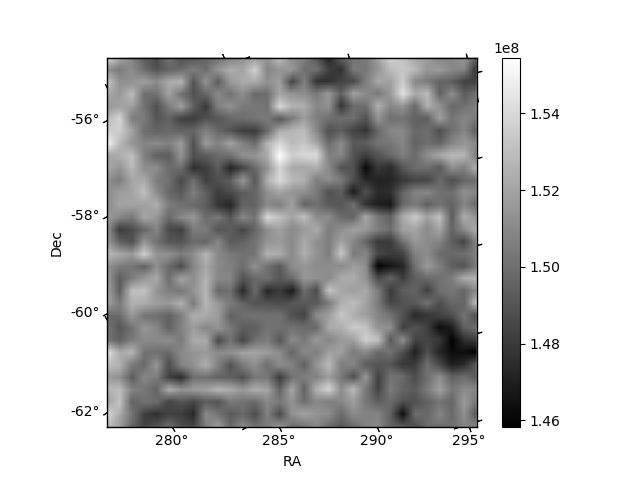
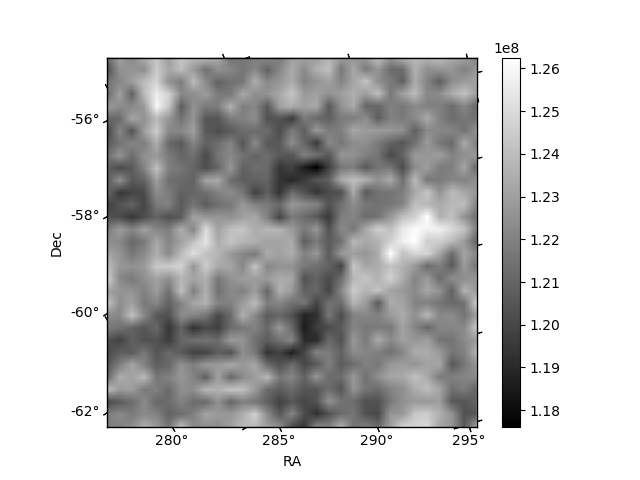
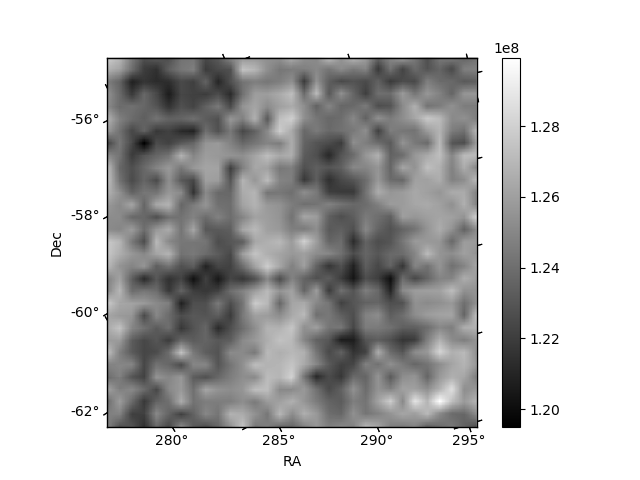
Histogram calculated using DETX and DETY for each event in the final _common_clean file
| Quadrant A | 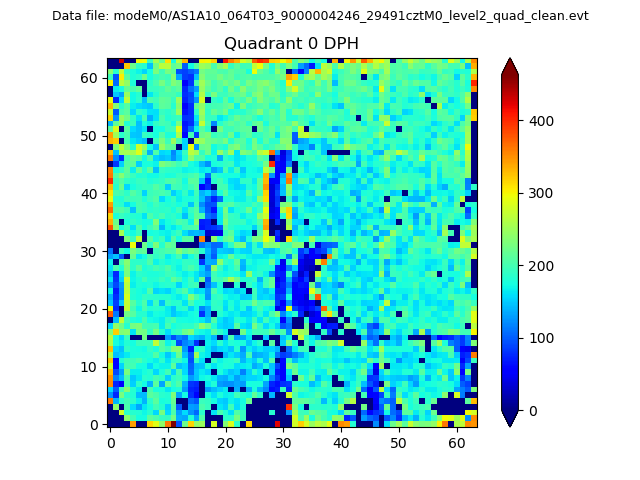 |
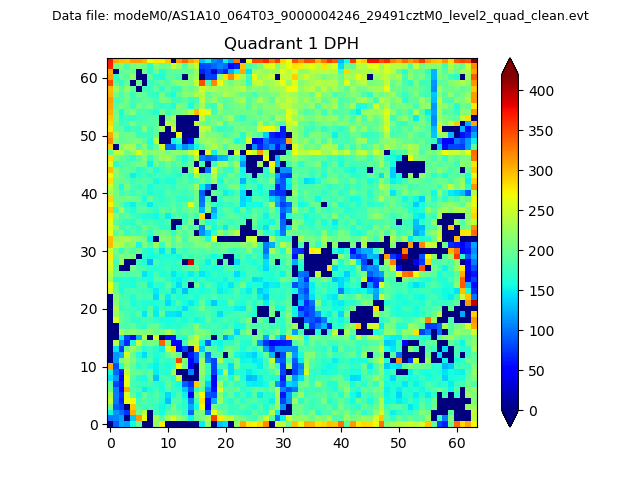 |
Quadrant B |
|---|---|---|---|
| Quadrant D | 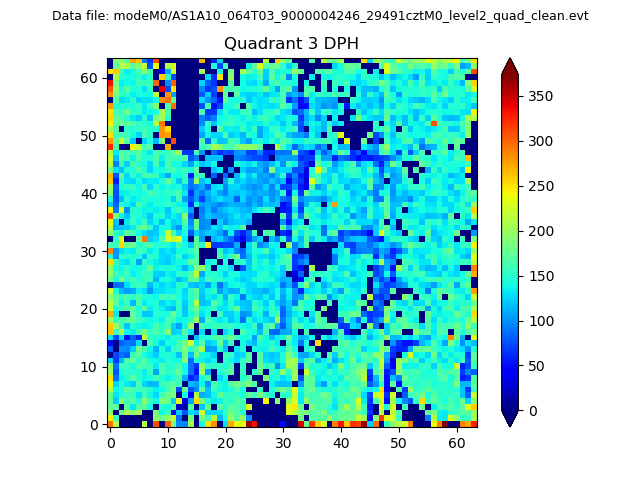 |
 |
Quadrant C |
| Plot type | Count rate plots | Images |
|---|---|---|
| Comparison with Poisson distribution Blue bars denote a histogram of data divided into 1 sec bins. Red curve is a Poisson curve with rate = median count rate of data. |
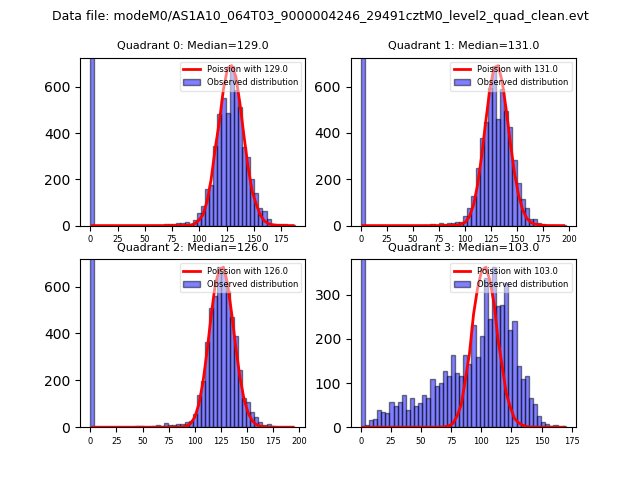 |
 |
| Quadrant-wise count rates Data is divided into 100 sec bins |
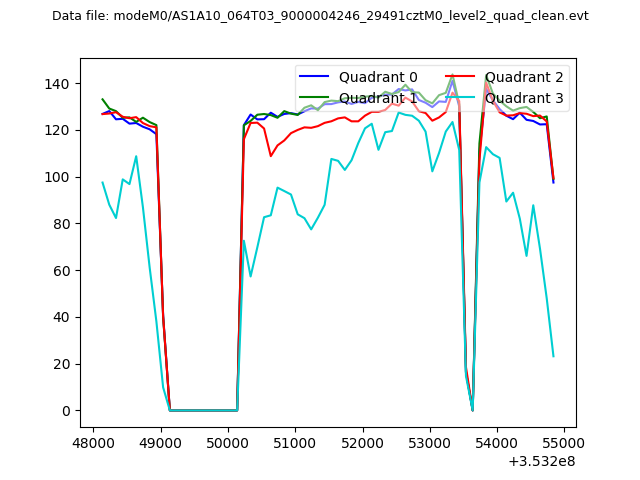 |
|
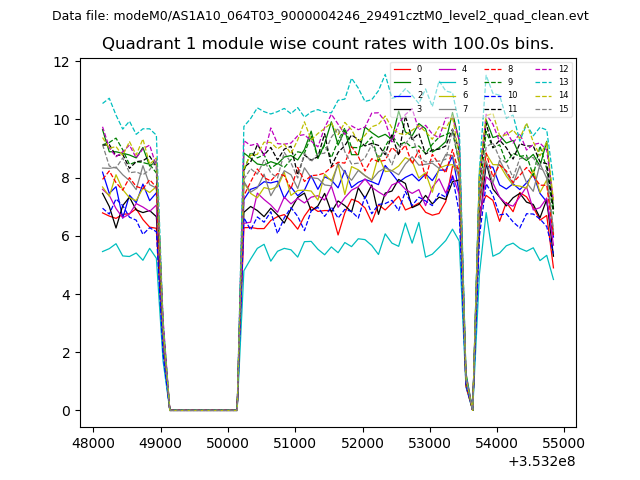
| Module-wise count rates for Quadrant A Data is divided into 100 sec bins |
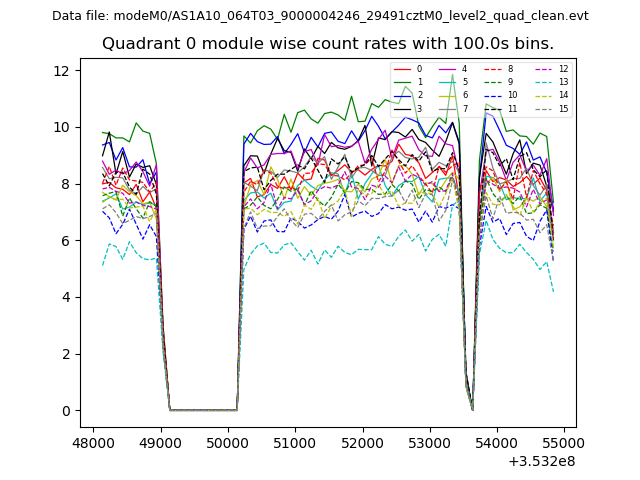 |
 |
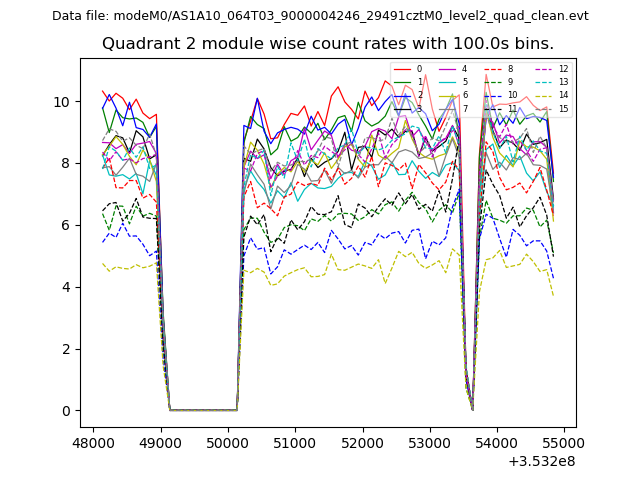
| Module-wise count rates for Quadrant B Data is divided into 100 sec bins |
 |
 |
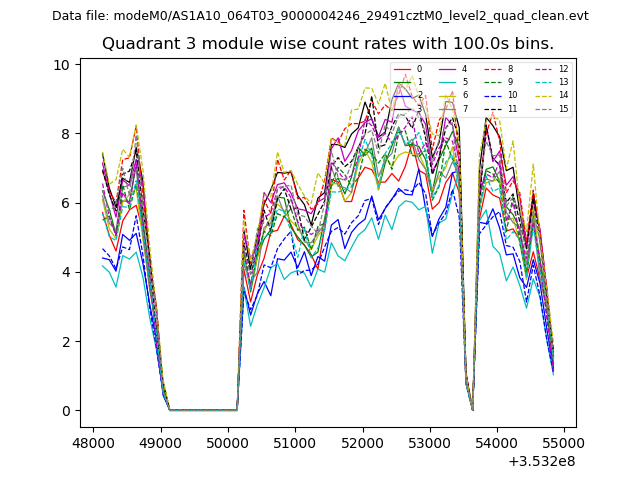
| Module-wise count rates for Quadrant C Data is divided into 100 sec bins |
 |
 |
| Module-wise count rates for Quadrant D Data is divided into 100 sec bins |
 |
 |
| Parameter | Plot |
|---|---|
| CZT HV Monitor | 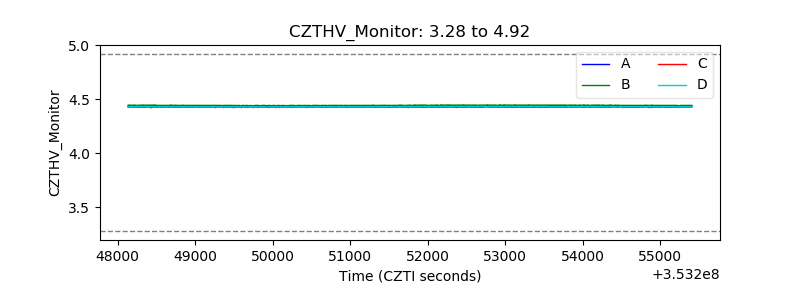 |
| D_VDD | 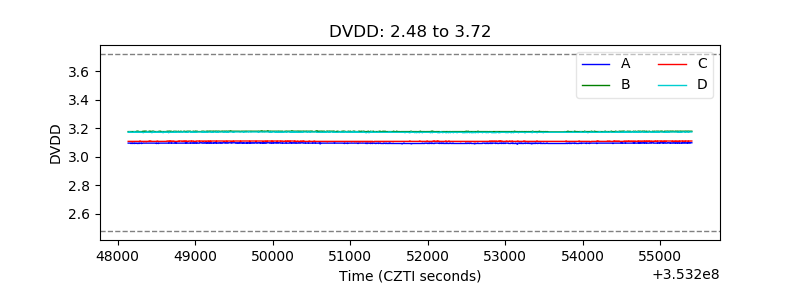 |
| Temperature 1 | 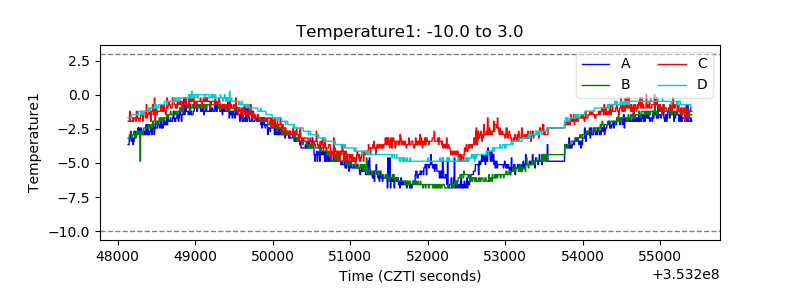 |
| Veto HV Monitor | 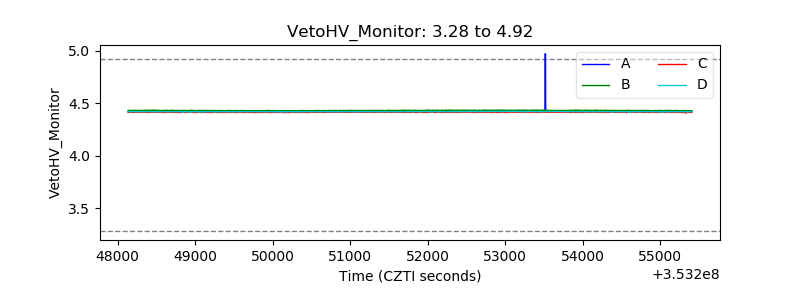 |
| Veto LLD | 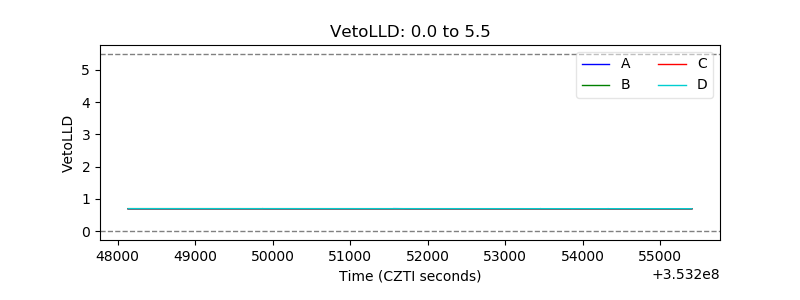 |
| Alpha Counter | 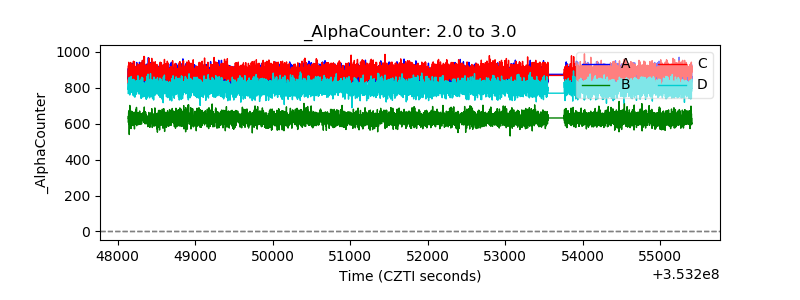 |
| _CPM_Rate | 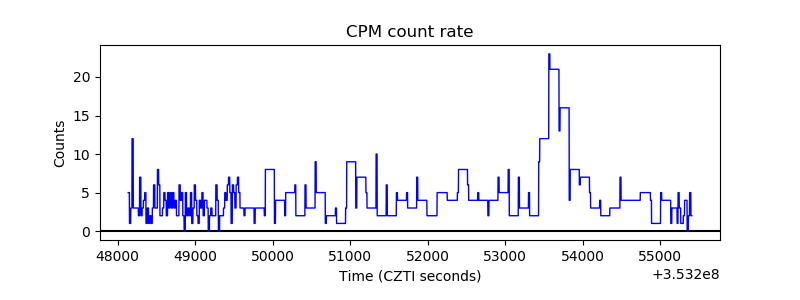 |
| CZT Counter | 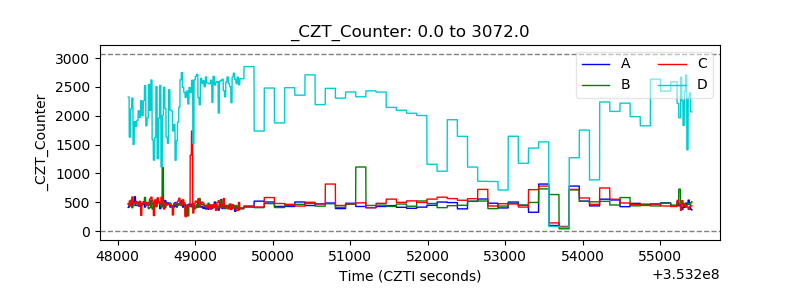 |
| +2.5 Volts monitor |  |
| +5 Volts monitor |  |
| _ROLL_ROT | 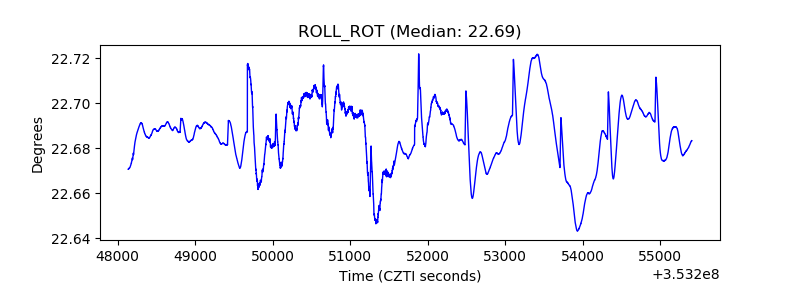 |
| _Roll_DEC | 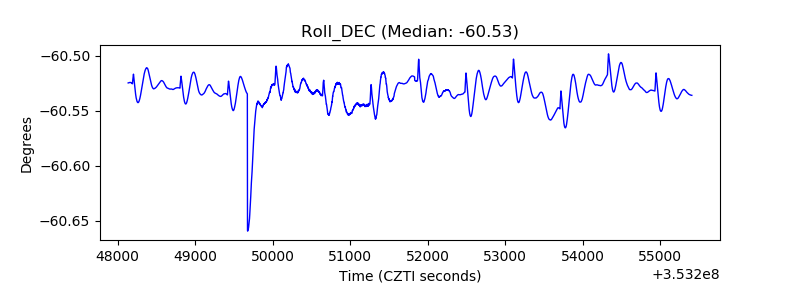 |
| _Roll_RA | 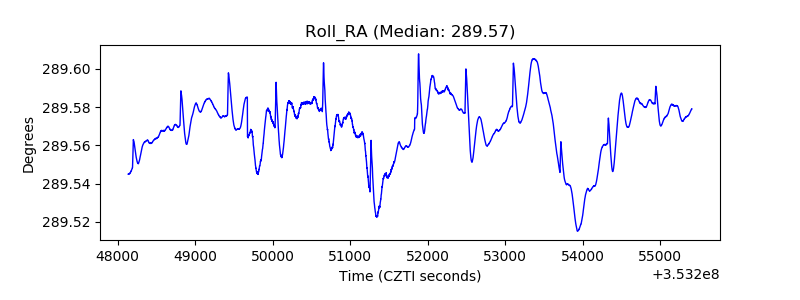 |
| Veto Counter | 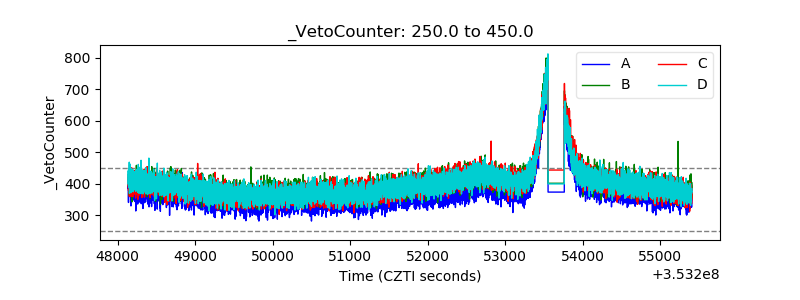 |