| Param | Original file | Final file |
|---|---|---|
| Filename | modeM0/AS1A10_064T03_9000004246_29493cztM0_level2.evt | modeM0/AS1A10_064T03_9000004246_29493cztM0_level2_quad_clean.evt |
| Size (bytes) | 609,140,160 | 71,009,280 |
| Size | 580.9 MB | 67.7 MB |
| Events in quadrant A | 2,279,299 | 492,627 |
| Events in quadrant B | 2,332,024 | 498,250 |
| Events in quadrant C | 2,636,835 | 469,308 |
| Events in quadrant D | 10,860,566 | 338,186 |
| Mode SS | |||
|---|---|---|---|
| Quadrant | BADHDUFLAG | Total packets | Discarded packets |
| A | 0 | 102 | 0 |
| B | 0 | 102 | 0 |
| C | 0 | 102 | 0 |
| D | 0 | 102 | 0 |
| Mode M0 | |||
|---|---|---|---|
| Quadrant | BADHDUFLAG | Total packets | Discarded packets |
| A | 0 | 10148 | 0 |
| B | 0 | 10195 | 0 |
| C | 0 | 11156 | 0 |
| D | 0 | 35682 | 0 |
| Mode M9 | |||
|---|---|---|---|
| Quadrant | BADHDUFLAG | Total packets | Discarded packets |
| A | 0 | 2 | 0 |
| B | 0 | 2 | 0 |
| C | 0 | 2 | 0 |
| D | 0 | 2 | 0 |
| Quadrant | Total seconds | Saturated seconds | Saturation percentage |
|---|---|---|---|
| A | 4998 | 47 | 0.940376% |
| B | 4999 | 53 | 1.060212% |
| C | 4999 | 137 | 2.740548% |
| D | 4999 | 3524 | 70.494099% |
Noise dominated data is calculated using 1-second bins in cleaned event files. If a bin has >2000 counts, and if more than 50% of those come from <1% of pixels, then it is considered to be noise-dominated and hence unusable.
| Quadrant | # 1 sec bins | Bins with >0 counts | Bins with >2000 counts | High rate bins dominated by noise | Noise dominated (total time) | Noise dominated (detector-on time) | Marked lightcurve |
|---|---|---|---|---|---|---|---|
| A | 4998 | 4998 | 0 | 0 | 0.00% | 0.00% | 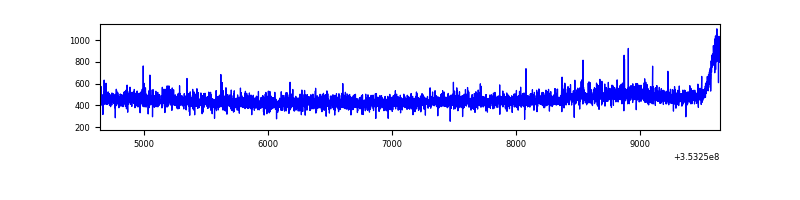 |
| B | 4999 | 4999 | 0 | 0 | 0.00% | 0.00% | 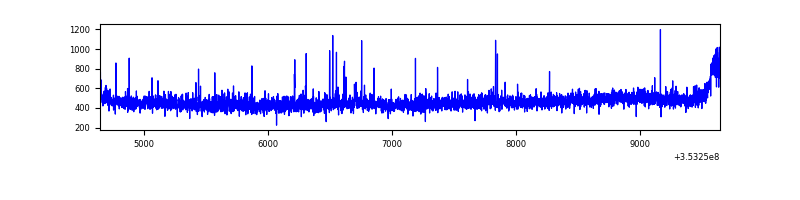 |
| C | 4999 | 4999 | 3 | 3 | 0.06% | 0.06% | 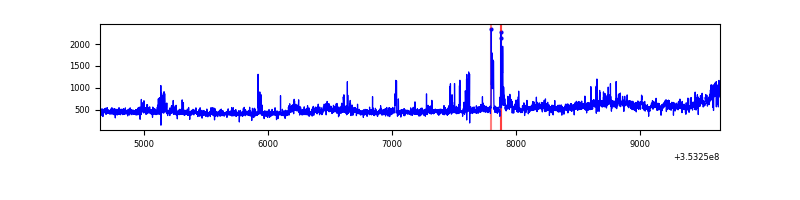 |
| D | 4999 | 4999 | 3293 | 3293 | 65.87% | 65.87% | 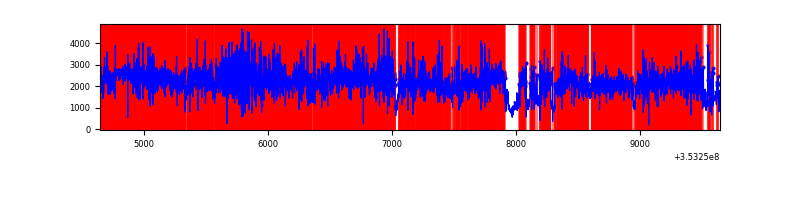 |
Top three noisy pixels from each quadrant. If the there are fewer than three noisy pixels in the level2.evt file, extra rows are filled as -1
| Pixel properties | Quadrant properties | ||||||
|---|---|---|---|---|---|---|---|
| Quadrant | DetID | PixID | Counts | Sigma | Mean | Median | Sigma |
| A | 13 | 254 | 9526 | 74.05 | 589 | 576 | 120.9 |
| A | 3 | 137 | 5635 | 41.86 | 589 | 576 | 120.9 |
| A | 0 | 226 | 4966 | 36.32 | 589 | 576 | 120.9 |
| B | 12 | 111 | 13753 | 116.33 | 584 | 568 | 113.3 |
| B | 11 | 111 | 12154 | 102.23 | 584 | 568 | 113.3 |
| B | 0 | 190 | 11192 | 93.74 | 584 | 568 | 113.3 |
| C | 3 | 233 | 203353 | 1531.36 | 562 | 565 | 132.4 |
| C | 14 | 238 | 116657 | 876.67 | 562 | 565 | 132.4 |
| C | 7 | 247 | 78981 | 592.16 | 562 | 565 | 132.4 |
| D | 8 | 195 | 4774091 | 44583.88 | 440 | 427 | 107.1 |
| D | 12 | 33 | 2118795 | 19784.61 | 440 | 427 | 107.1 |
| D | 1 | 52 | 1232443 | 11506.48 | 440 | 427 | 107.1 |
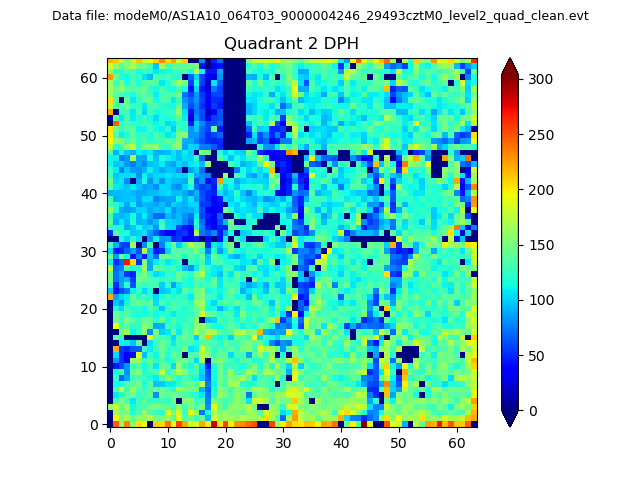
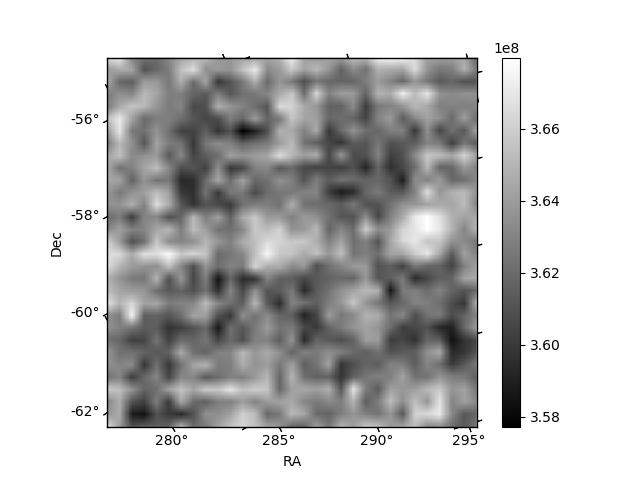
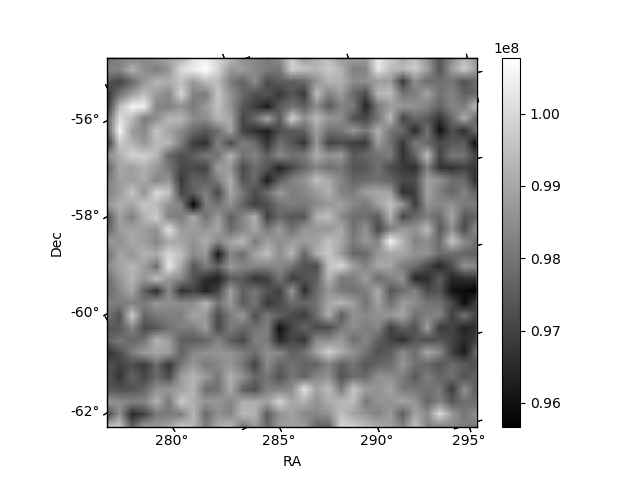
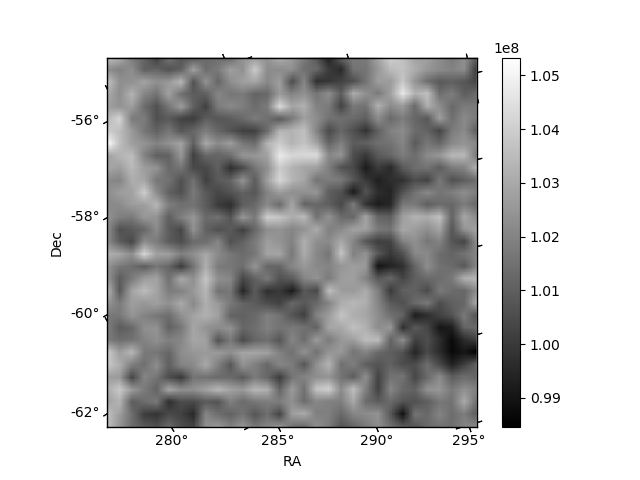
Histogram calculated using DETX and DETY for each event in the final _common_clean file
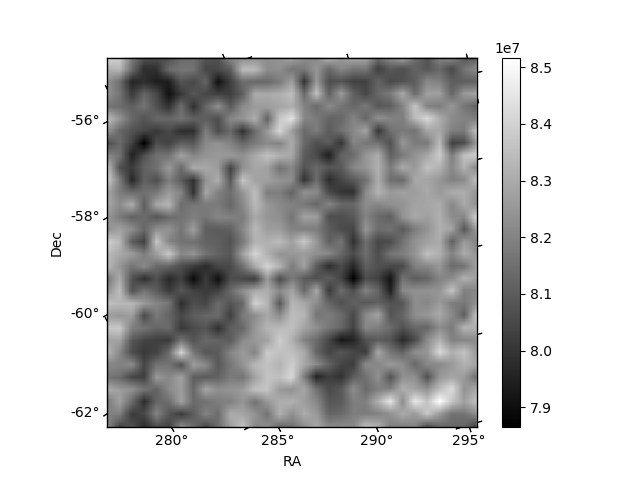
| Quadrant A | 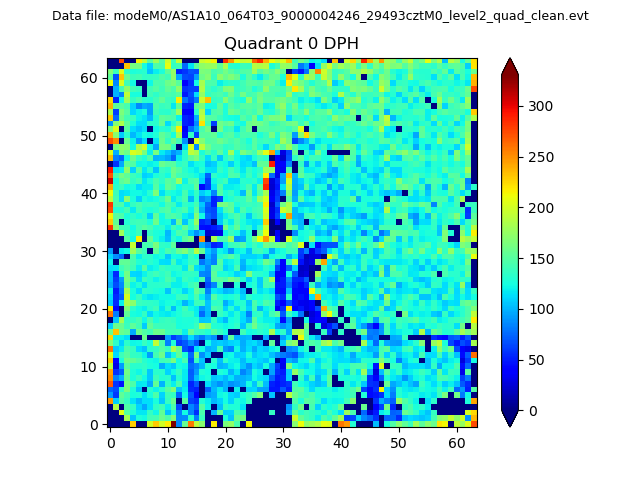 |
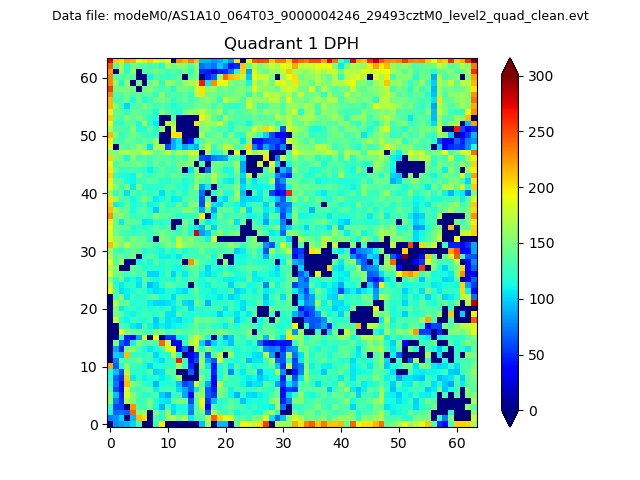 |
Quadrant B |
|---|---|---|---|
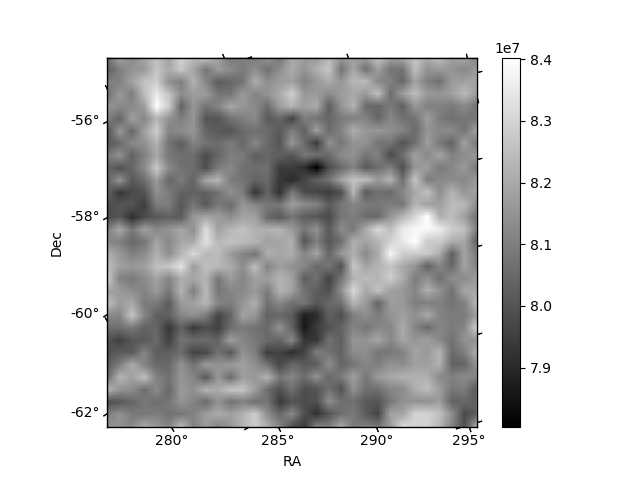
| Quadrant D | 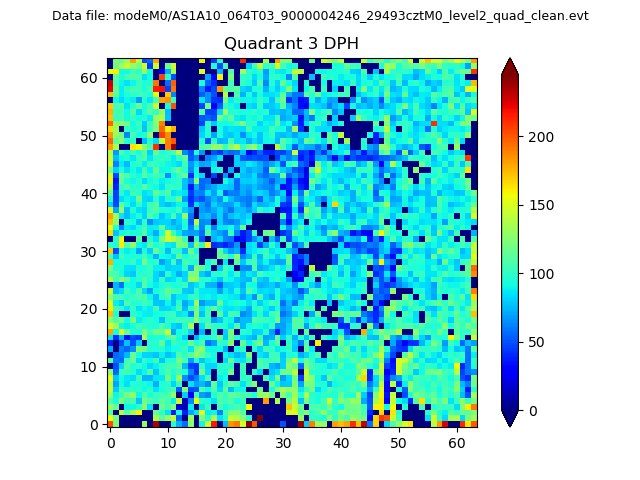 |
 |
Quadrant C |
| Plot type | Count rate plots | Images |
|---|---|---|
| Comparison with Poisson distribution Blue bars denote a histogram of data divided into 1 sec bins. Red curve is a Poisson curve with rate = median count rate of data. |
 |
 |
| Quadrant-wise count rates Data is divided into 100 sec bins |
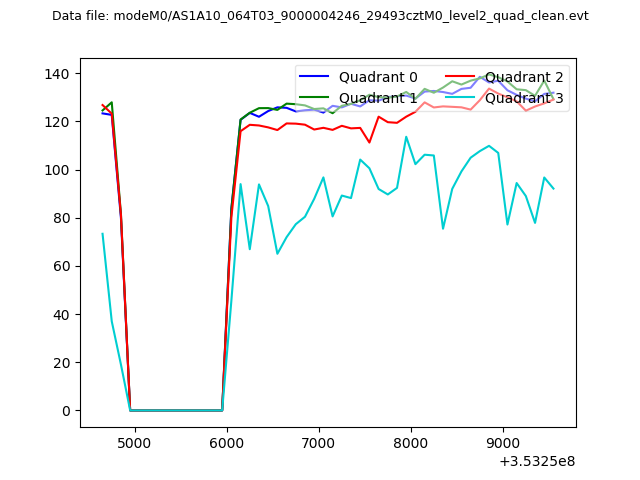 |
|
| Module-wise count rates for Quadrant A Data is divided into 100 sec bins |
 |
 |
| Module-wise count rates for Quadrant B Data is divided into 100 sec bins |
 |
 |
| Module-wise count rates for Quadrant C Data is divided into 100 sec bins |
 |
 |
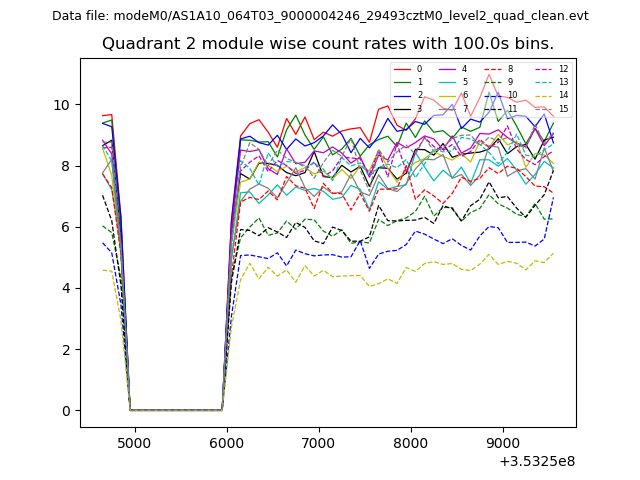
| Module-wise count rates for Quadrant D Data is divided into 100 sec bins |
 |
 |
| Parameter | Plot |
|---|---|
| CZT HV Monitor | 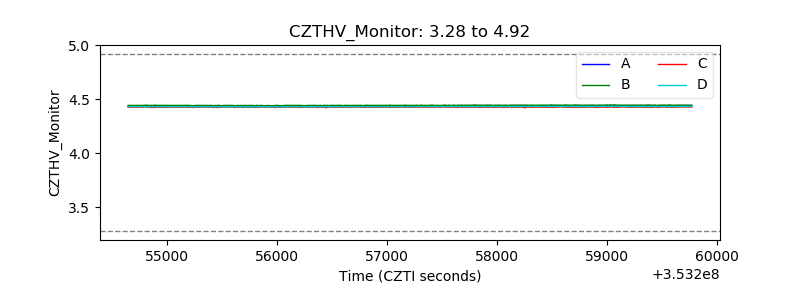 |
| D_VDD | 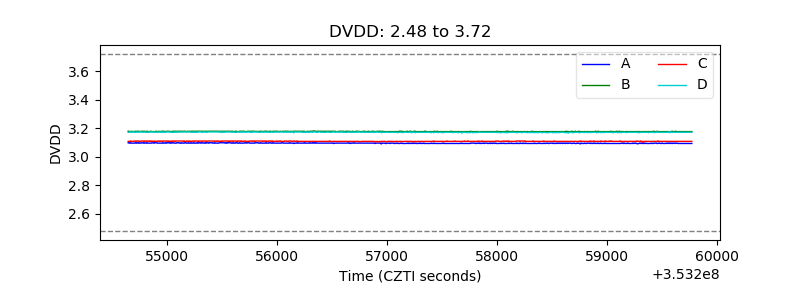 |
| Temperature 1 | 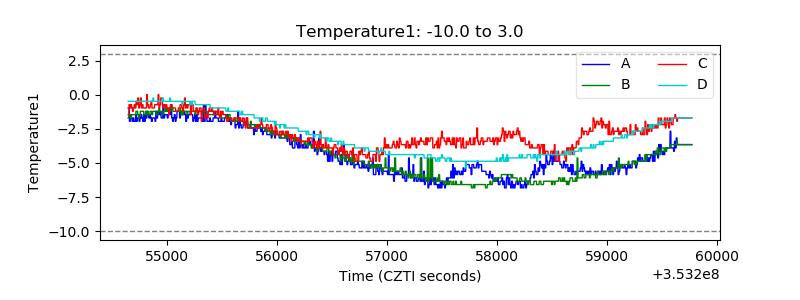 |
| Veto HV Monitor | 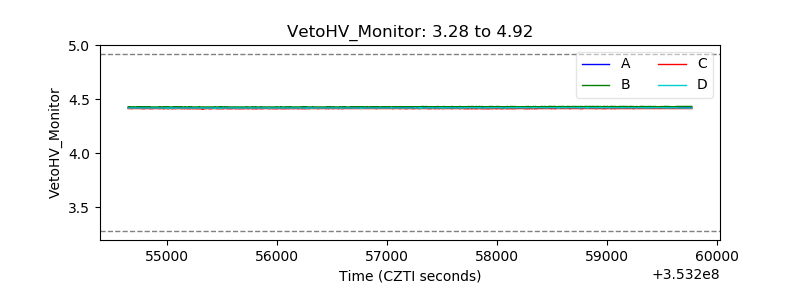 |
| Veto LLD | 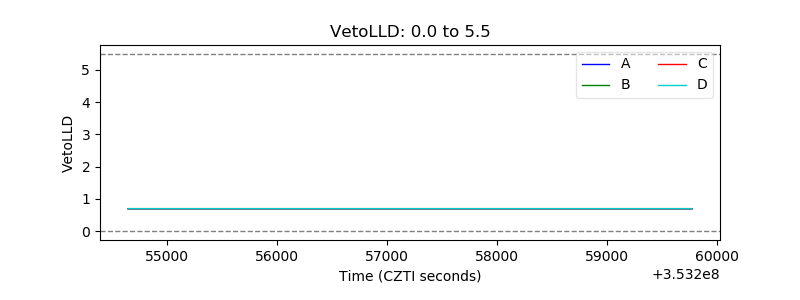 |
| Alpha Counter | 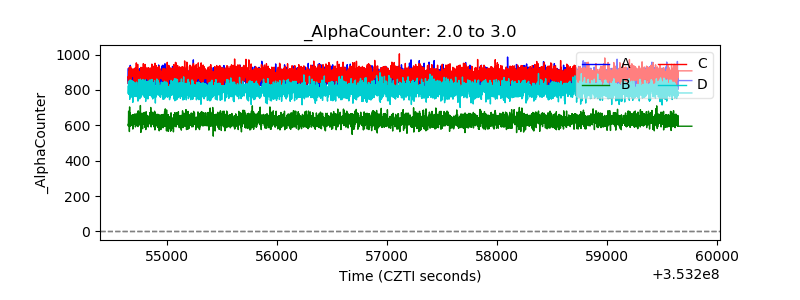 |
| _CPM_Rate | 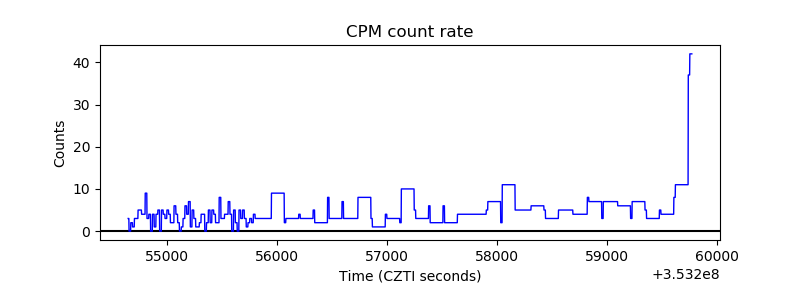 |
| CZT Counter | 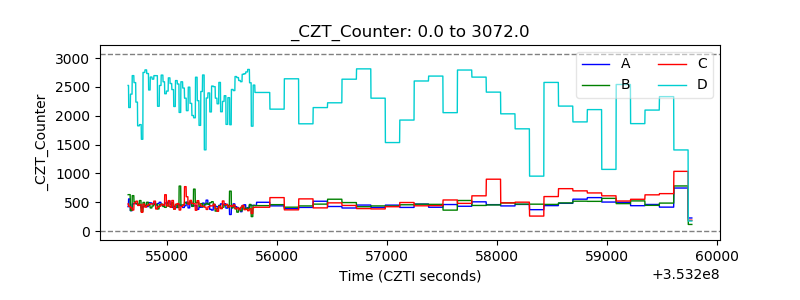 |
| +2.5 Volts monitor | 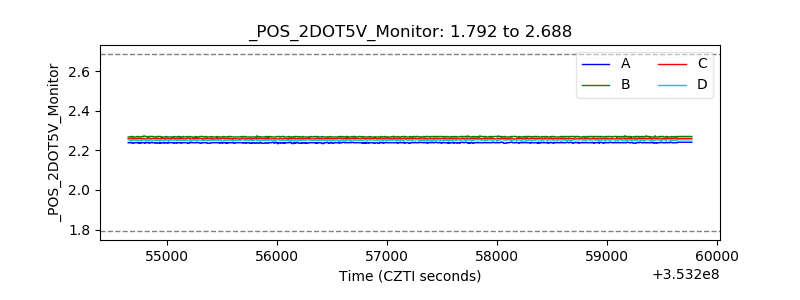 |
| +5 Volts monitor |  |
| _ROLL_ROT |  |
| _Roll_DEC |  |
| _Roll_RA | 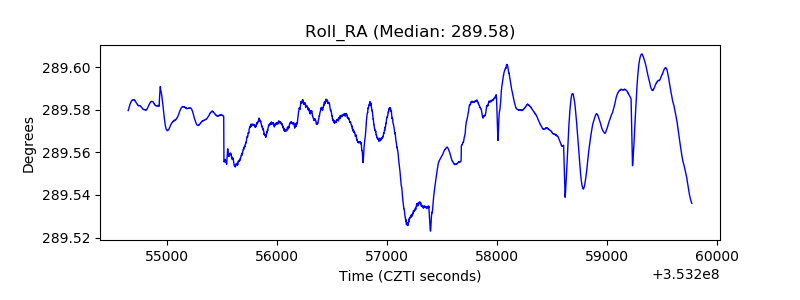 |
| Veto Counter | 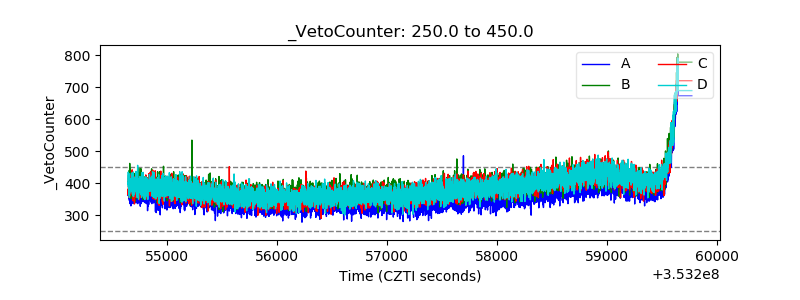 |