| Param | Original file | Final file |
|---|---|---|
| Filename | modeM0/AS1A10_064T03_9000004246_29494cztM0_level2.evt | modeM0/AS1A10_064T03_9000004246_29494cztM0_level2_quad_clean.evt |
| Size (bytes) | 1,523,465,280 | 173,450,880 |
| Size | 1.4 GB | 165.4 MB |
| Events in quadrant A | 5,852,620 | 1,201,899 |
| Events in quadrant B | 6,141,017 | 1,212,632 |
| Events in quadrant C | 7,212,268 | 1,128,947 |
| Events in quadrant D | 26,086,619 | 839,218 |
| Mode SS | |||
|---|---|---|---|
| Quadrant | BADHDUFLAG | Total packets | Discarded packets |
| A | 0 | 256 | 0 |
| B | 0 | 256 | 0 |
| C | 0 | 256 | 0 |
| D | 0 | 256 | 0 |
| Mode M0 | |||
|---|---|---|---|
| Quadrant | BADHDUFLAG | Total packets | Discarded packets |
| A | 0 | 25595 | 3 |
| B | 0 | 26334 | 3 |
| C | 0 | 29327 | 3 |
| D | 0 | 86134 | 10 |
| Mode M9 | |||
|---|---|---|---|
| Quadrant | BADHDUFLAG | Total packets | Discarded packets |
| A | 0 | 18 | 0 |
| B | 0 | 19 | 0 |
| C | 0 | 19 | 0 |
| D | 0 | 19 | 0 |
| Quadrant | Total seconds | Saturated seconds | Saturation percentage |
|---|---|---|---|
| A | 12556 | 69 | 0.549538% |
| B | 12556 | 112 | 0.892004% |
| C | 12556 | 516 | 4.109589% |
| D | 12555 | 7555 | 60.175229% |
Noise dominated data is calculated using 1-second bins in cleaned event files. If a bin has >2000 counts, and if more than 50% of those come from <1% of pixels, then it is considered to be noise-dominated and hence unusable.
| Quadrant | # 1 sec bins | Bins with >0 counts | Bins with >2000 counts | High rate bins dominated by noise | Noise dominated (total time) | Noise dominated (detector-on time) | Marked lightcurve |
|---|---|---|---|---|---|---|---|
| A | 14066 | 12558 | 0 | 0 | 0.00% | 0.00% | 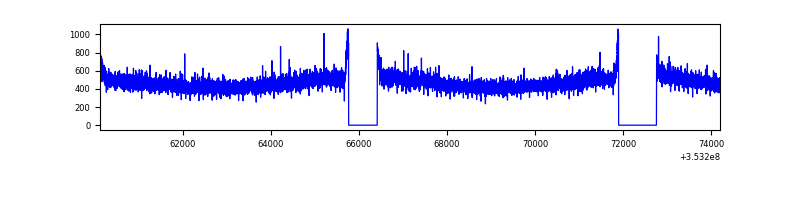 |
| B | 14066 | 12558 | 9 | 9 | 0.06% | 0.07% | 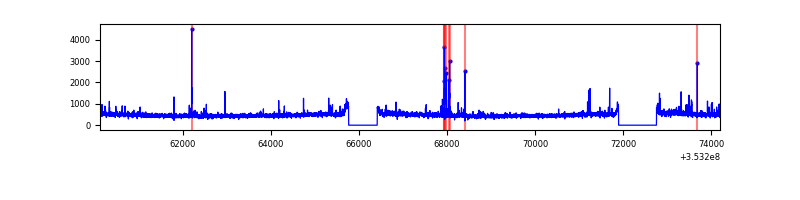 |
| C | 14066 | 12558 | 55 | 55 | 0.39% | 0.44% | 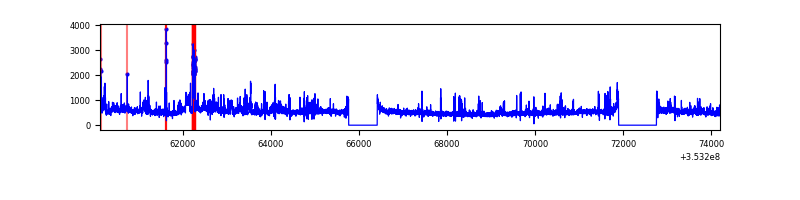 |
| D | 14065 | 12556 | 7016 | 7016 | 49.88% | 55.88% | 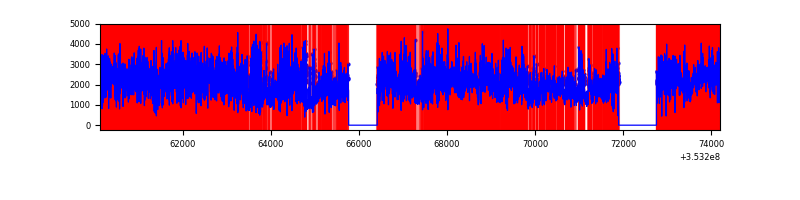 |
Top three noisy pixels from each quadrant. If the there are fewer than three noisy pixels in the level2.evt file, extra rows are filled as -1
| Pixel properties | Quadrant properties | ||||||
|---|---|---|---|---|---|---|---|
| Quadrant | DetID | PixID | Counts | Sigma | Mean | Median | Sigma |
| A | 13 | 254 | 24270 | 74.95 | 1510 | 1477 | 304.1 |
| A | 14 | 239 | 20710 | 63.24 | 1510 | 1477 | 304.1 |
| A | 3 | 137 | 14790 | 43.78 | 1510 | 1477 | 304.1 |
| B | 0 | 190 | 111426 | 384.98 | 1498 | 1459 | 285.6 |
| B | 5 | 172 | 55780 | 190.17 | 1498 | 1459 | 285.6 |
| B | 15 | 33 | 39739 | 134.01 | 1498 | 1459 | 285.6 |
| C | 3 | 233 | 991807 | 3020.57 | 1418 | 1429 | 327.9 |
| C | 14 | 238 | 334965 | 1017.26 | 1418 | 1429 | 327.9 |
| C | 7 | 247 | 179799 | 544.01 | 1418 | 1429 | 327.9 |
| D | 8 | 195 | 10964009 | 40331.04 | 1147 | 1115 | 271.8 |
| D | 12 | 33 | 4182053 | 15381.12 | 1147 | 1115 | 271.8 |
| D | 1 | 52 | 3664448 | 13476.92 | 1147 | 1115 | 271.8 |
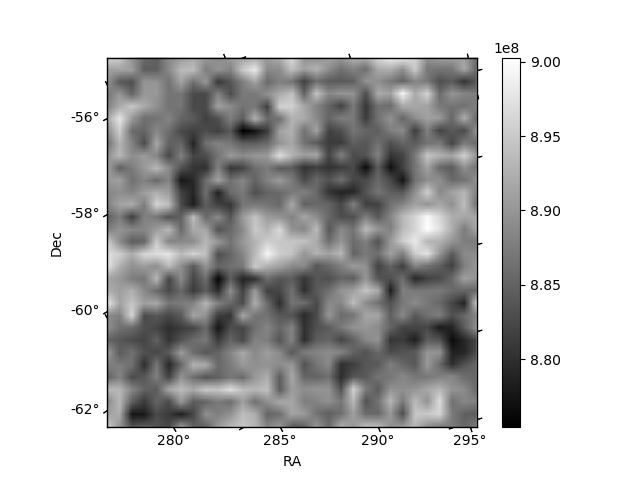
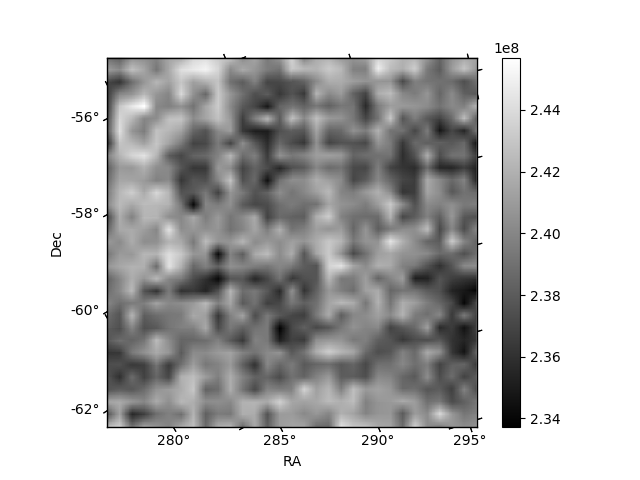
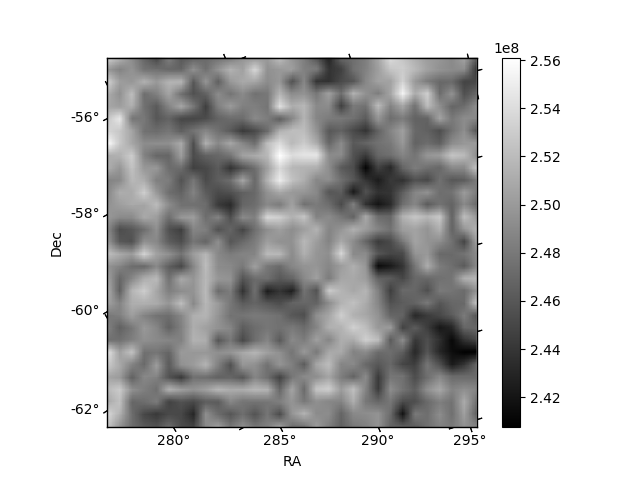
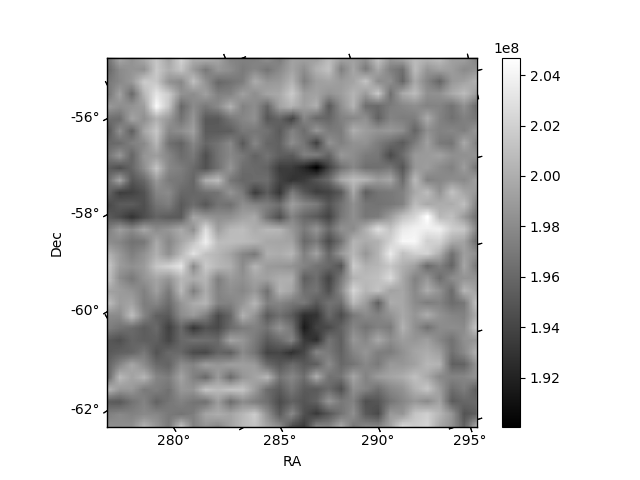
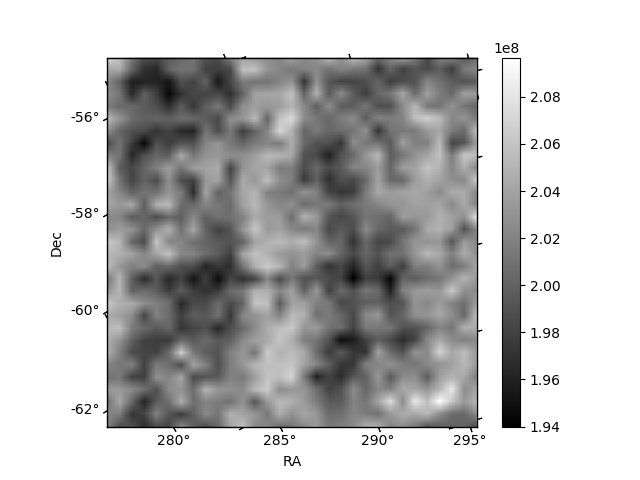
Histogram calculated using DETX and DETY for each event in the final _common_clean file
| Quadrant A | 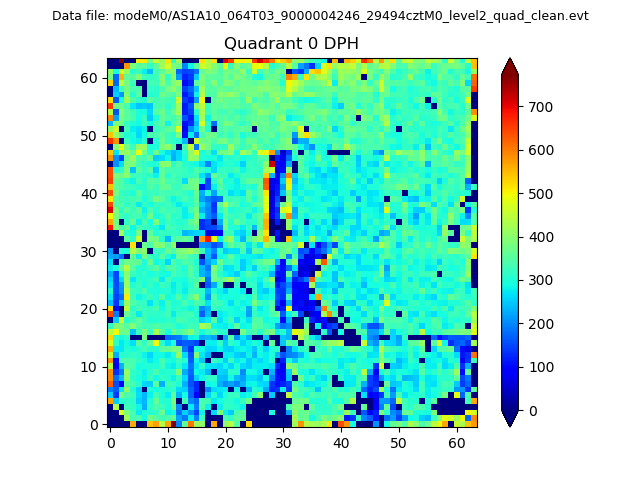 |
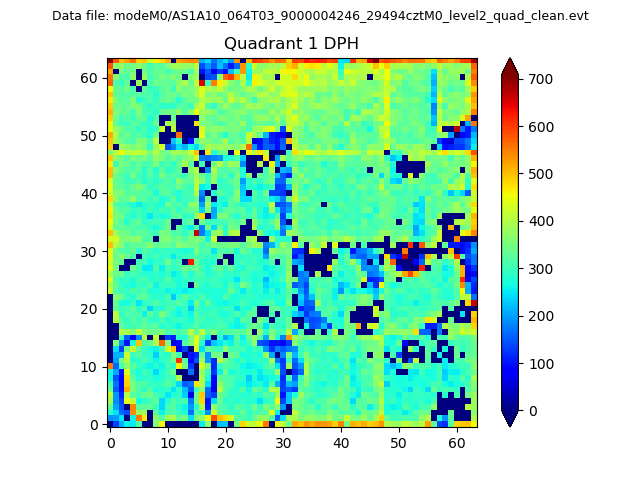 |
Quadrant B |
|---|---|---|---|
| Quadrant D |  |
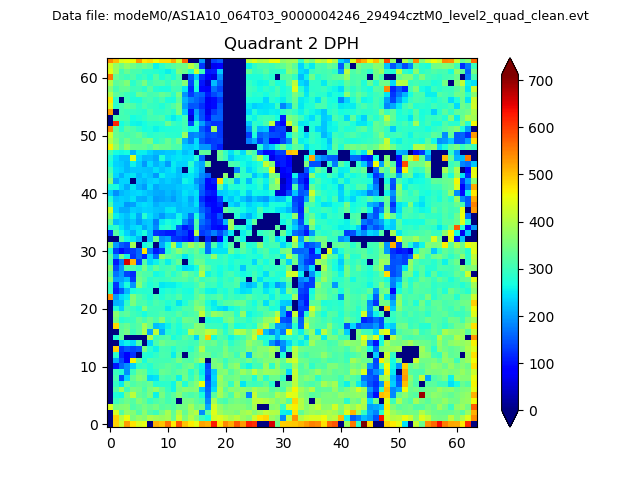 |
Quadrant C |
| Plot type | Count rate plots | Images |
|---|---|---|
| Comparison with Poisson distribution Blue bars denote a histogram of data divided into 1 sec bins. Red curve is a Poisson curve with rate = median count rate of data. |
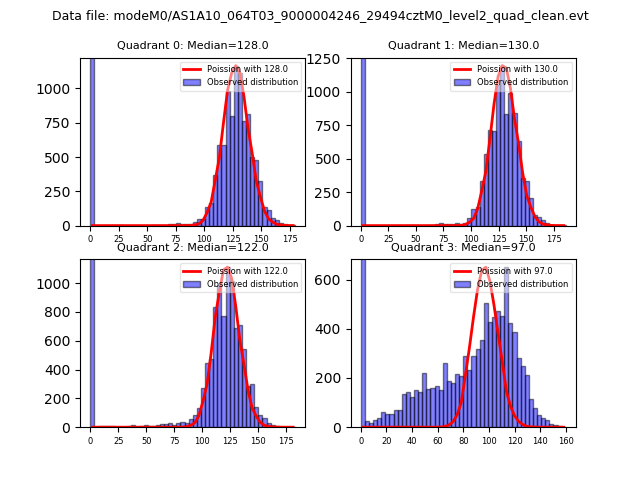 |
 |
| Quadrant-wise count rates Data is divided into 100 sec bins |
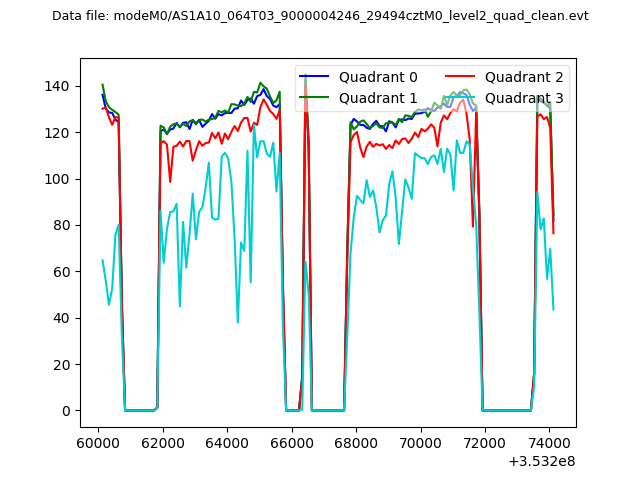 |
|
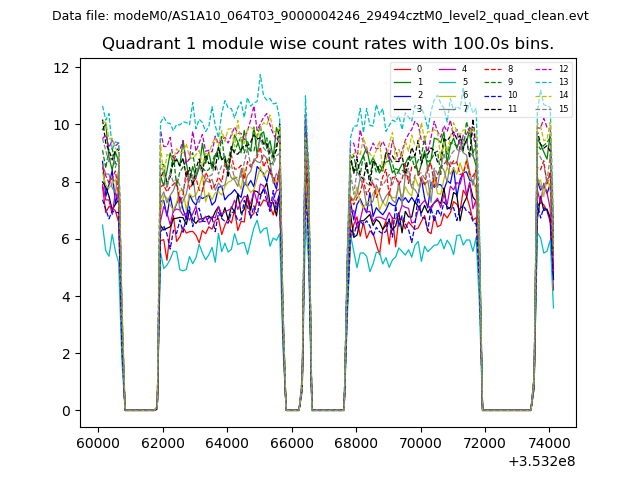
| Module-wise count rates for Quadrant A Data is divided into 100 sec bins |
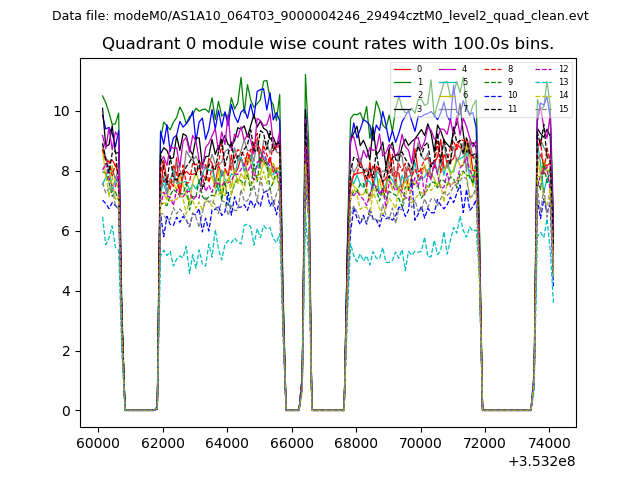 |
 |
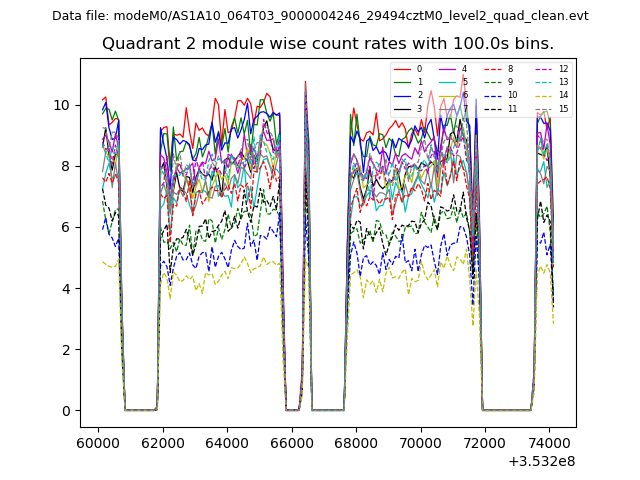
| Module-wise count rates for Quadrant B Data is divided into 100 sec bins |
 |
 |
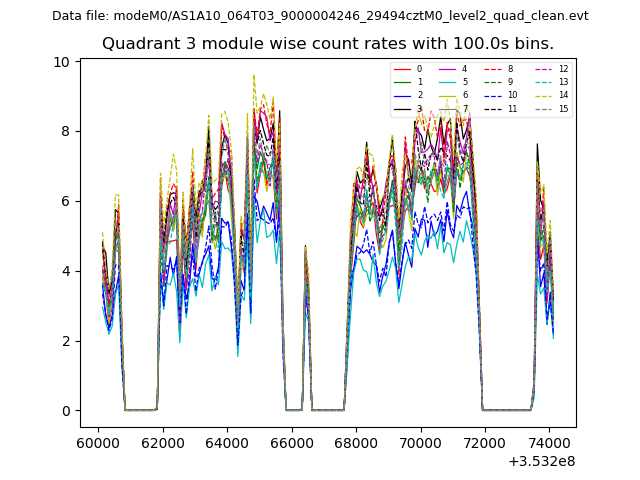
| Module-wise count rates for Quadrant C Data is divided into 100 sec bins |
 |
 |
| Module-wise count rates for Quadrant D Data is divided into 100 sec bins |
 |
 |
| Parameter | Plot |
|---|---|
| CZT HV Monitor | 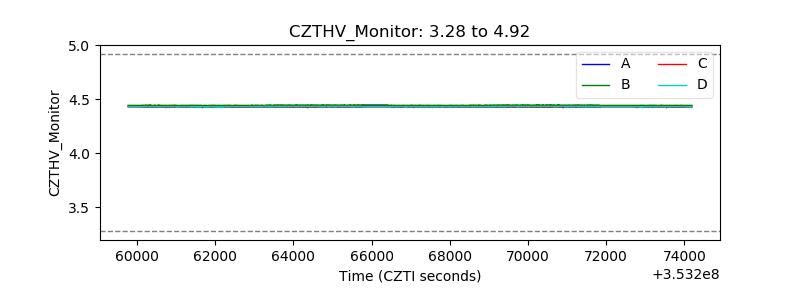 |
| D_VDD | 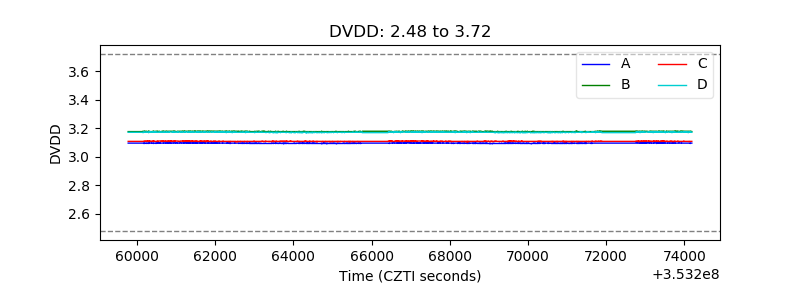 |
| Temperature 1 | 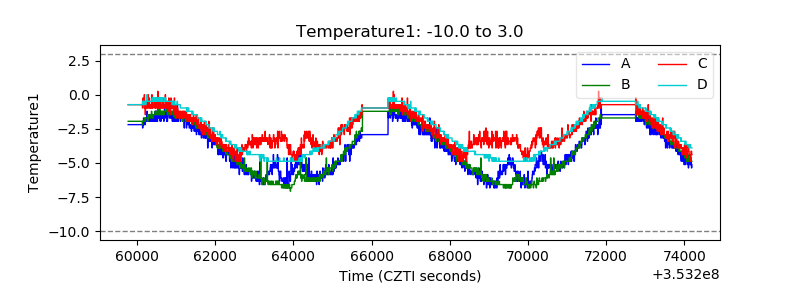 |
| Veto HV Monitor | 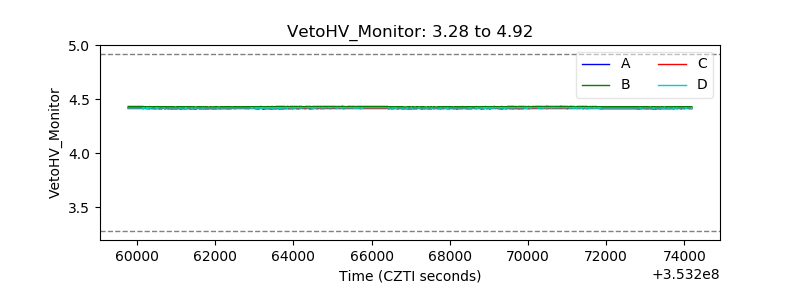 |
| Veto LLD |  |
| Alpha Counter | 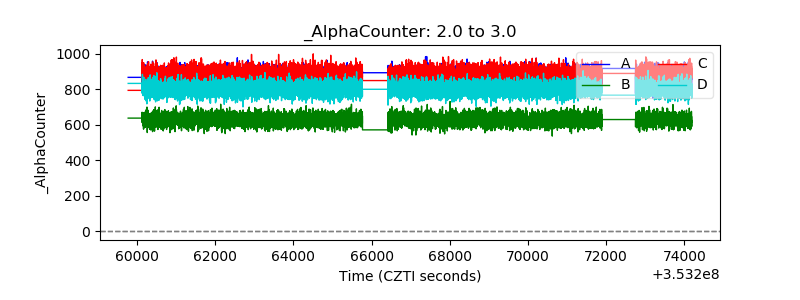 |
| _CPM_Rate | 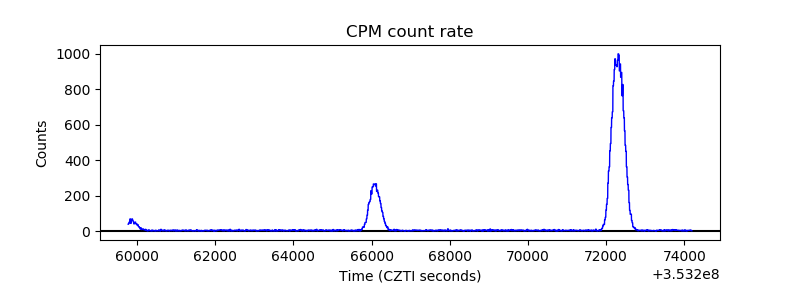 |
| CZT Counter | 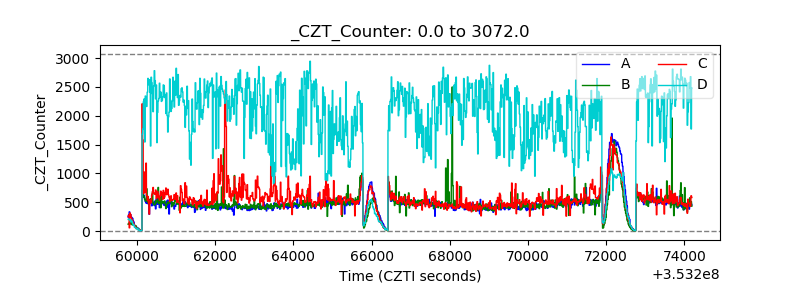 |
| +2.5 Volts monitor |  |
| +5 Volts monitor | 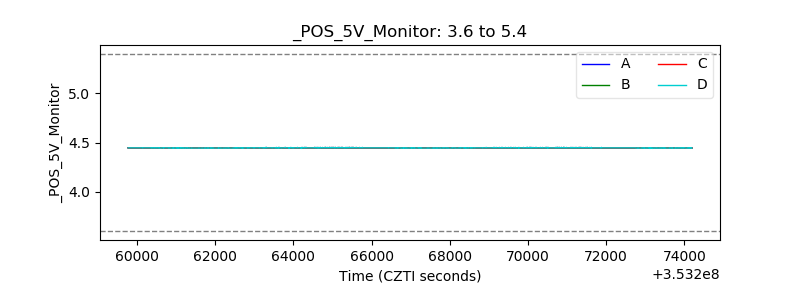 |
| _ROLL_ROT | 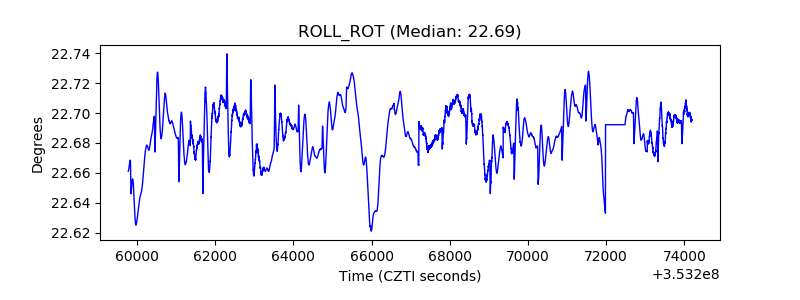 |
| _Roll_DEC | 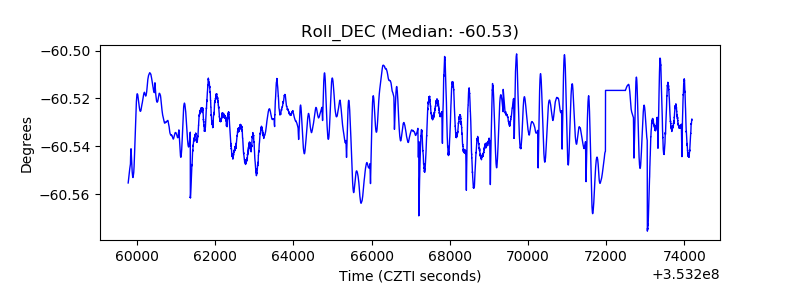 |
| _Roll_RA | 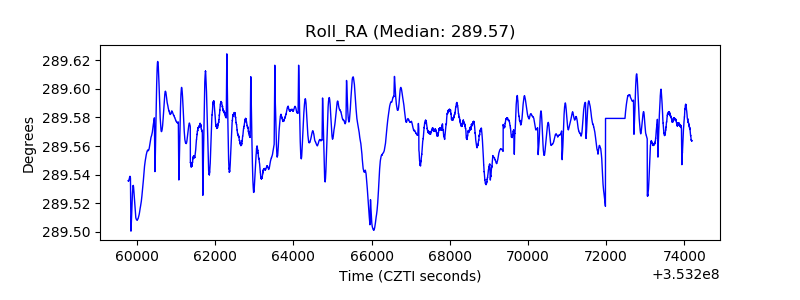 |
| Veto Counter | 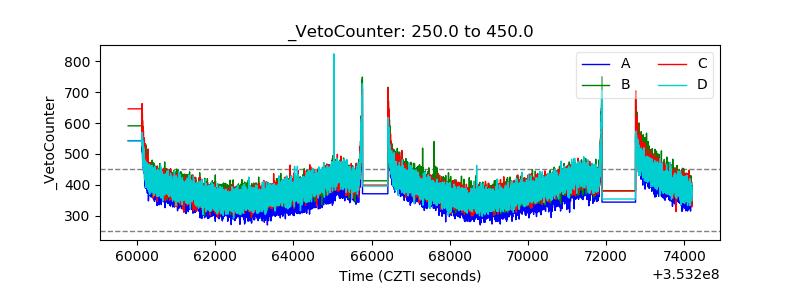 |