| Param | Original file | Final file |
|---|---|---|
| Filename | modeM0/AS1A10_064T03_9000004246_29495cztM0_level2.evt | modeM0/AS1A10_064T03_9000004246_29495cztM0_level2_quad_clean.evt |
| Size (bytes) | 845,982,720 | 98,225,280 |
| Size | 806.8 MB | 93.7 MB |
| Events in quadrant A | 3,163,385 | 702,453 |
| Events in quadrant B | 3,365,557 | 710,723 |
| Events in quadrant C | 3,823,242 | 653,401 |
| Events in quadrant D | 14,821,788 | 445,537 |
| Mode SS | |||
|---|---|---|---|
| Quadrant | BADHDUFLAG | Total packets | Discarded packets |
| A | 0 | 136 | 0 |
| B | 0 | 136 | 0 |
| C | 0 | 136 | 0 |
| D | 0 | 136 | 0 |
| Mode M0 | |||
|---|---|---|---|
| Quadrant | BADHDUFLAG | Total packets | Discarded packets |
| A | 0 | 13635 | 2 |
| B | 0 | 14287 | 2 |
| C | 0 | 15514 | 2 |
| D | 0 | 48554 | 2 |
| Mode M9 | |||
|---|---|---|---|
| Quadrant | BADHDUFLAG | Total packets | Discarded packets |
| A | 0 | 12 | 0 |
| B | 0 | 13 | 0 |
| C | 0 | 13 | 0 |
| D | 0 | 13 | 0 |
| Quadrant | Total seconds | Saturated seconds | Saturation percentage |
|---|---|---|---|
| A | 6603 | 34 | 0.514917% |
| B | 6603 | 49 | 0.742087% |
| C | 6603 | 511 | 7.738907% |
| D | 6603 | 4571 | 69.226109% |
Noise dominated data is calculated using 1-second bins in cleaned event files. If a bin has >2000 counts, and if more than 50% of those come from <1% of pixels, then it is considered to be noise-dominated and hence unusable.
| Quadrant | # 1 sec bins | Bins with >0 counts | Bins with >2000 counts | High rate bins dominated by noise | Noise dominated (total time) | Noise dominated (detector-on time) | Marked lightcurve |
|---|---|---|---|---|---|---|---|
| A | 7623 | 6604 | 0 | 0 | 0.00% | 0.00% | 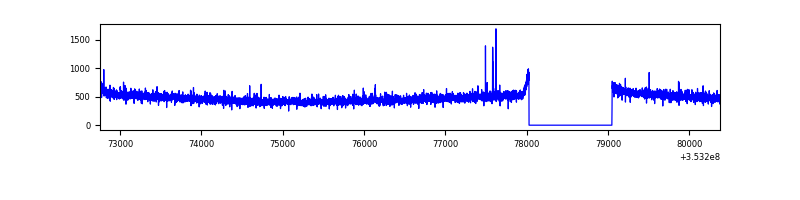 |
| B | 7623 | 6604 | 12 | 12 | 0.16% | 0.18% | 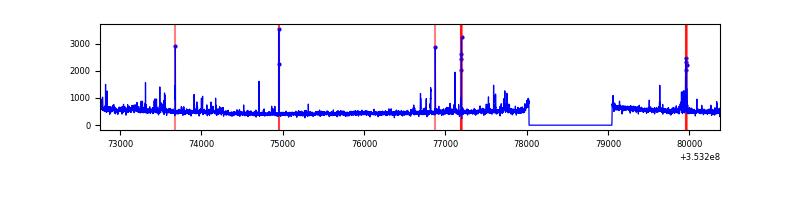 |
| C | 7623 | 6604 | 21 | 21 | 0.28% | 0.32% | 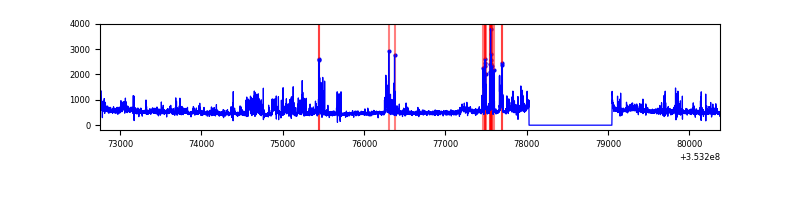 |
| D | 7623 | 6603 | 4624 | 4624 | 60.66% | 70.03% | 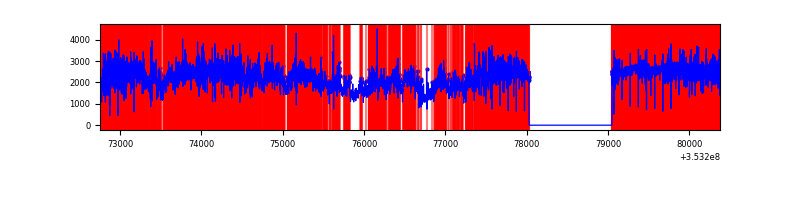 |
Top three noisy pixels from each quadrant. If the there are fewer than three noisy pixels in the level2.evt file, extra rows are filled as -1
| Pixel properties | Quadrant properties | ||||||
|---|---|---|---|---|---|---|---|
| Quadrant | DetID | PixID | Counts | Sigma | Mean | Median | Sigma |
| A | 13 | 254 | 13306 | 77.24 | 814 | 798 | 161.9 |
| A | 15 | 174 | 10786 | 61.68 | 814 | 798 | 161.9 |
| A | 3 | 137 | 7766 | 43.03 | 814 | 798 | 161.9 |
| B | 0 | 190 | 77795 | 500.59 | 808 | 789 | 153.8 |
| B | 5 | 172 | 39582 | 252.18 | 808 | 789 | 153.8 |
| B | 15 | 33 | 36045 | 229.19 | 808 | 789 | 153.8 |
| C | 14 | 238 | 283014 | 1603.71 | 757 | 761 | 176.0 |
| C | 7 | 247 | 259743 | 1471.48 | 757 | 761 | 176.0 |
| C | 14 | 254 | 225749 | 1278.34 | 757 | 761 | 176.0 |
| D | 8 | 195 | 5097666 | 39069.74 | 547 | 530 | 130.5 |
| D | 12 | 33 | 3582773 | 27458.03 | 547 | 530 | 130.5 |
| D | 7 | 223 | 2198742 | 16849.38 | 547 | 530 | 130.5 |
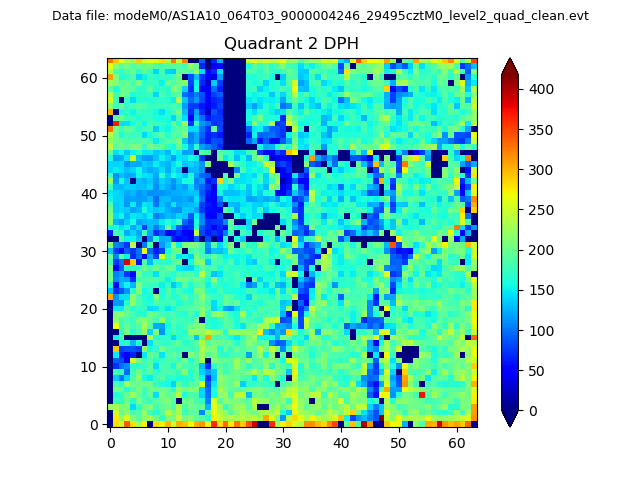
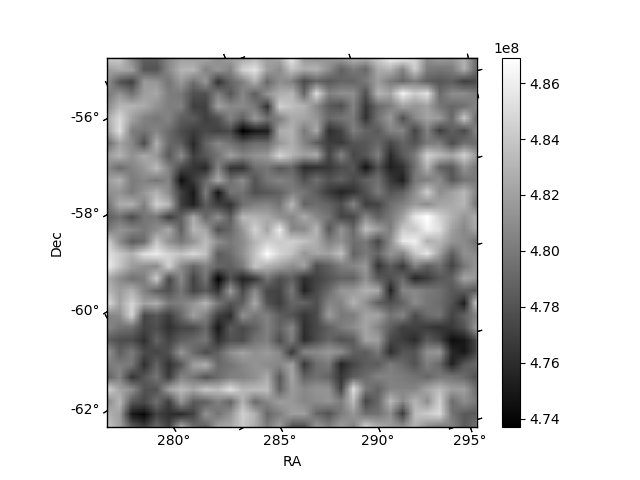
Histogram calculated using DETX and DETY for each event in the final _common_clean file
| Quadrant A | 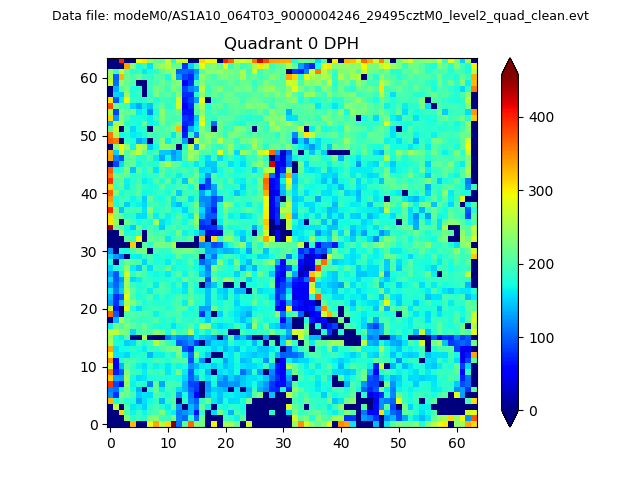 |
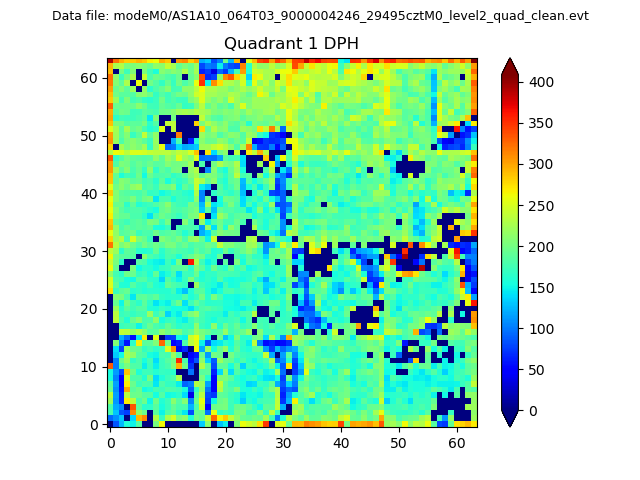 |
Quadrant B |
|---|---|---|---|
| Quadrant D | 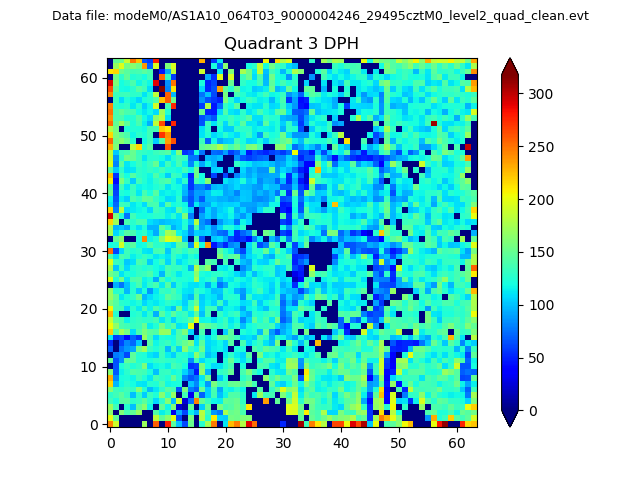 |
 |
Quadrant C |
| Plot type | Count rate plots | Images |
|---|---|---|
| Comparison with Poisson distribution Blue bars denote a histogram of data divided into 1 sec bins. Red curve is a Poisson curve with rate = median count rate of data. |
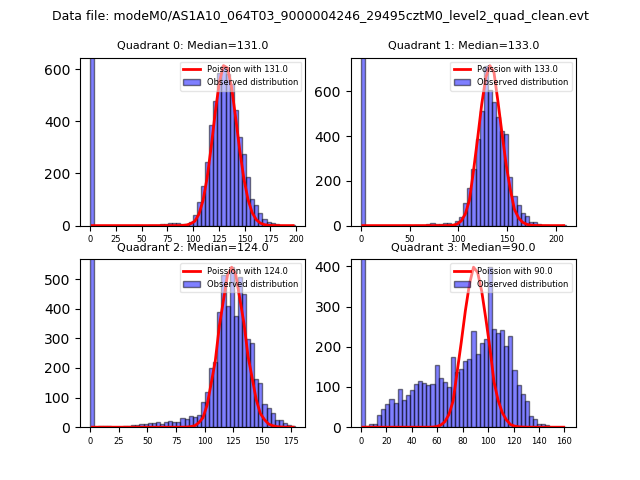 |
 |
| Quadrant-wise count rates Data is divided into 100 sec bins |
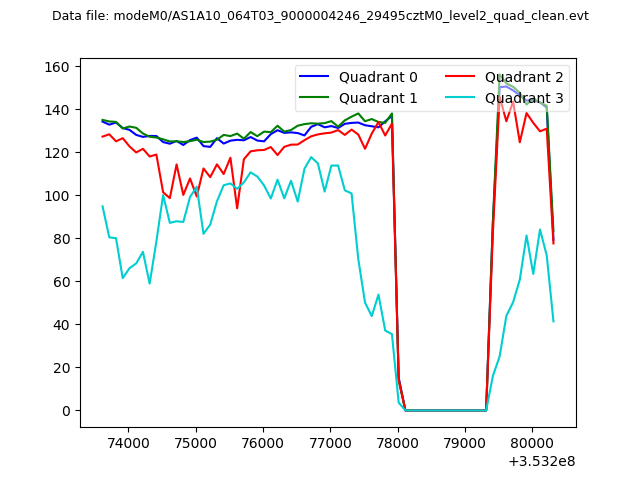 |
|
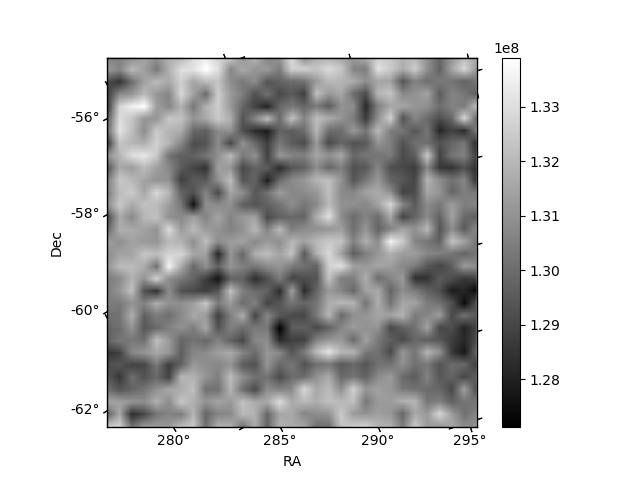
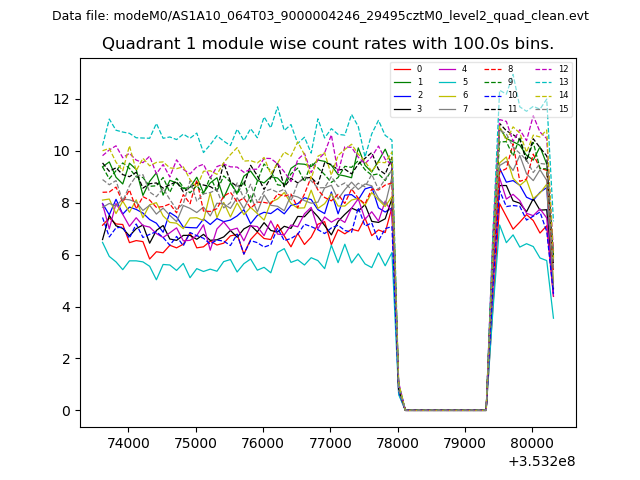
| Module-wise count rates for Quadrant A Data is divided into 100 sec bins |
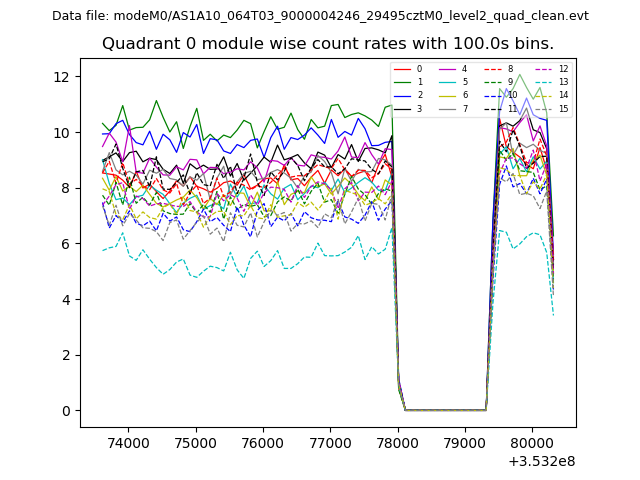 |
 |
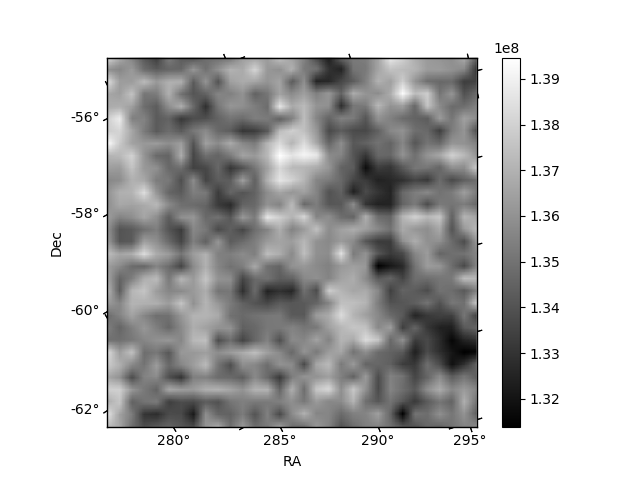
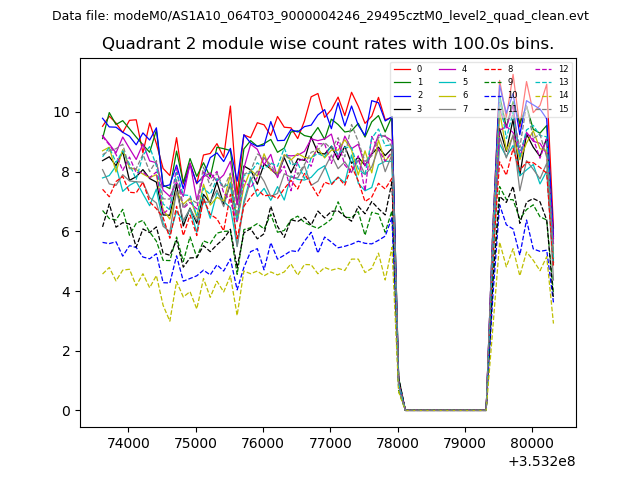
| Module-wise count rates for Quadrant B Data is divided into 100 sec bins |
 |
 |
| Module-wise count rates for Quadrant C Data is divided into 100 sec bins |
 |
 |
| Module-wise count rates for Quadrant D Data is divided into 100 sec bins |
 |
 |
| Parameter | Plot |
|---|---|
| CZT HV Monitor |  |
| D_VDD | 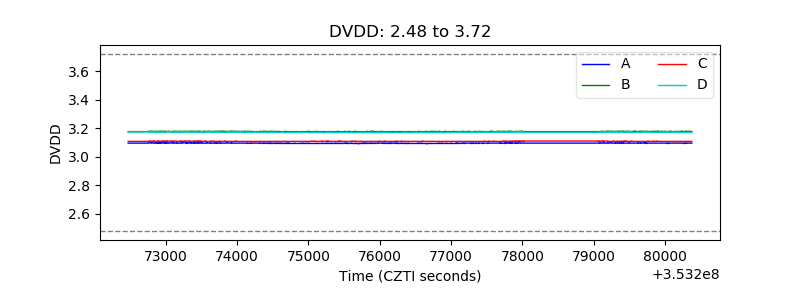 |
| Temperature 1 |  |
| Veto HV Monitor | 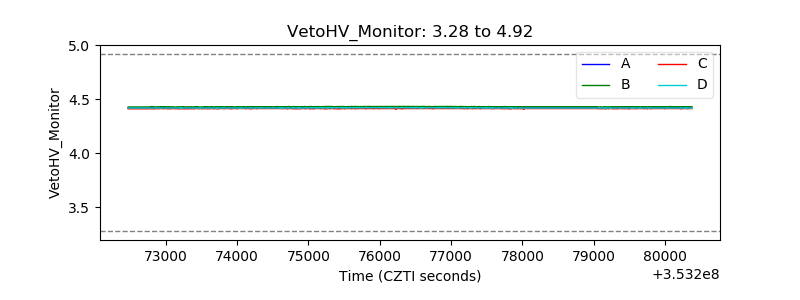 |
| Veto LLD | 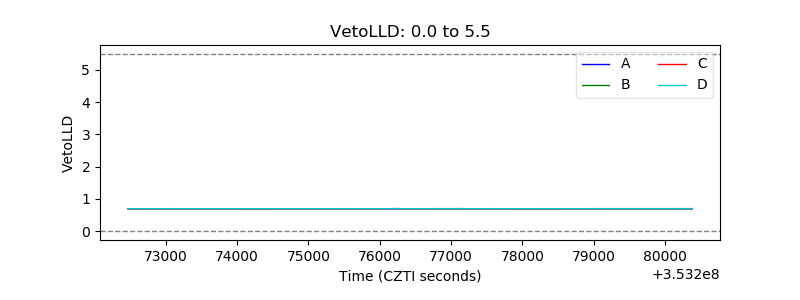 |
| Alpha Counter | 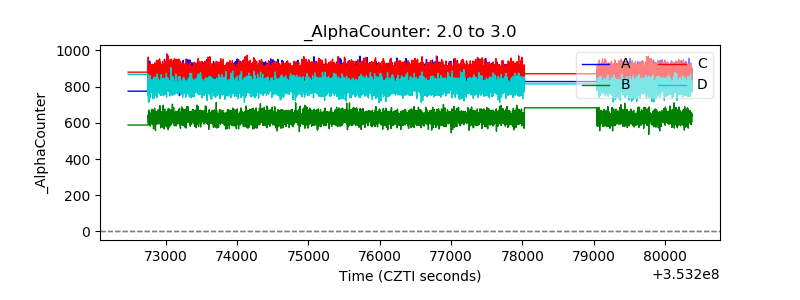 |
| _CPM_Rate | 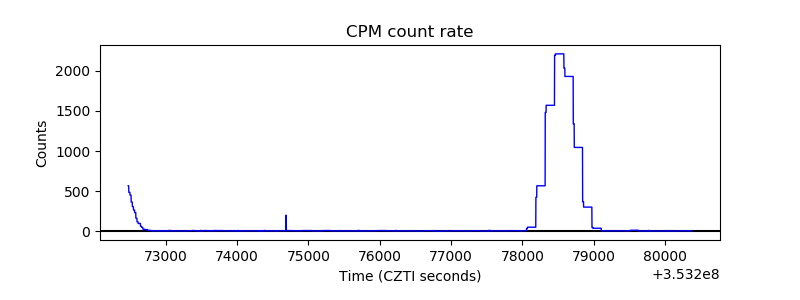 |
| CZT Counter | 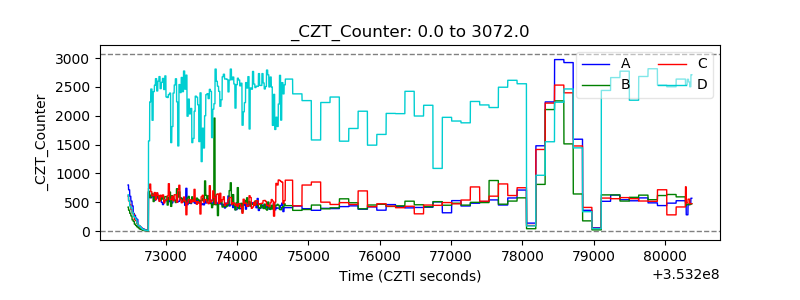 |
| +2.5 Volts monitor |  |
| +5 Volts monitor |  |
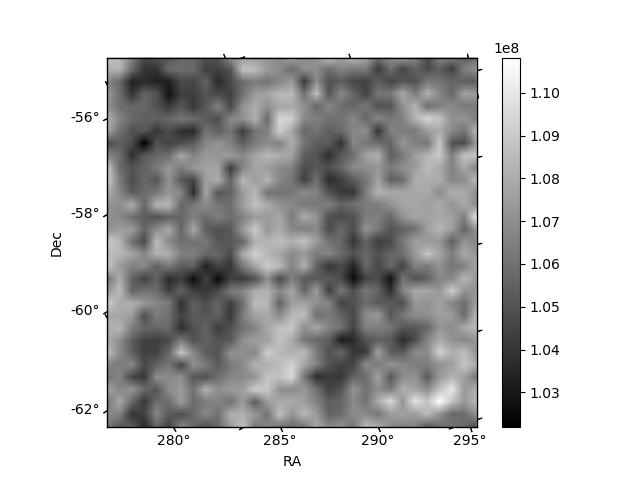
| _ROLL_ROT | 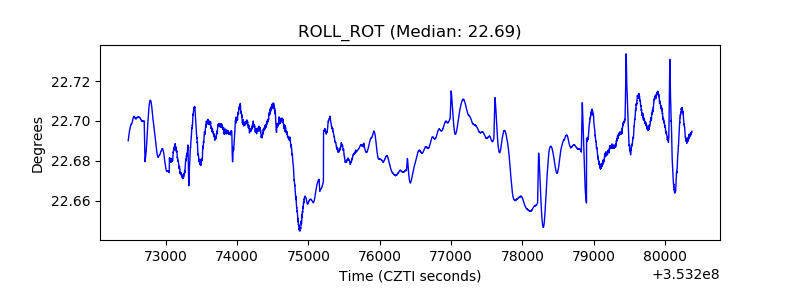 |
| _Roll_DEC | 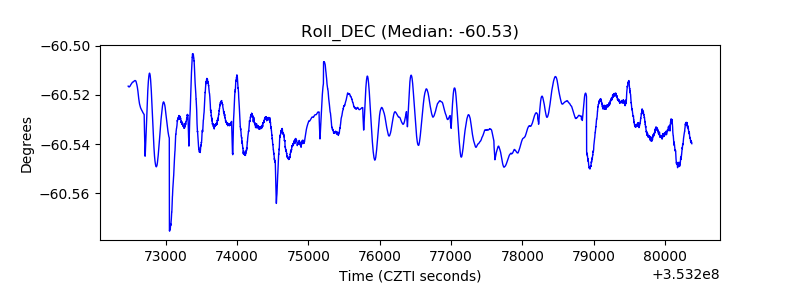 |
| _Roll_RA | 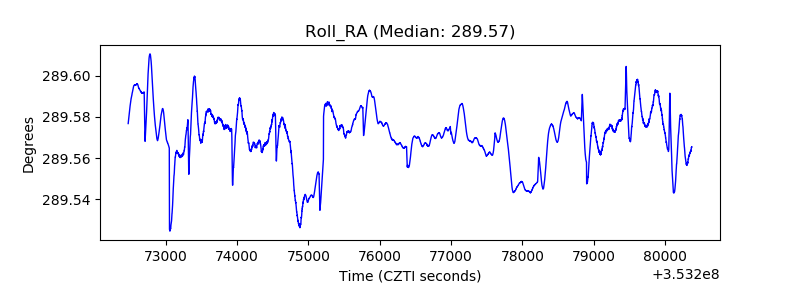 |
| Veto Counter | 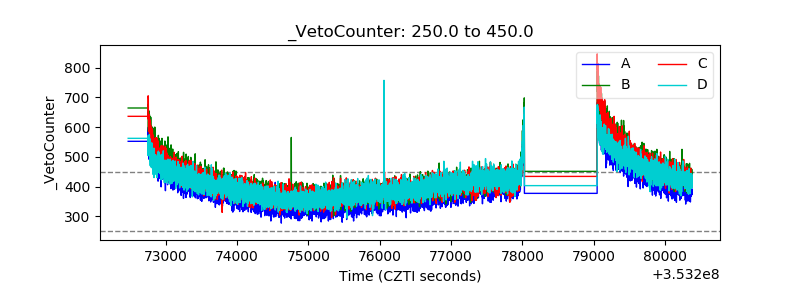 |