| Param | Original file | Final file |
|---|---|---|
| Filename | modeM0/AS1A10_064T03_9000004246_29497cztM0_level2.evt | modeM0/AS1A10_064T03_9000004246_29497cztM0_level2_quad_clean.evt |
| Size (bytes) | 746,496,000 | 114,914,880 |
| Size | 711.9 MB | 109.6 MB |
| Events in quadrant A | 3,056,584 | 838,649 |
| Events in quadrant B | 3,142,083 | 856,559 |
| Events in quadrant C | 3,268,184 | 802,364 |
| Events in quadrant D | 12,724,118 | 551,230 |
| Mode SS | |||
|---|---|---|---|
| Quadrant | BADHDUFLAG | Total packets | Discarded packets |
| A | 0 | 124 | 0 |
| B | 0 | 124 | 0 |
| C | 0 | 124 | 0 |
| D | 0 | 124 | 0 |
| Mode M0 | |||
|---|---|---|---|
| Quadrant | BADHDUFLAG | Total packets | Discarded packets |
| A | 0 | 13007 | 2 |
| B | 0 | 13286 | 1 |
| C | 0 | 13504 | 1 |
| D | 0 | 42043 | 1 |
| Mode M9 | |||
|---|---|---|---|
| Quadrant | BADHDUFLAG | Total packets | Discarded packets |
| A | 0 | 12 | 0 |
| B | 0 | 12 | 0 |
| C | 0 | 12 | 0 |
| D | 0 | 12 | 0 |
| Quadrant | Total seconds | Saturated seconds | Saturation percentage |
|---|---|---|---|
| A | 6163 | 22 | 0.356969% |
| B | 6163 | 28 | 0.454324% |
| C | 6163 | 185 | 3.001785% |
| D | 6164 | 3791 | 61.502271% |
Noise dominated data is calculated using 1-second bins in cleaned event files. If a bin has >2000 counts, and if more than 50% of those come from <1% of pixels, then it is considered to be noise-dominated and hence unusable.
| Quadrant | # 1 sec bins | Bins with >0 counts | Bins with >2000 counts | High rate bins dominated by noise | Noise dominated (total time) | Noise dominated (detector-on time) | Marked lightcurve |
|---|---|---|---|---|---|---|---|
| A | 7333 | 6164 | 14 | 14 | 0.19% | 0.23% |  |
| B | 7333 | 6164 | 6 | 6 | 0.08% | 0.10% | 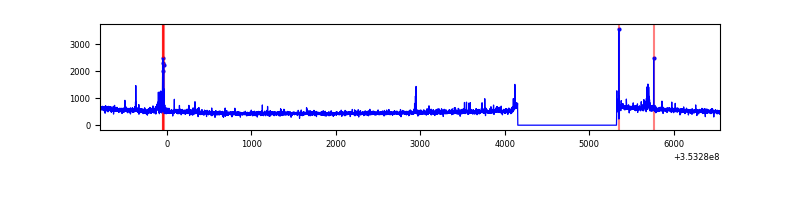 |
| C | 7333 | 6164 | 0 | 0 | 0.00% | 0.00% |  |
| D | 7334 | 6164 | 3605 | 3605 | 49.15% | 58.48% | 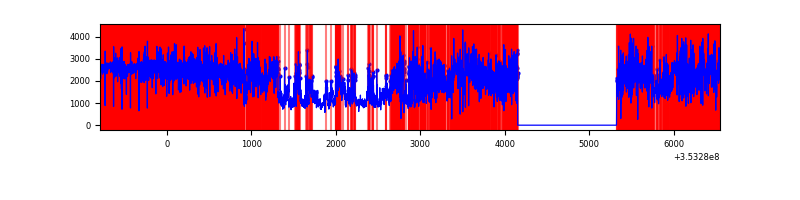 |
Top three noisy pixels from each quadrant. If the there are fewer than three noisy pixels in the level2.evt file, extra rows are filled as -1
| Pixel properties | Quadrant properties | ||||||
|---|---|---|---|---|---|---|---|
| Quadrant | DetID | PixID | Counts | Sigma | Mean | Median | Sigma |
| A | 15 | 174 | 59758 | 380.4 | 776 | 760 | 155.1 |
| A | 13 | 254 | 11566 | 69.67 | 776 | 760 | 155.1 |
| A | 3 | 137 | 7290 | 42.1 | 776 | 760 | 155.1 |
| B | 5 | 172 | 48832 | 328.96 | 775 | 759 | 146.1 |
| B | 0 | 190 | 25539 | 169.57 | 775 | 759 | 146.1 |
| B | 12 | 111 | 17260 | 112.91 | 775 | 759 | 146.1 |
| C | 14 | 238 | 182155 | 1056.64 | 739 | 745 | 171.7 |
| C | 14 | 254 | 87781 | 506.95 | 739 | 745 | 171.7 |
| C | 3 | 233 | 87189 | 503.5 | 739 | 745 | 171.7 |
| D | 8 | 195 | 4360250 | 32845.05 | 556 | 541 | 132.7 |
| D | 12 | 33 | 2581492 | 19444.3 | 556 | 541 | 132.7 |
| D | 1 | 52 | 1559635 | 11745.86 | 556 | 541 | 132.7 |
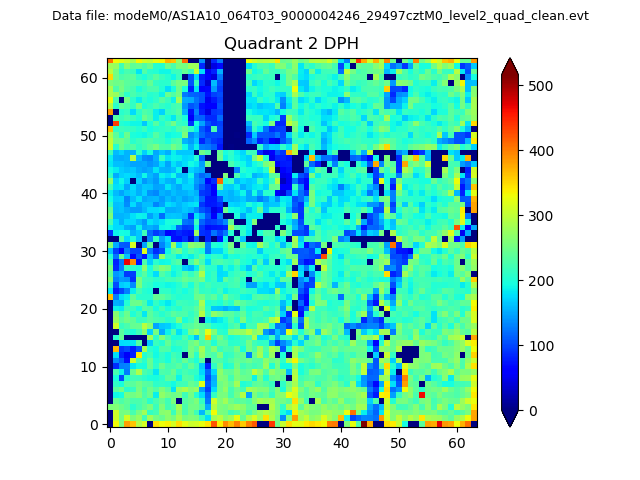
Histogram calculated using DETX and DETY for each event in the final _common_clean file
| Quadrant A | 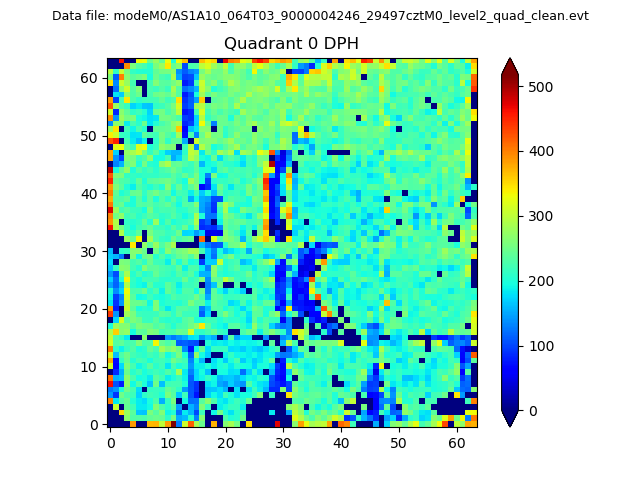 |
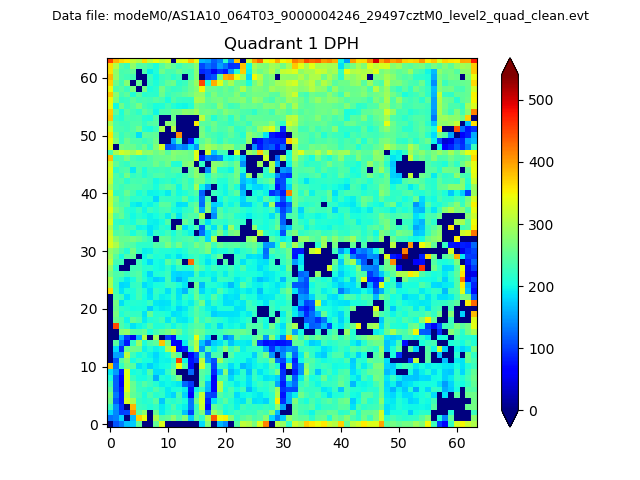 |
Quadrant B |
|---|---|---|---|
| Quadrant D | 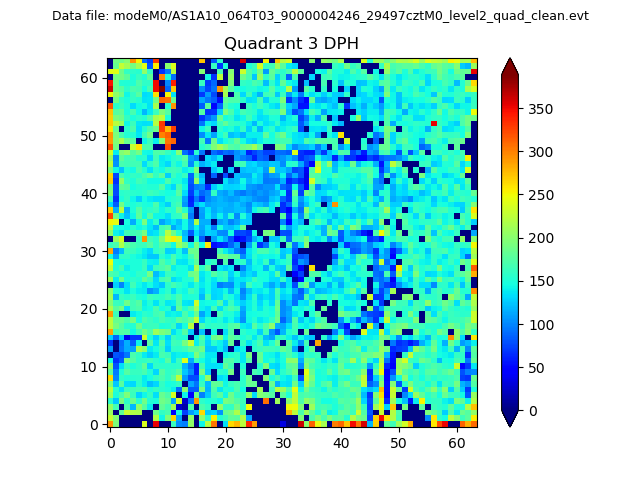 |
 |
Quadrant C |
| Plot type | Count rate plots | Images |
|---|---|---|
| Comparison with Poisson distribution Blue bars denote a histogram of data divided into 1 sec bins. Red curve is a Poisson curve with rate = median count rate of data. |
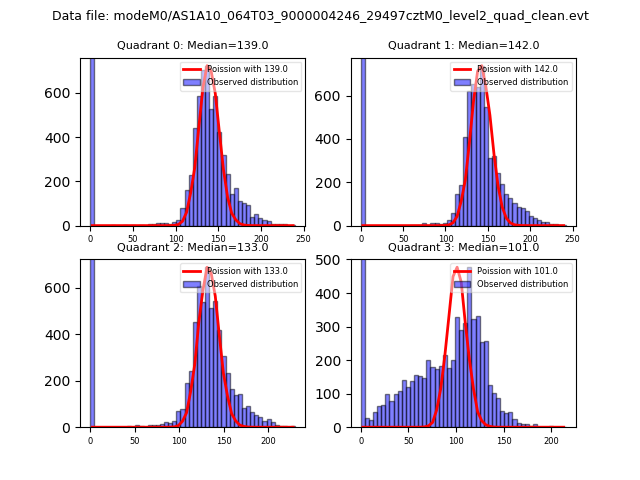 |
 |
| Quadrant-wise count rates Data is divided into 100 sec bins |
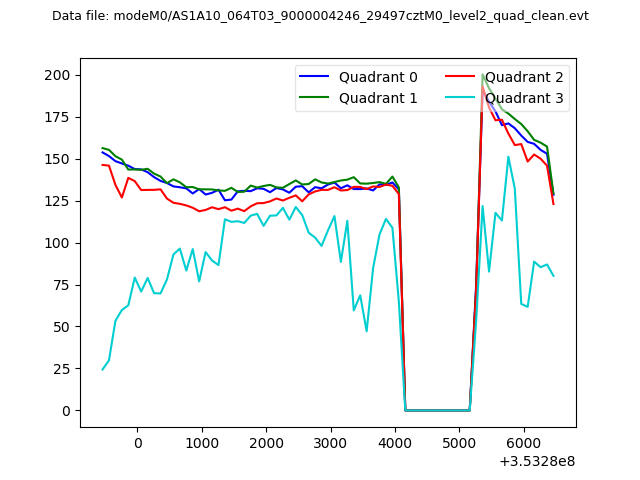 |
|
| Module-wise count rates for Quadrant A Data is divided into 100 sec bins |
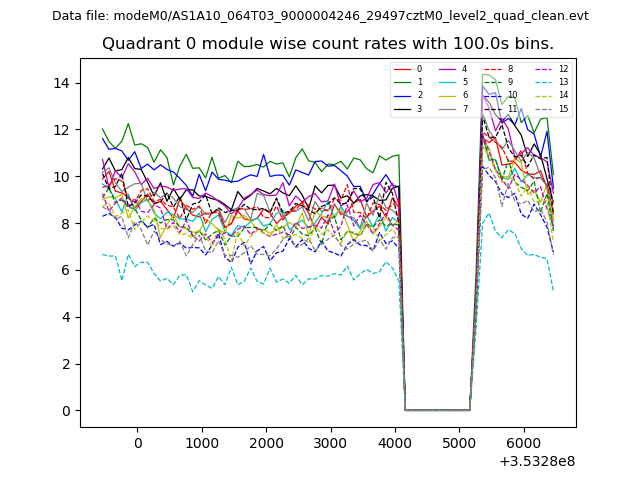 |
 |
| Module-wise count rates for Quadrant B Data is divided into 100 sec bins |
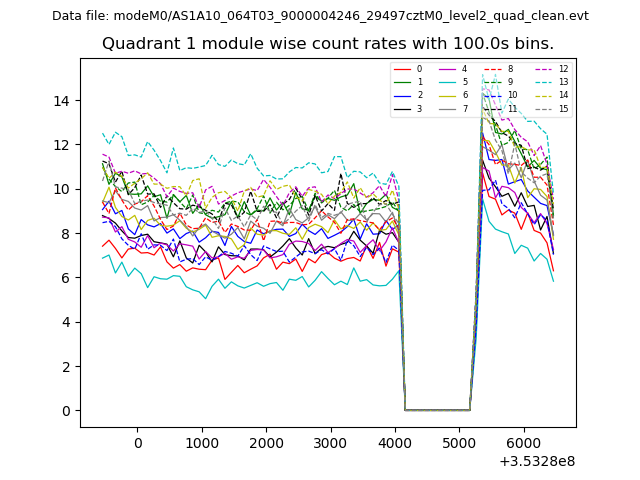 |
 |
| Module-wise count rates for Quadrant C Data is divided into 100 sec bins |
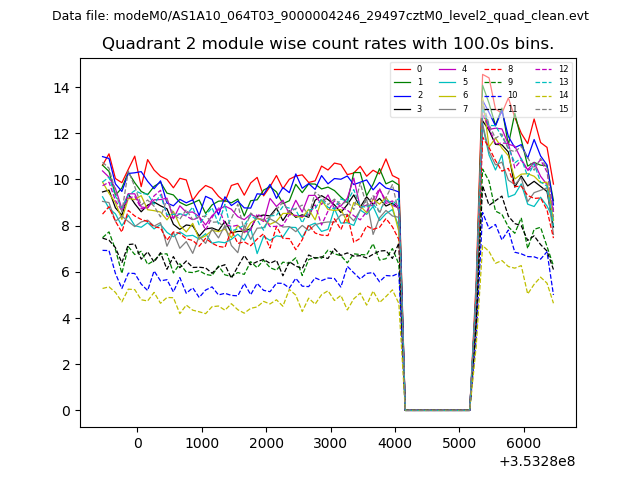 |
 |
| Module-wise count rates for Quadrant D Data is divided into 100 sec bins |
 |
 |
| Parameter | Plot |
|---|---|
| CZT HV Monitor | 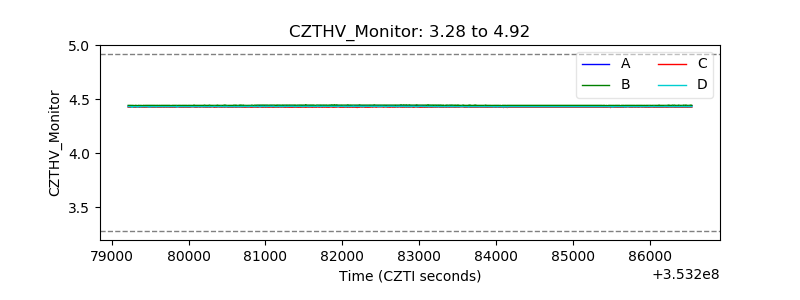 |
| D_VDD | 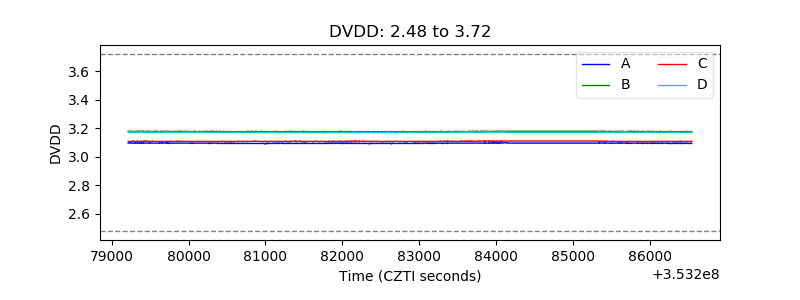 |
| Temperature 1 | 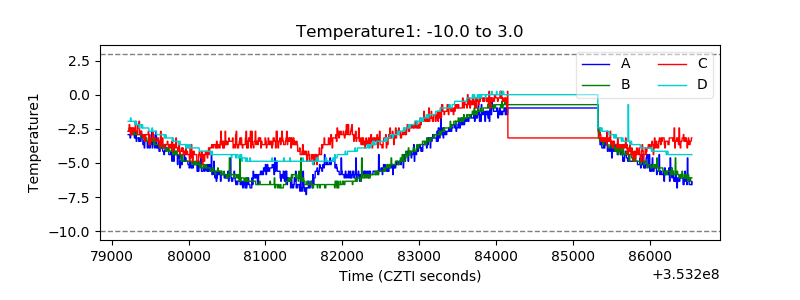 |
| Veto HV Monitor | 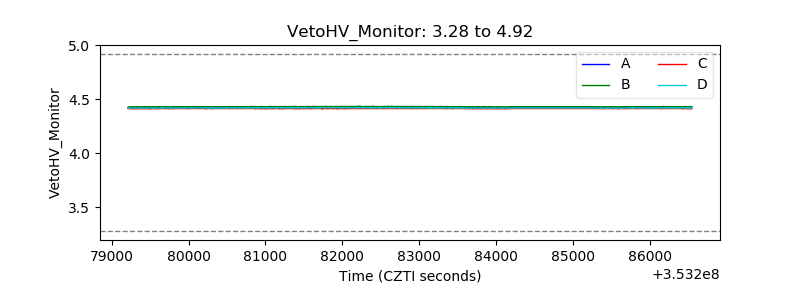 |
| Veto LLD | 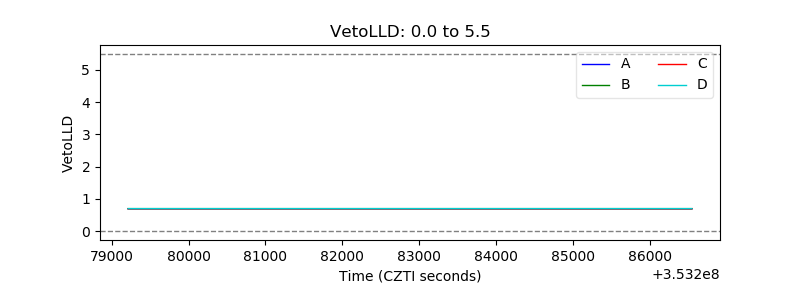 |
| Alpha Counter |  |
| _CPM_Rate | 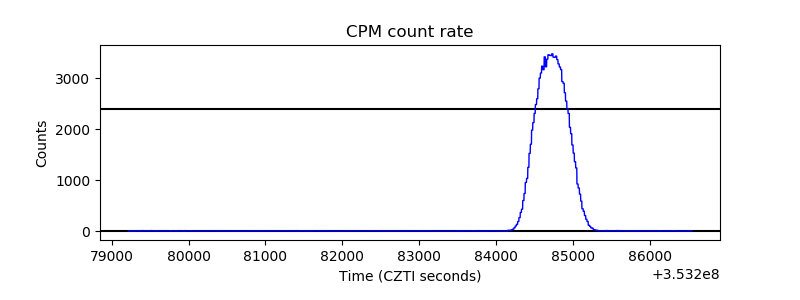 |
| CZT Counter | 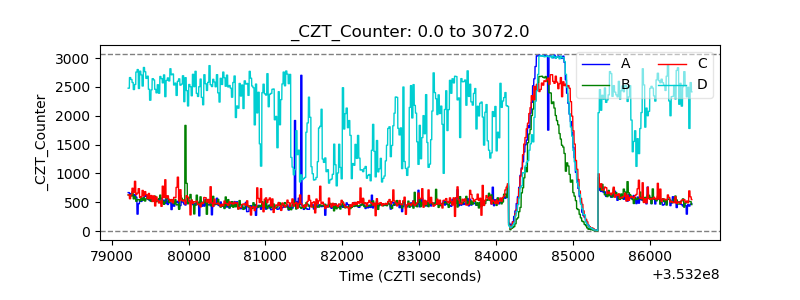 |
| +2.5 Volts monitor |  |
| +5 Volts monitor |  |
| _ROLL_ROT | 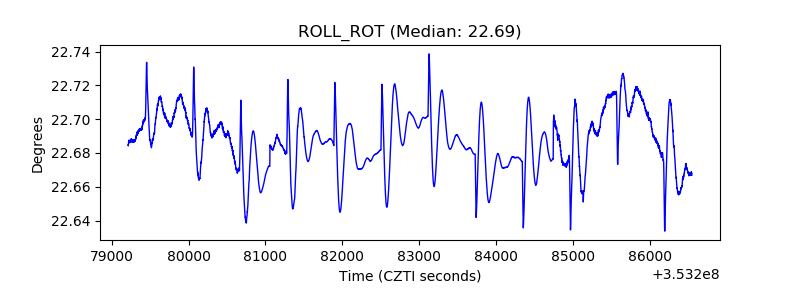 |
| _Roll_DEC | 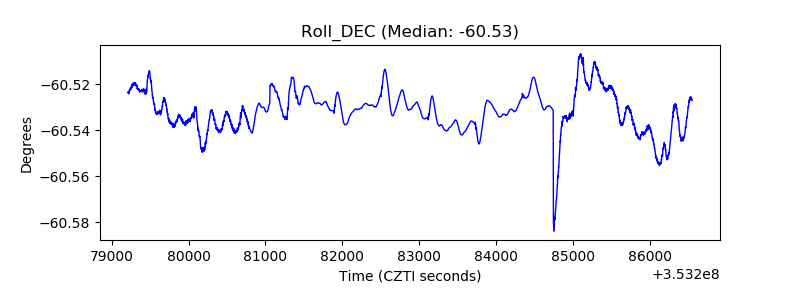 |
| _Roll_RA | 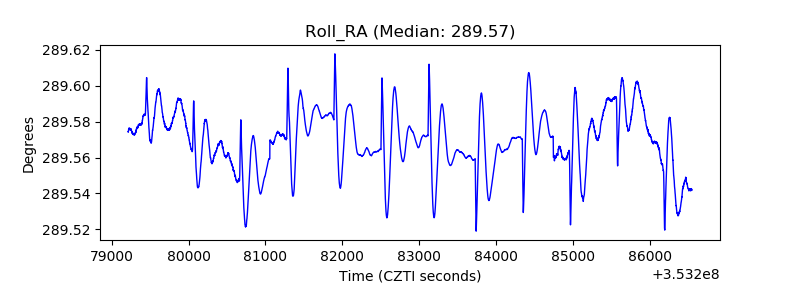 |
| Veto Counter | 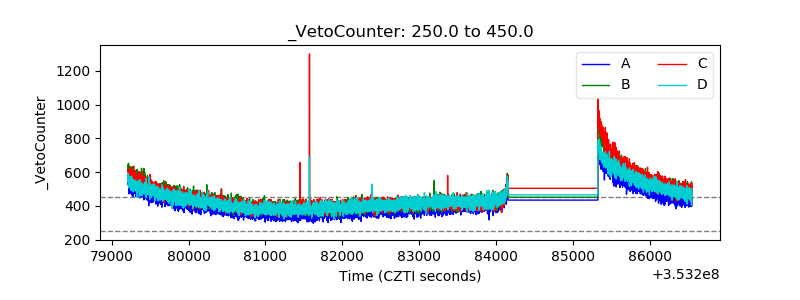 |