| Param | Original file | Final file |
|---|---|---|
| Filename | modeM0/AS1A10_064T03_9000004246_29498cztM0_level2.evt | modeM0/AS1A10_064T03_9000004246_29498cztM0_level2_quad_clean.evt |
| Size (bytes) | 785,229,120 | 124,873,920 |
| Size | 748.9 MB | 119.1 MB |
| Events in quadrant A | 3,184,039 | 905,915 |
| Events in quadrant B | 3,351,979 | 933,435 |
| Events in quadrant C | 3,570,530 | 878,278 |
| Events in quadrant D | 13,251,924 | 626,710 |
| Mode SS | |||
|---|---|---|---|
| Quadrant | BADHDUFLAG | Total packets | Discarded packets |
| A | 0 | 126 | 0 |
| B | 0 | 126 | 0 |
| C | 0 | 126 | 0 |
| D | 0 | 126 | 0 |
| Mode M0 | |||
|---|---|---|---|
| Quadrant | BADHDUFLAG | Total packets | Discarded packets |
| A | 0 | 13402 | 2 |
| B | 0 | 13959 | 2 |
| C | 0 | 14578 | 2 |
| D | 0 | 43642 | 6 |
| Mode M9 | |||
|---|---|---|---|
| Quadrant | BADHDUFLAG | Total packets | Discarded packets |
| A | 0 | 13 | 0 |
| B | 0 | 13 | 0 |
| C | 0 | 13 | 0 |
| D | 0 | 13 | 0 |
| Quadrant | Total seconds | Saturated seconds | Saturation percentage |
|---|---|---|---|
| A | 6253 | 42 | 0.671678% |
| B | 6253 | 54 | 0.863585% |
| C | 6254 | 153 | 2.446434% |
| D | 6253 | 3933 | 62.897809% |
Noise dominated data is calculated using 1-second bins in cleaned event files. If a bin has >2000 counts, and if more than 50% of those come from <1% of pixels, then it is considered to be noise-dominated and hence unusable.
| Quadrant | # 1 sec bins | Bins with >0 counts | Bins with >2000 counts | High rate bins dominated by noise | Noise dominated (total time) | Noise dominated (detector-on time) | Marked lightcurve |
|---|---|---|---|---|---|---|---|
| A | 7503 | 6254 | 0 | 0 | 0.00% | 0.00% |  |
| B | 7503 | 6254 | 6 | 6 | 0.08% | 0.10% |  |
| C | 7504 | 6255 | 11 | 11 | 0.15% | 0.18% | 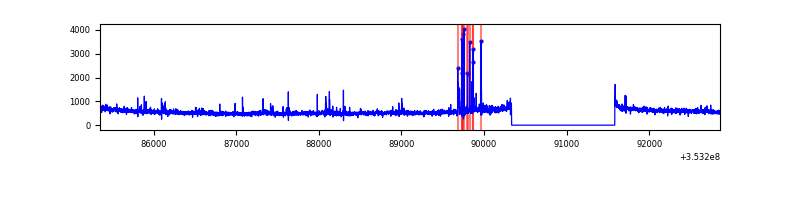 |
| D | 7503 | 6253 | 3808 | 3808 | 50.75% | 60.90% |  |
Top three noisy pixels from each quadrant. If the there are fewer than three noisy pixels in the level2.evt file, extra rows are filled as -1
| Pixel properties | Quadrant properties | ||||||
|---|---|---|---|---|---|---|---|
| Quadrant | DetID | PixID | Counts | Sigma | Mean | Median | Sigma |
| A | 0 | 13 | 12507 | 71.4 | 821 | 806 | 163.9 |
| A | 13 | 254 | 11783 | 66.98 | 821 | 806 | 163.9 |
| A | 3 | 137 | 7434 | 40.44 | 821 | 806 | 163.9 |
| B | 5 | 172 | 59770 | 389.64 | 823 | 805 | 151.3 |
| B | 0 | 190 | 34760 | 224.37 | 823 | 805 | 151.3 |
| B | 0 | 230 | 24988 | 159.8 | 823 | 805 | 151.3 |
| C | 3 | 233 | 188601 | 1025.09 | 796 | 805 | 183.2 |
| C | 14 | 238 | 154223 | 837.44 | 796 | 805 | 183.2 |
| C | 0 | 207 | 64130 | 345.66 | 796 | 805 | 183.2 |
| D | 8 | 195 | 7377564 | 49537.23 | 632 | 616 | 148.9 |
| D | 1 | 52 | 2368887 | 15903.27 | 632 | 616 | 148.9 |
| D | 12 | 33 | 454946 | 3050.89 | 632 | 616 | 148.9 |
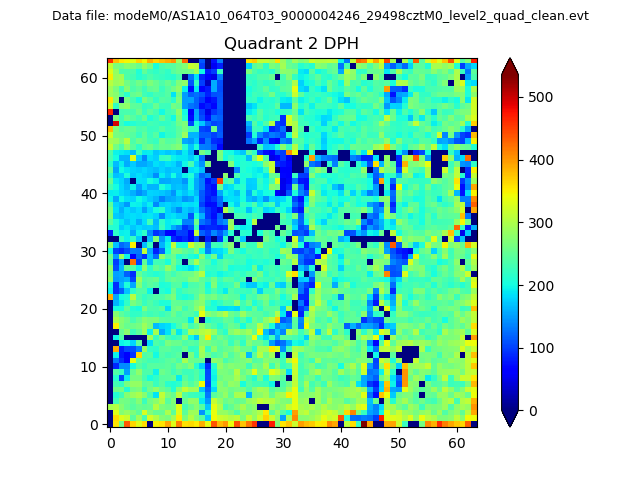
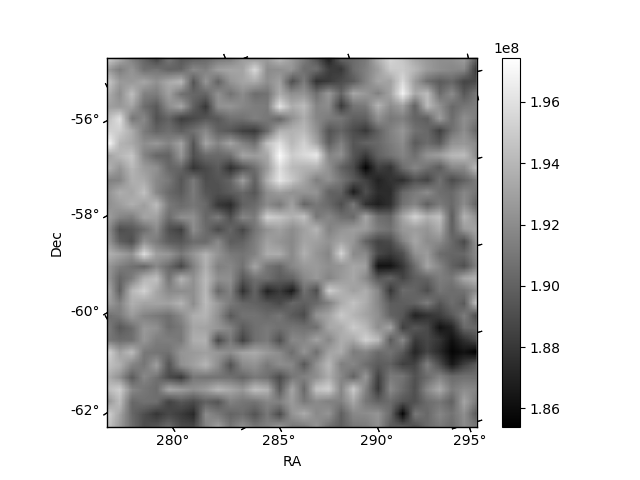
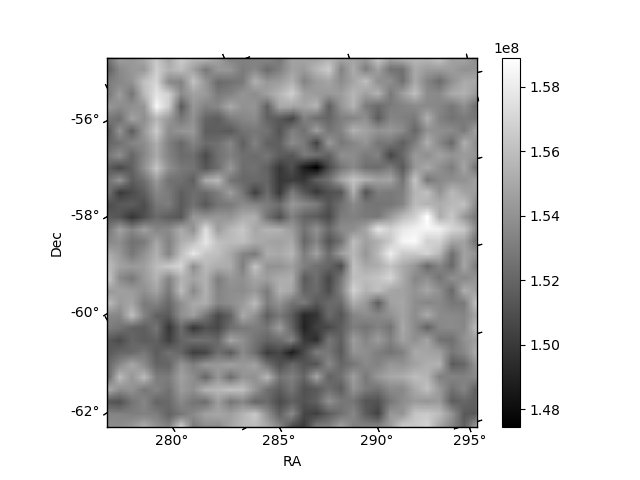
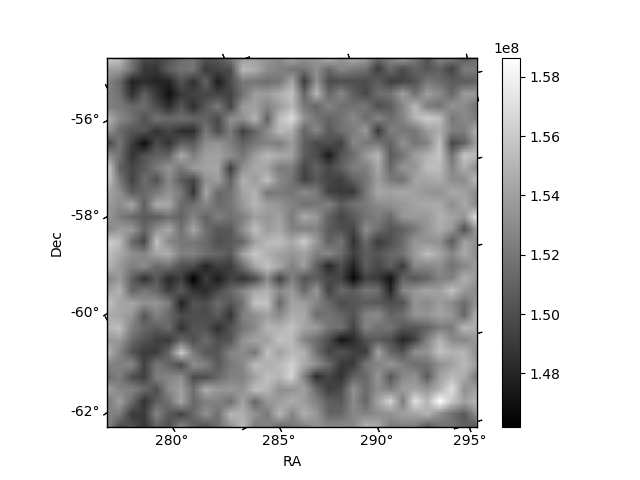
Histogram calculated using DETX and DETY for each event in the final _common_clean file
| Quadrant A | 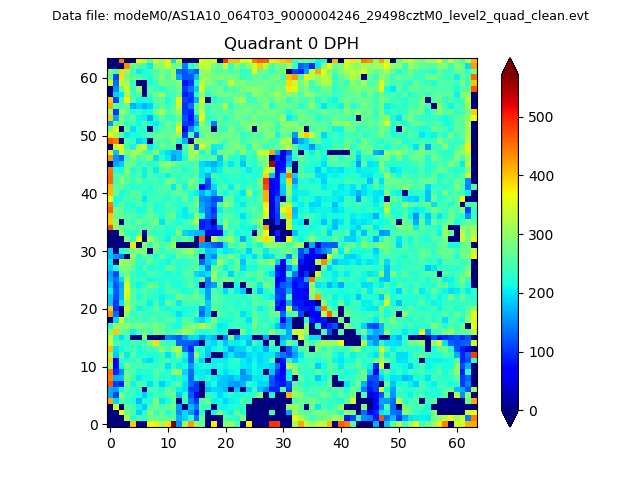 |
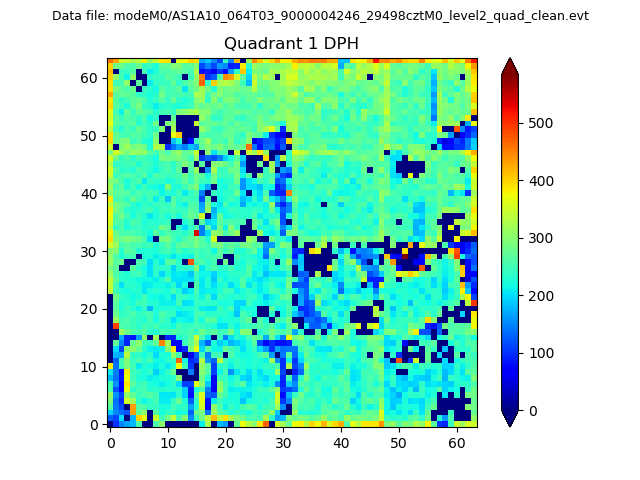 |
Quadrant B |
|---|---|---|---|
| Quadrant D | 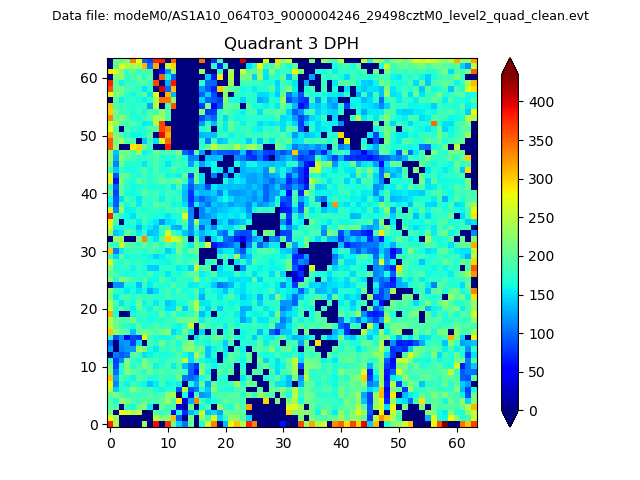 |
 |
Quadrant C |
| Plot type | Count rate plots | Images |
|---|---|---|
| Comparison with Poisson distribution Blue bars denote a histogram of data divided into 1 sec bins. Red curve is a Poisson curve with rate = median count rate of data. |
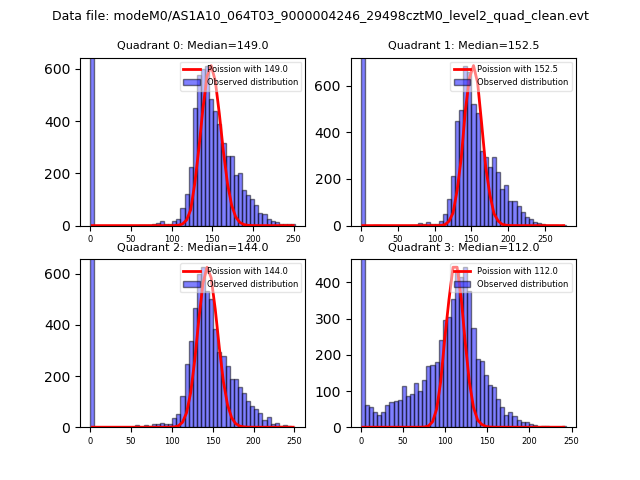 |
 |
| Quadrant-wise count rates Data is divided into 100 sec bins |
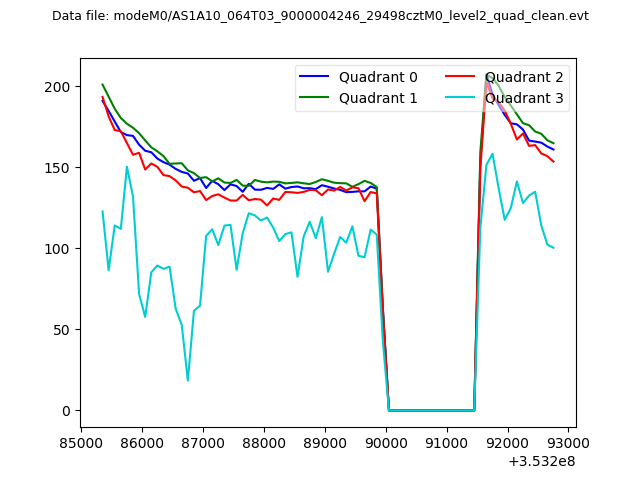 |
|
| Module-wise count rates for Quadrant A Data is divided into 100 sec bins |
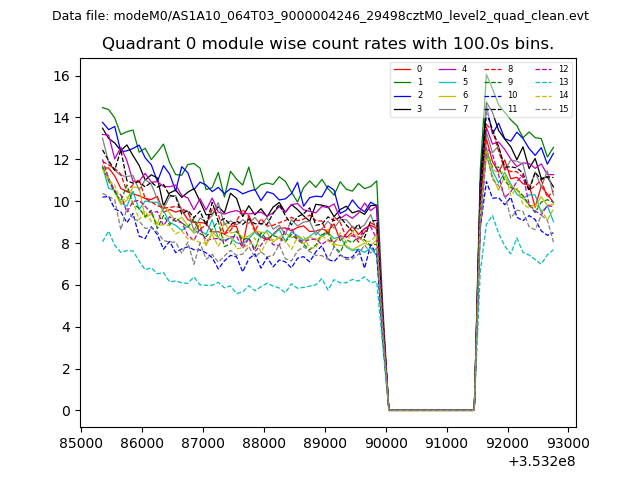 |
 |
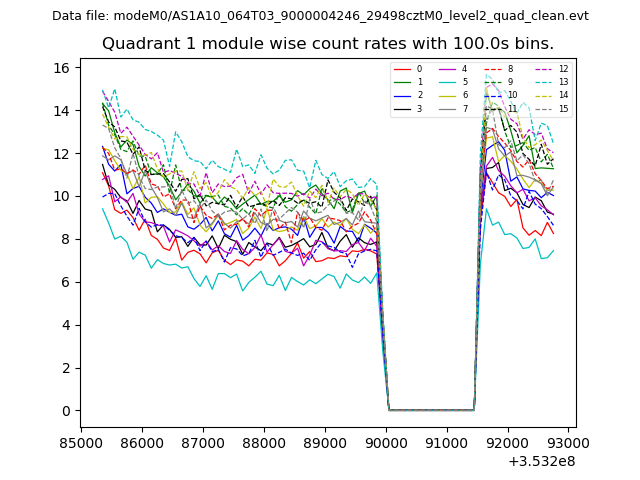
| Module-wise count rates for Quadrant B Data is divided into 100 sec bins |
 |
 |
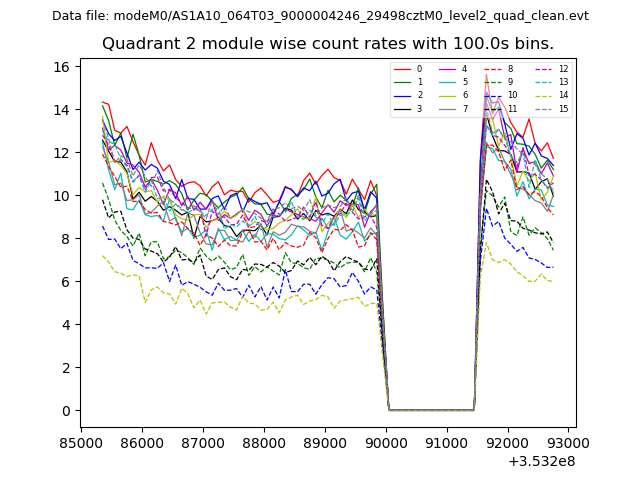
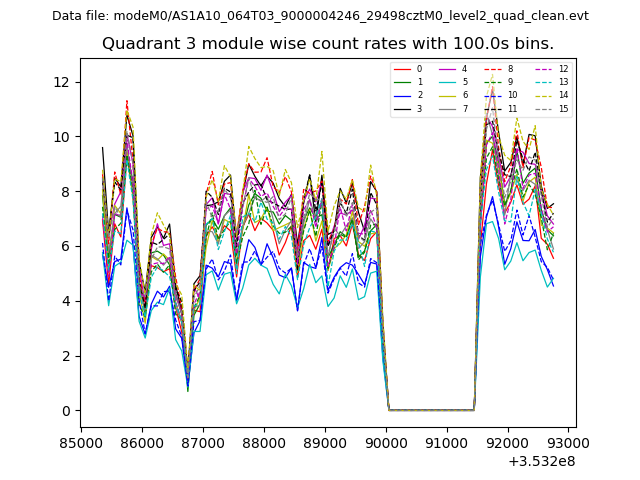
| Module-wise count rates for Quadrant C Data is divided into 100 sec bins |
 |
 |
| Module-wise count rates for Quadrant D Data is divided into 100 sec bins |
 |
 |
| Parameter | Plot |
|---|---|
| CZT HV Monitor | 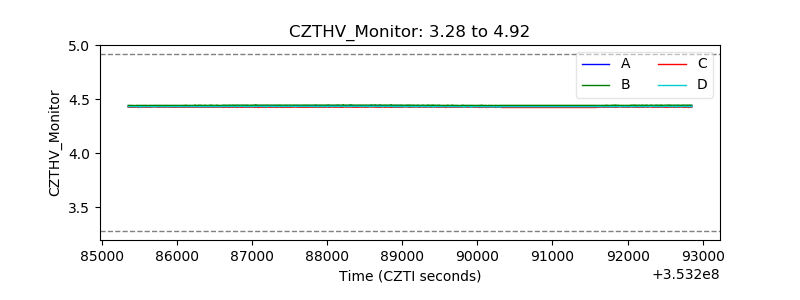 |
| D_VDD |  |
| Temperature 1 | 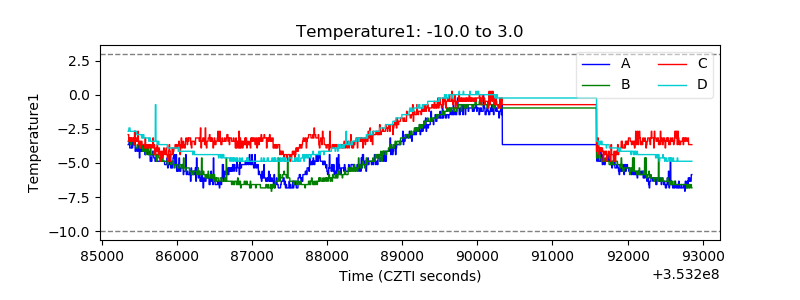 |
| Veto HV Monitor | 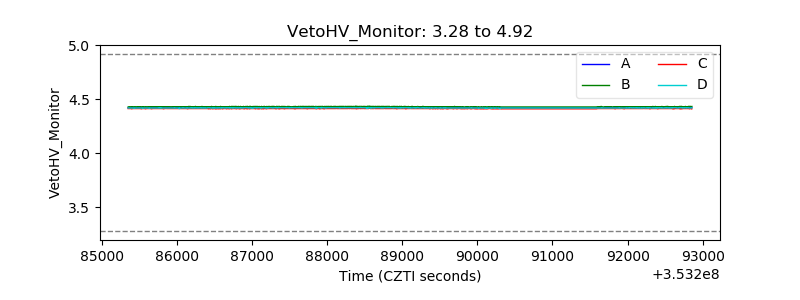 |
| Veto LLD | 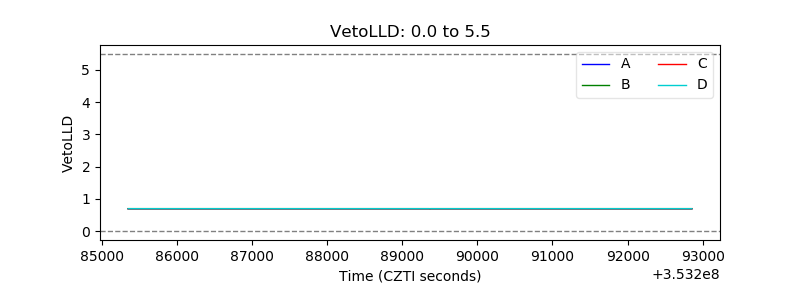 |
| Alpha Counter | 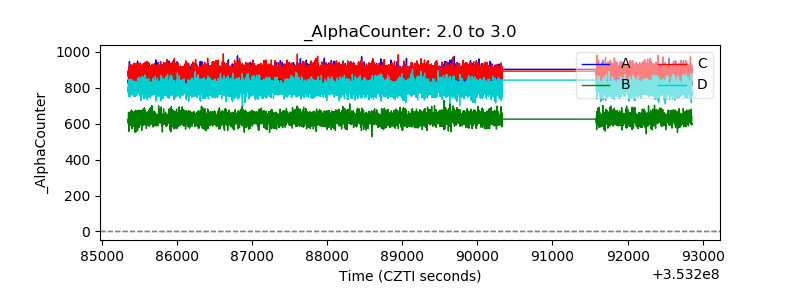 |
| _CPM_Rate | 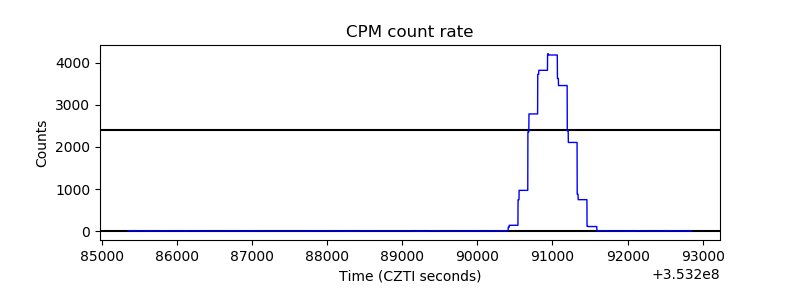 |
| CZT Counter | 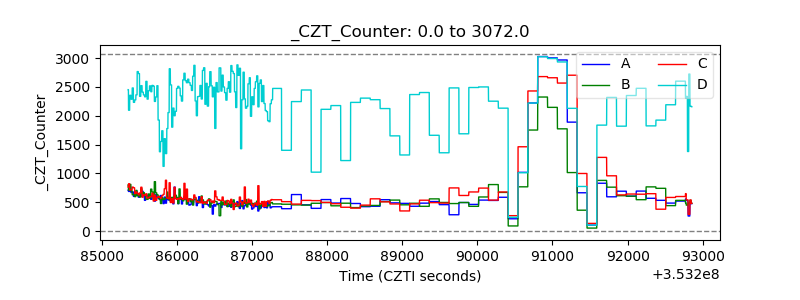 |
| +2.5 Volts monitor |  |
| +5 Volts monitor |  |
| _ROLL_ROT | 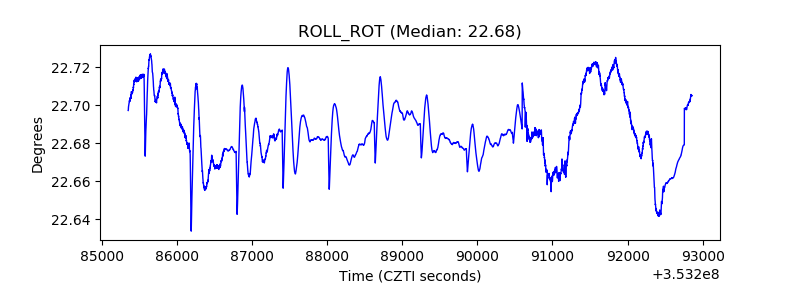 |
| _Roll_DEC | 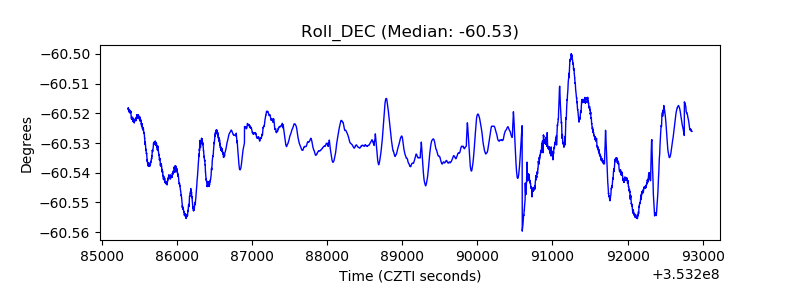 |
| _Roll_RA | 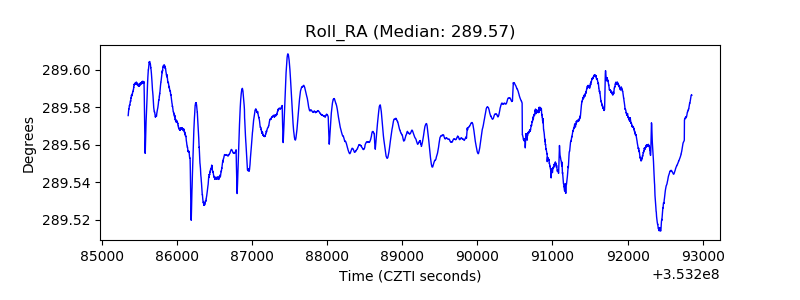 |
| Veto Counter | 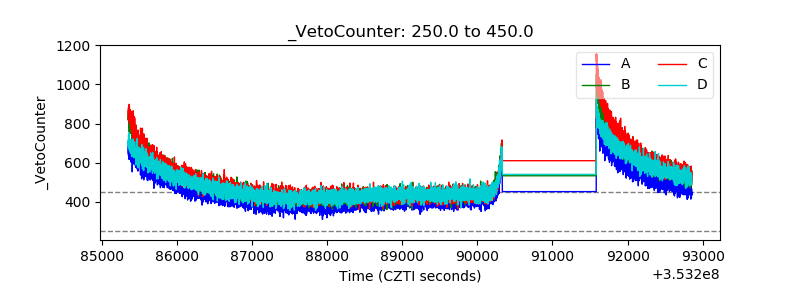 |