| Param | Original file | Final file |
|---|---|---|
| Filename | modeM0/AS1A10_064T03_9000004246_29499cztM0_level2.evt | modeM0/AS1A10_064T03_9000004246_29499cztM0_level2_quad_clean.evt |
| Size (bytes) | 476,328,960 | 84,709,440 |
| Size | 454.3 MB | 80.8 MB |
| Events in quadrant A | 1,961,644 | 611,500 |
| Events in quadrant B | 2,061,476 | 628,778 |
| Events in quadrant C | 2,414,382 | 584,478 |
| Events in quadrant D | 7,722,149 | 463,078 |
| Mode SS | |||
|---|---|---|---|
| Quadrant | BADHDUFLAG | Total packets | Discarded packets |
| A | 0 | 78 | 0 |
| B | 0 | 78 | 0 |
| C | 0 | 78 | 0 |
| D | 0 | 78 | 0 |
| Mode M0 | |||
|---|---|---|---|
| Quadrant | BADHDUFLAG | Total packets | Discarded packets |
| A | 0 | 8287 | 1 |
| B | 0 | 8589 | 1 |
| C | 0 | 9815 | 1 |
| D | 0 | 25639 | 1 |
| Mode M9 | |||
|---|---|---|---|
| Quadrant | BADHDUFLAG | Total packets | Discarded packets |
| A | 0 | 6 | 0 |
| B | 0 | 7 | 0 |
| C | 0 | 7 | 0 |
| D | 0 | 7 | 0 |
| Quadrant | Total seconds | Saturated seconds | Saturation percentage |
|---|---|---|---|
| A | 3921 | 4 | 0.102015% |
| B | 3921 | 12 | 0.306044% |
| C | 3921 | 178 | 4.539658% |
| D | 3921 | 1806 | 46.059679% |
Noise dominated data is calculated using 1-second bins in cleaned event files. If a bin has >2000 counts, and if more than 50% of those come from <1% of pixels, then it is considered to be noise-dominated and hence unusable.
| Quadrant | # 1 sec bins | Bins with >0 counts | Bins with >2000 counts | High rate bins dominated by noise | Noise dominated (total time) | Noise dominated (detector-on time) | Marked lightcurve |
|---|---|---|---|---|---|---|---|
| A | 3921 | 3921 | 0 | 0 | 0.00% | 0.00% | 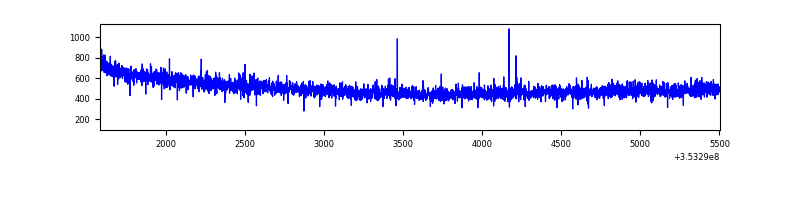 |
| B | 3921 | 3921 | 3 | 3 | 0.08% | 0.08% | 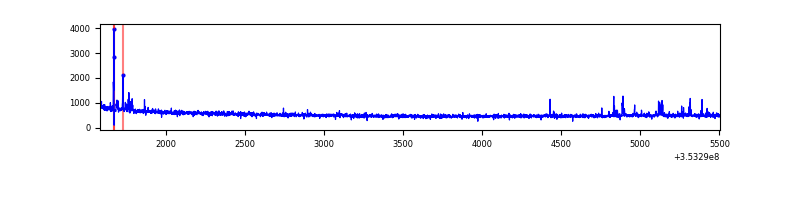 |
| C | 3921 | 3921 | 2 | 2 | 0.05% | 0.05% | 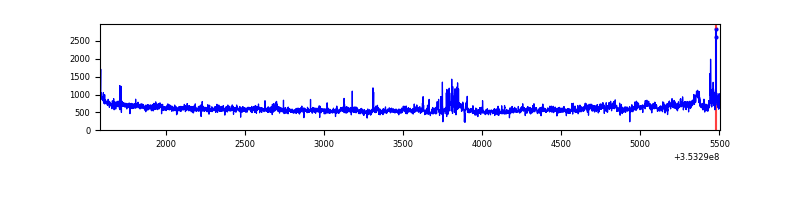 |
| D | 3921 | 3921 | 1916 | 1916 | 48.87% | 48.87% | 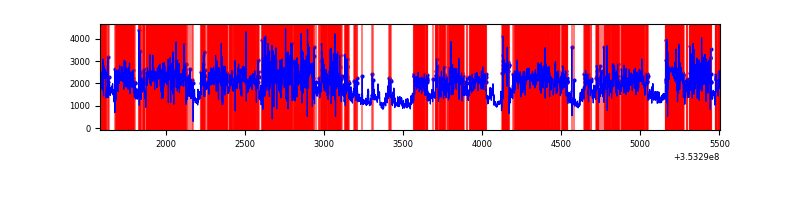 |
Top three noisy pixels from each quadrant. If the there are fewer than three noisy pixels in the level2.evt file, extra rows are filled as -1
| Pixel properties | Quadrant properties | ||||||
|---|---|---|---|---|---|---|---|
| Quadrant | DetID | PixID | Counts | Sigma | Mean | Median | Sigma |
| A | 13 | 254 | 7963 | 73.97 | 507 | 498 | 100.9 |
| A | 3 | 137 | 4505 | 39.7 | 507 | 498 | 100.9 |
| A | 0 | 226 | 4180 | 36.48 | 507 | 498 | 100.9 |
| B | 5 | 172 | 33720 | 352.08 | 510 | 497 | 94.4 |
| B | 0 | 190 | 31551 | 329.09 | 510 | 497 | 94.4 |
| B | 12 | 111 | 10663 | 107.73 | 510 | 497 | 94.4 |
| C | 3 | 233 | 292609 | 2555.17 | 492 | 497 | 114.3 |
| C | 14 | 238 | 117204 | 1020.86 | 492 | 497 | 114.3 |
| C | 14 | 254 | 52774 | 457.28 | 492 | 497 | 114.3 |
| D | 8 | 195 | 4113671 | 40999.75 | 430 | 422 | 100.3 |
| D | 1 | 52 | 721249 | 7185.01 | 430 | 422 | 100.3 |
| D | 7 | 238 | 589918 | 5875.94 | 430 | 422 | 100.3 |
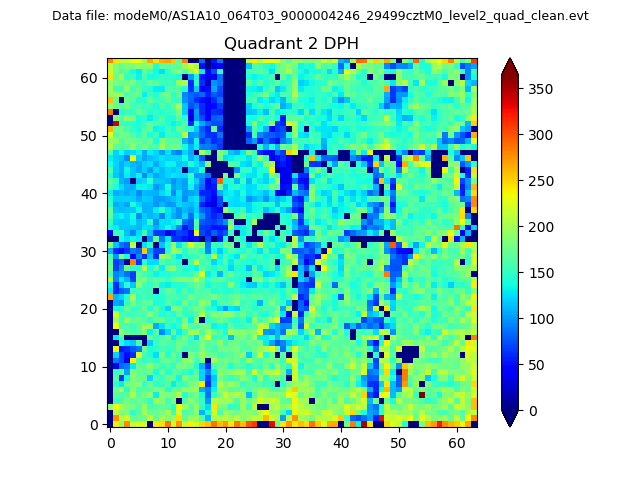
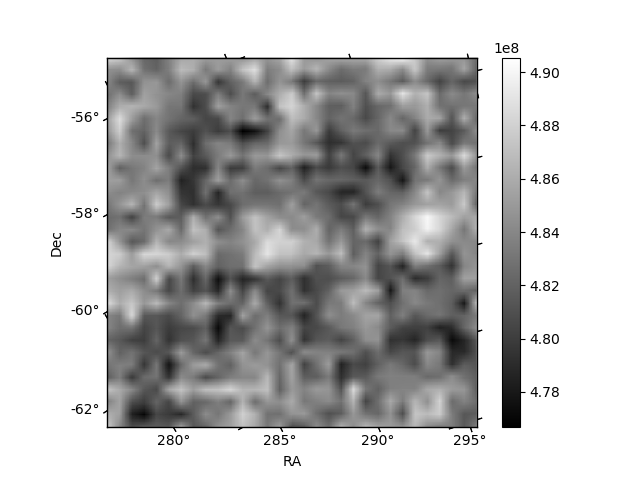
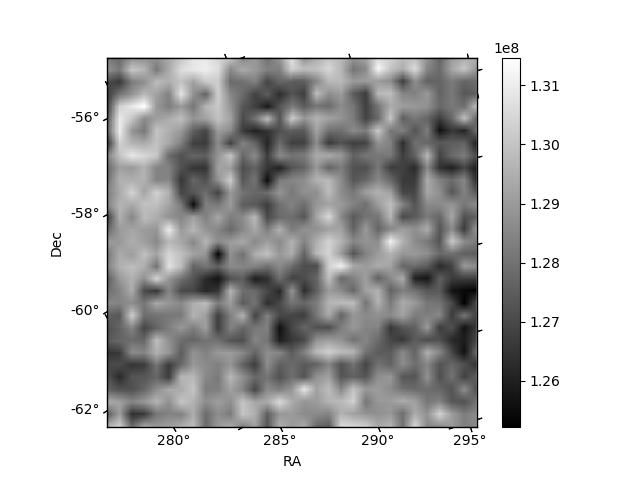
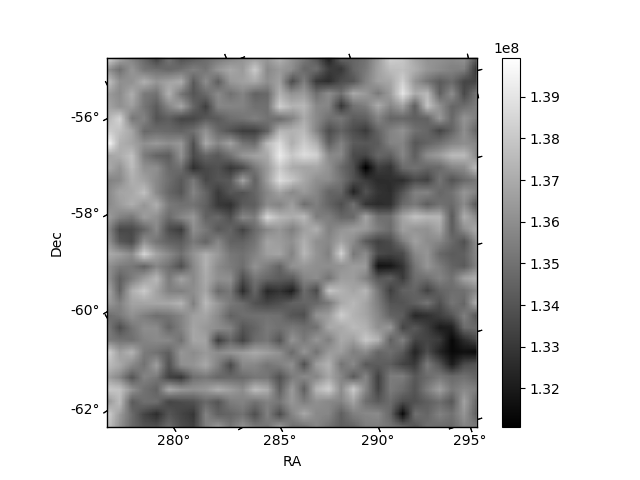
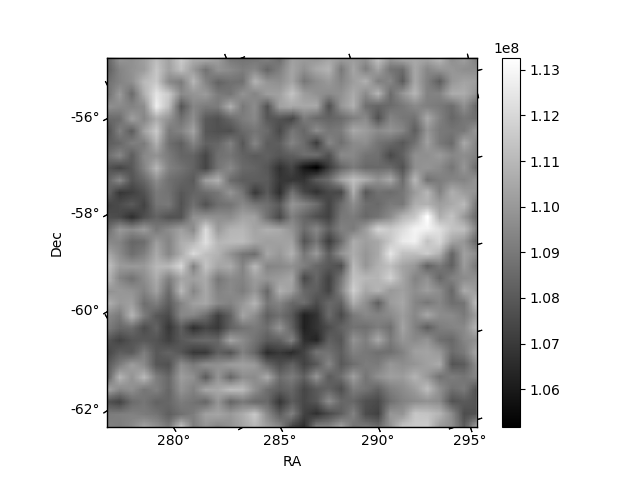
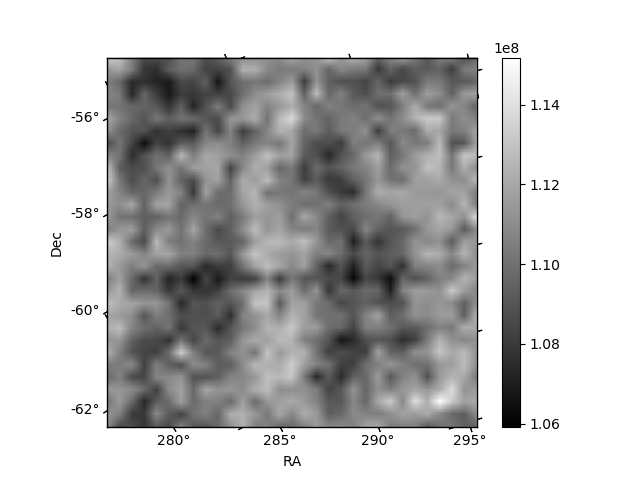
Histogram calculated using DETX and DETY for each event in the final _common_clean file
| Quadrant A | 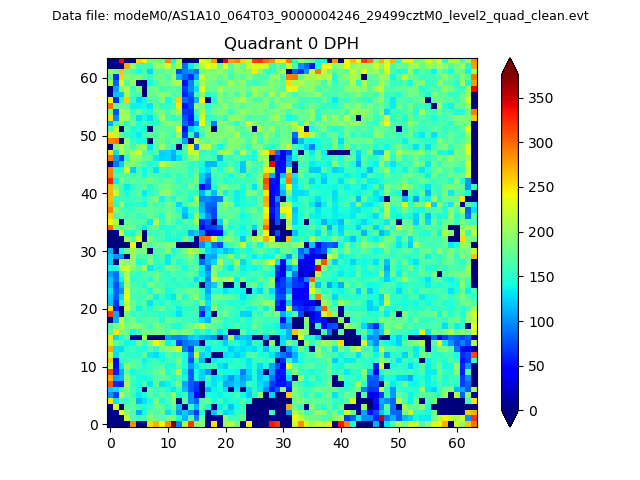 |
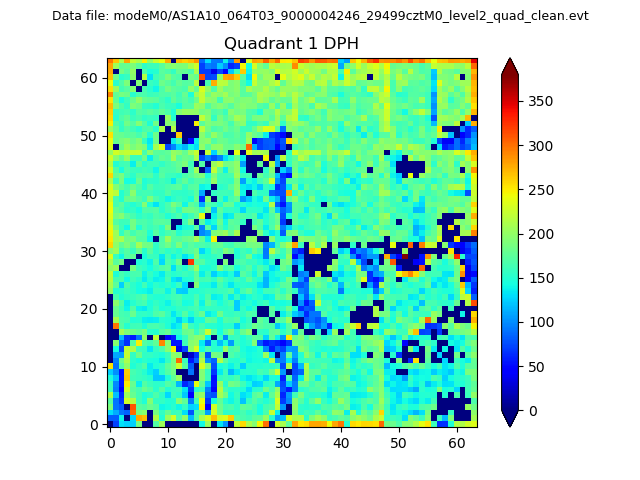 |
Quadrant B |
|---|---|---|---|
| Quadrant D | 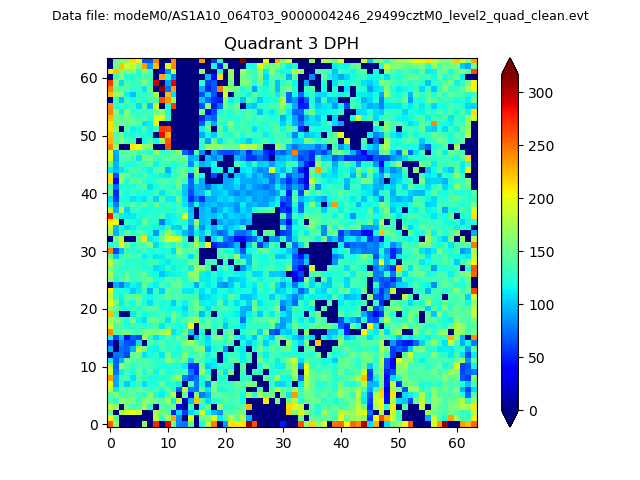 |
 |
Quadrant C |
| Plot type | Count rate plots | Images |
|---|---|---|
| Comparison with Poisson distribution Blue bars denote a histogram of data divided into 1 sec bins. Red curve is a Poisson curve with rate = median count rate of data. |
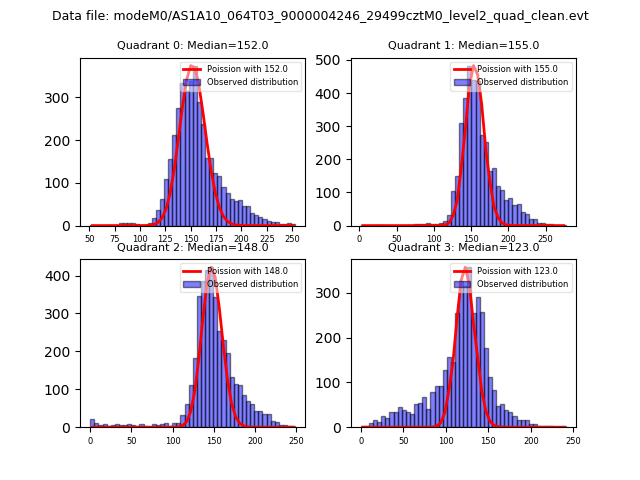 |
 |
| Quadrant-wise count rates Data is divided into 100 sec bins |
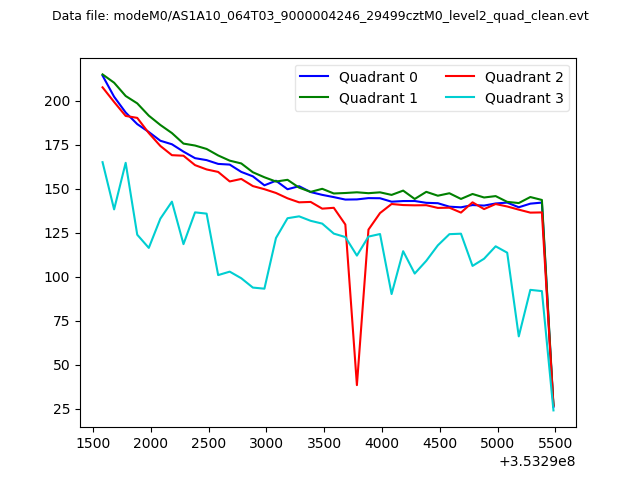 |
|
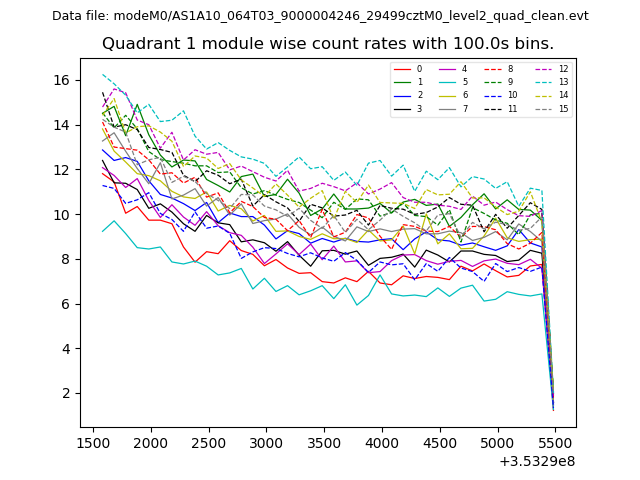
| Module-wise count rates for Quadrant A Data is divided into 100 sec bins |
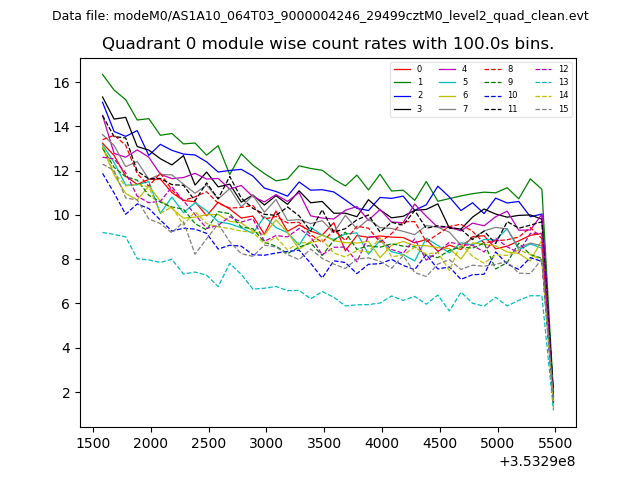 |
 |
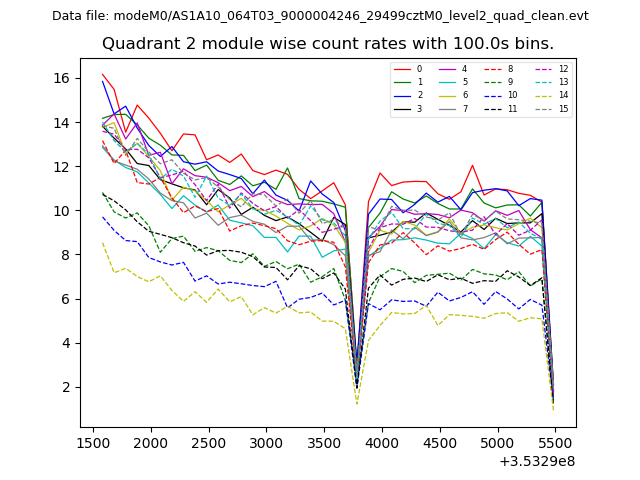
| Module-wise count rates for Quadrant B Data is divided into 100 sec bins |
 |
 |
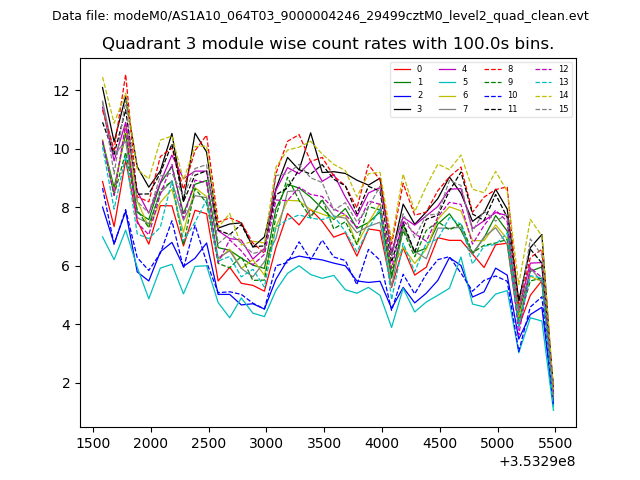
| Module-wise count rates for Quadrant C Data is divided into 100 sec bins |
 |
 |
| Module-wise count rates for Quadrant D Data is divided into 100 sec bins |
 |
 |
| Parameter | Plot |
|---|---|
| CZT HV Monitor | 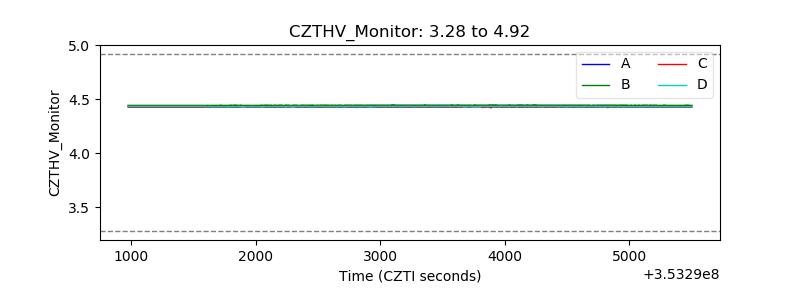 |
| D_VDD | 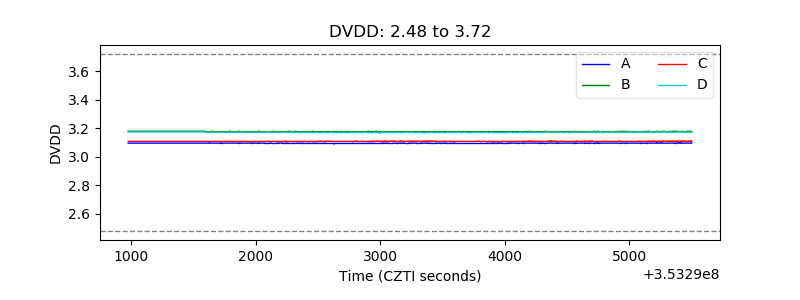 |
| Temperature 1 | 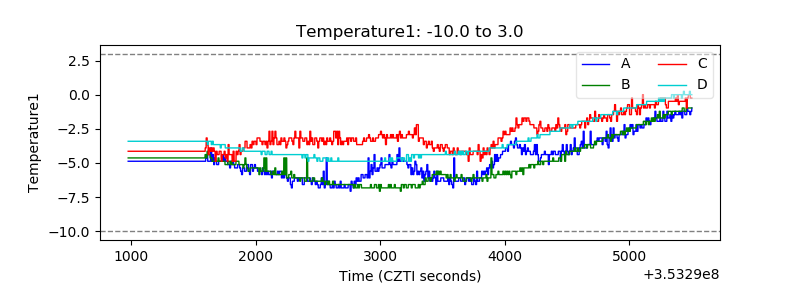 |
| Veto HV Monitor | 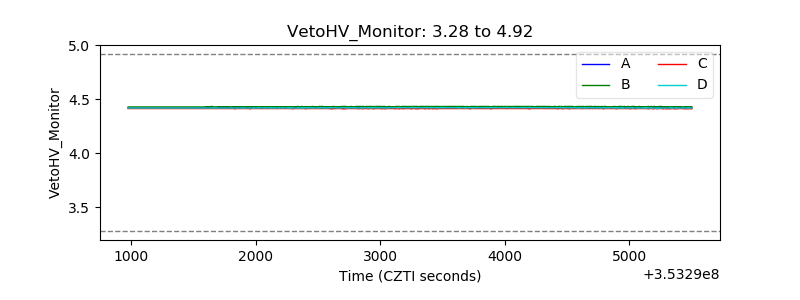 |
| Veto LLD |  |
| Alpha Counter | 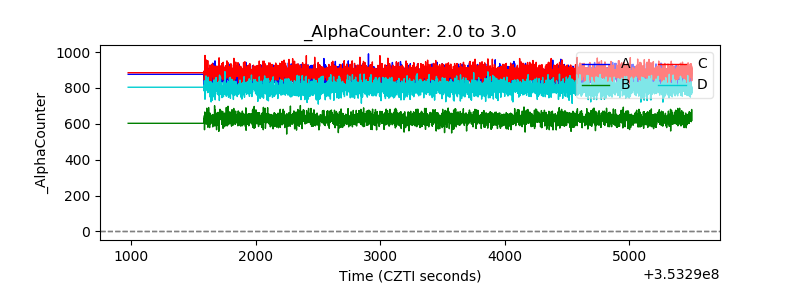 |
| _CPM_Rate | 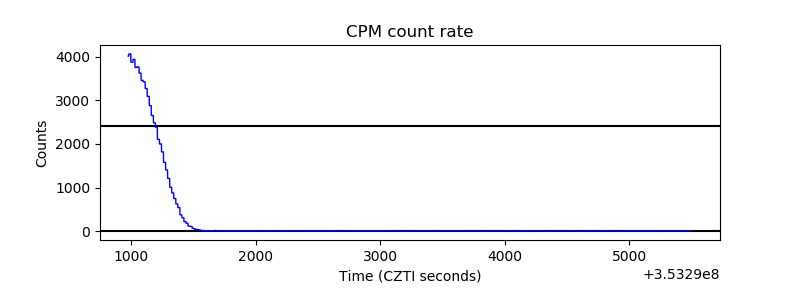 |
| CZT Counter | 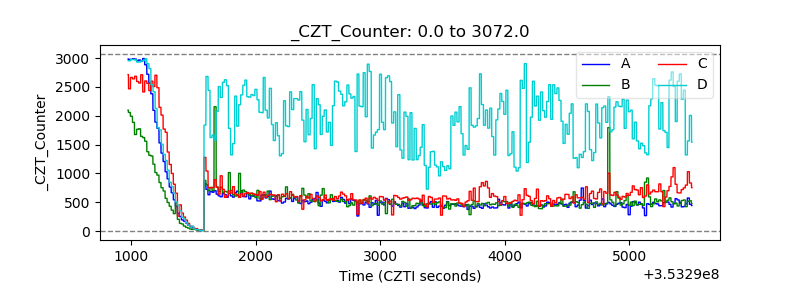 |
| +2.5 Volts monitor | 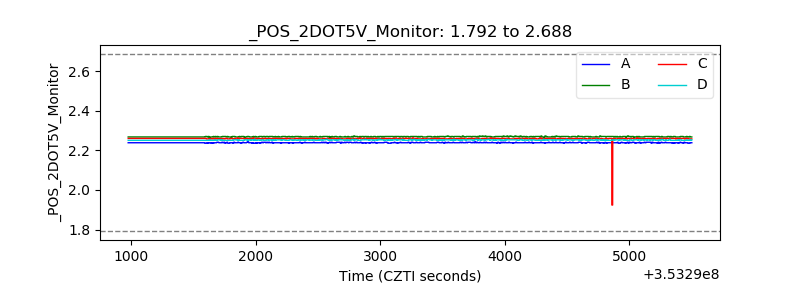 |
| +5 Volts monitor |  |
| _ROLL_ROT | 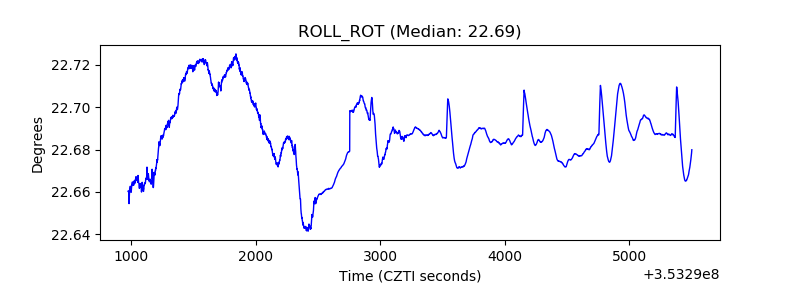 |
| _Roll_DEC | 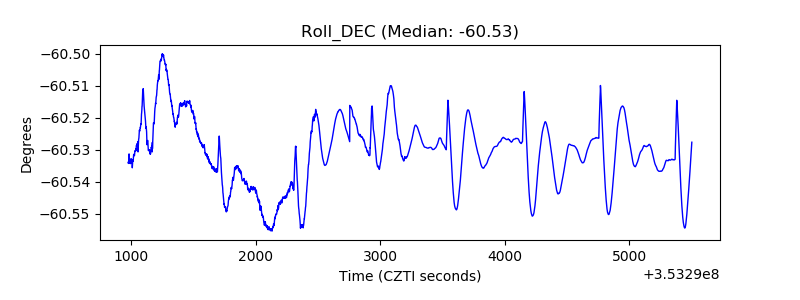 |
| _Roll_RA | 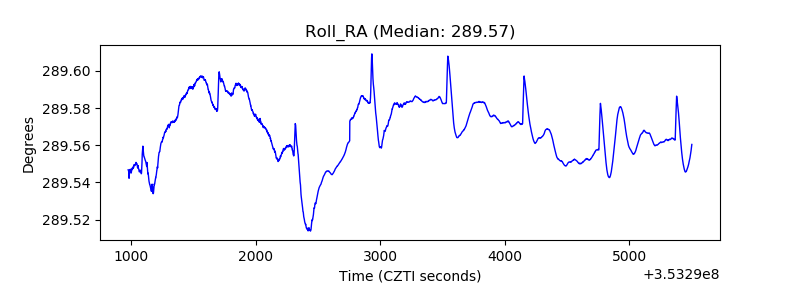 |
| Veto Counter | 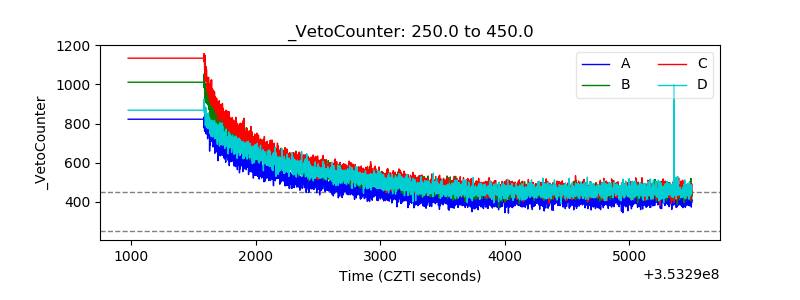 |