| Param | Original file | Final file |
|---|---|---|
| Filename | modeM0/AS1A10_094T05_9000004244cztM0_level2.fits | modeM0/AS1A10_094T05_9000004244cztM0_level2_quad_clean.evt |
| Size (bytes) | 34,934,400 | 24,494,400 |
| Size | 33.3 MB | 23.4 MB |
| Events in quadrant A | 220,468 | 142,570 |
| Events in quadrant B | 213,208 | 144,123 |
| Events in quadrant C | 214,716 | 134,696 |
| Events in quadrant D | 151,698 | 61,996 |
| Mode M0 | |||
|---|---|---|---|
| Quadrant | BADHDUFLAG | Total packets | Discarded packets |
| A | 0 | 7384 | 0 |
| B | 0 | 7552 | 0 |
| C | 0 | 7753 | 0 |
| D | 0 | 22040 | 0 |
| Mode M9 | |||
|---|---|---|---|
| Quadrant | BADHDUFLAG | Total packets | Discarded packets |
| A | 0 | 9 | 0 |
| B | 0 | 9 | 0 |
| C | 0 | 9 | 0 |
| D | 0 | 9 | 0 |
| Mode SS | |||
|---|---|---|---|
| Quadrant | BADHDUFLAG | Total packets | Discarded packets |
| A | 0 | 76 | 0 |
| B | 0 | 76 | 0 |
| C | 0 | 76 | 0 |
| D | 0 | 76 | 0 |
| Quadrant | Total seconds | Saturated seconds | Saturation percentage |
|---|---|---|---|
| A | 3631 | 10 | 0.275406% |
| B | 3631 | 18 | 0.495731% |
| C | 3631 | 35 | 0.963922% |
| D | 3631 | 1449 | 39.906362% |
Noise dominated data is calculated using 1-second bins in cleaned event files. If a bin has >2000 counts, and if more than 50% of those come from <1% of pixels, then it is considered to be noise-dominated and hence unusable.
| Quadrant | # 1 sec bins | Bins with >0 counts | Bins with >2000 counts | High rate bins dominated by noise | Noise dominated (total time) | Noise dominated (detector-on time) | Marked lightcurve |
|---|---|---|---|---|---|---|---|
| A | 4566 | 3632 | 0 | 0 | 0.00% | 0.00% | 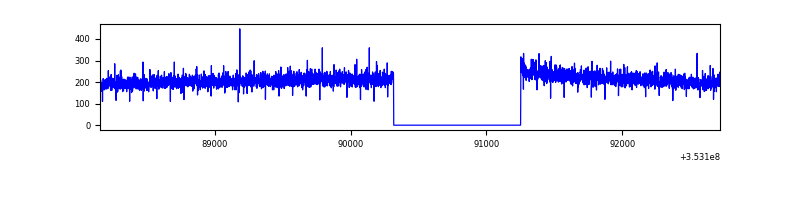 |
| B | 4566 | 3631 | 0 | 0 | 0.00% | 0.00% |  |
| C | 4566 | 3631 | 0 | 0 | 0.00% | 0.00% |  |
| D | 4566 | 3598 | 0 | 0 | 0.00% | 0.00% |  |
Top three noisy pixels from each quadrant. If the there are fewer than three noisy pixels in the level2.evt file, extra rows are filled as -1
| Pixel properties | Quadrant properties | ||||||
|---|---|---|---|---|---|---|---|
| Quadrant | DetID | PixID | Counts | Sigma | Mean | Median | Sigma |
| A | 0 | 29 | 212 | 9.74 | 57 | 54 | 16.2 |
| A | 7 | 110 | 172 | 7.27 | 57 | 54 | 16.2 |
| A | 0 | 30 | 171 | 7.21 | 57 | 54 | 16.2 |
| B | 2 | 9 | 164 | 8.19 | 56 | 54 | 13.4 |
| B | 2 | 8 | 154 | 7.44 | 56 | 54 | 13.4 |
| B | 5 | 225 | 145 | 6.77 | 56 | 54 | 13.4 |
| C | 12 | 241 | 170 | 7.18 | 56 | 53 | 16.3 |
| C | 9 | 242 | 163 | 6.75 | 56 | 53 | 16.3 |
| C | 3 | 187 | 158 | 6.44 | 56 | 53 | 16.3 |
| D | 4 | 246 | 121 | 6.25 | 43 | 39 | 13.1 |
| D | 7 | 3 | 119 | 6.1 | 43 | 39 | 13.1 |
| D | 3 | 14 | 119 | 6.1 | 43 | 39 | 13.1 |
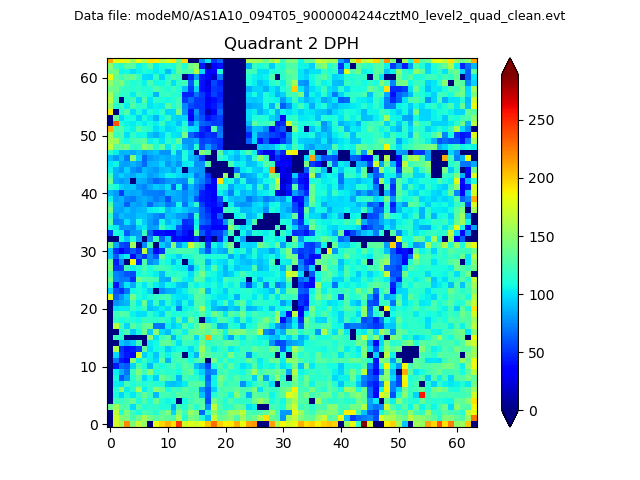
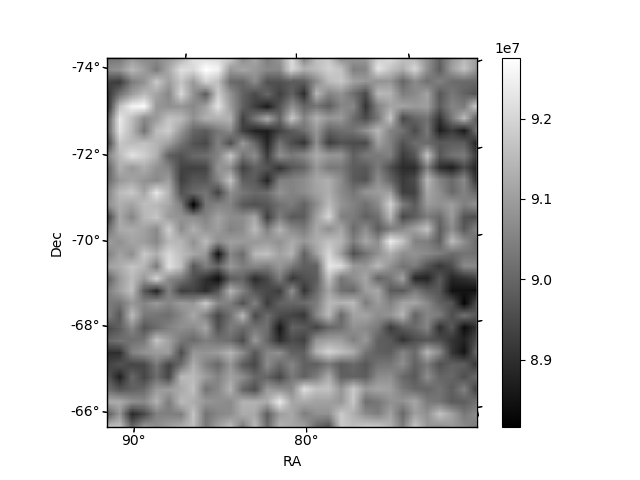
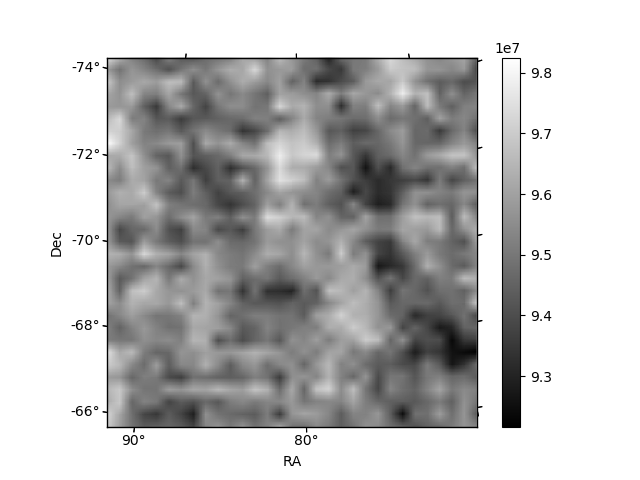
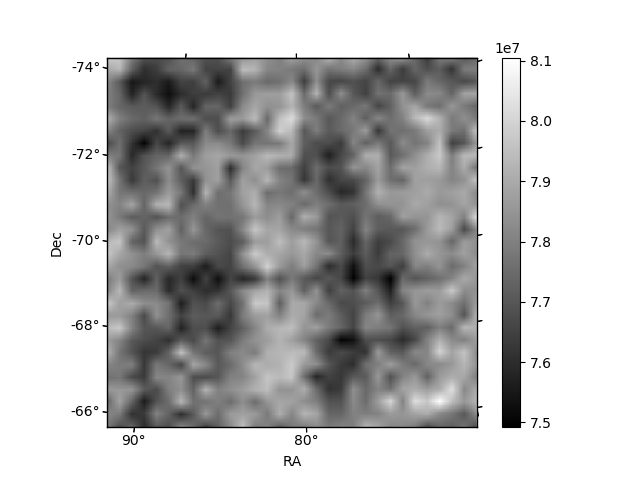
Histogram calculated using DETX and DETY for each event in the final _common_clean file
| Quadrant A | 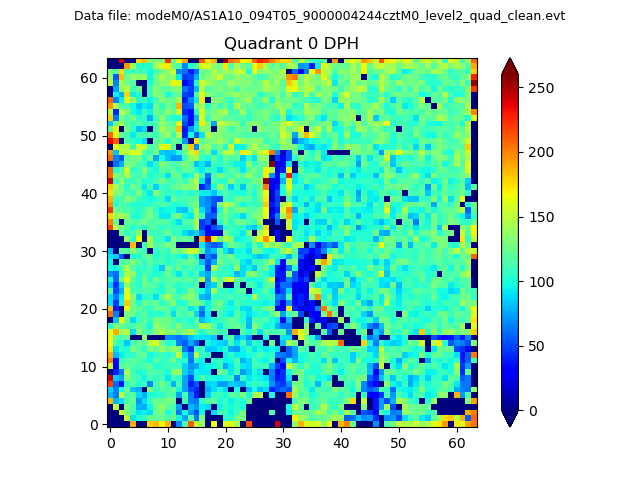 |
 |
Quadrant B |
|---|---|---|---|
| Quadrant D |  |
 |
Quadrant C |
| Plot type | Count rate plots | Images |
|---|---|---|
| Comparison with Poisson distribution Blue bars denote a histogram of data divided into 1 sec bins. Red curve is a Poisson curve with rate = median count rate of data. |
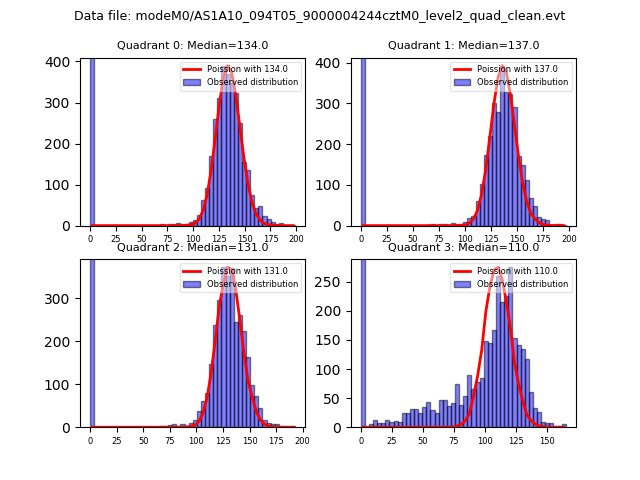 |
 |
| Quadrant-wise count rates Data is divided into 100 sec bins |
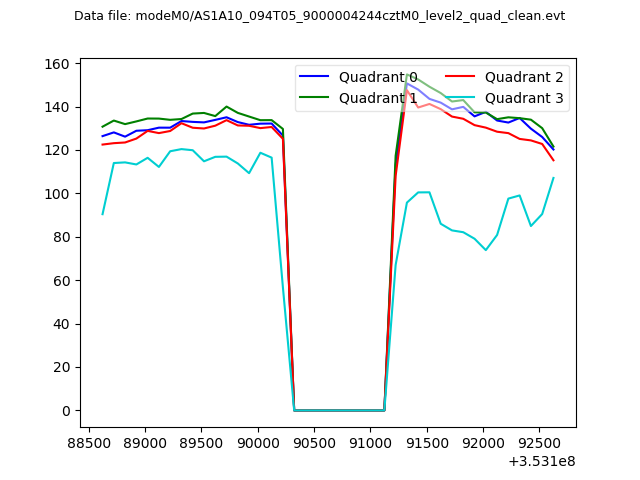 |
|
| Module-wise count rates for Quadrant A Data is divided into 100 sec bins |
 |
 |
| Module-wise count rates for Quadrant B Data is divided into 100 sec bins |
 |
 |
| Module-wise count rates for Quadrant C Data is divided into 100 sec bins |
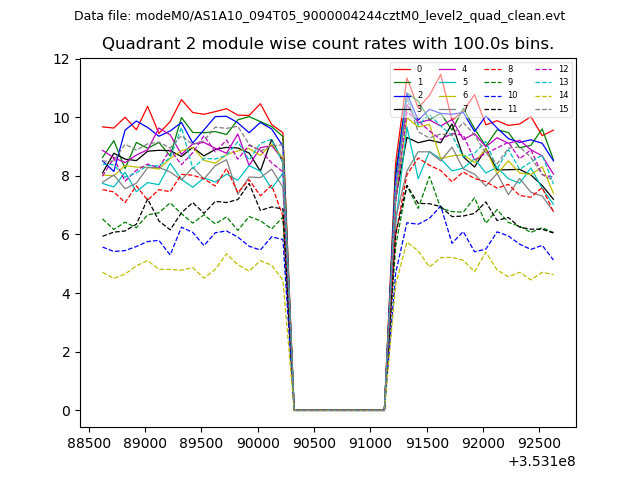 |
 |
| Module-wise count rates for Quadrant D Data is divided into 100 sec bins |
 |
 |
| Parameter | Plot |
|---|---|
| CZT HV Monitor | 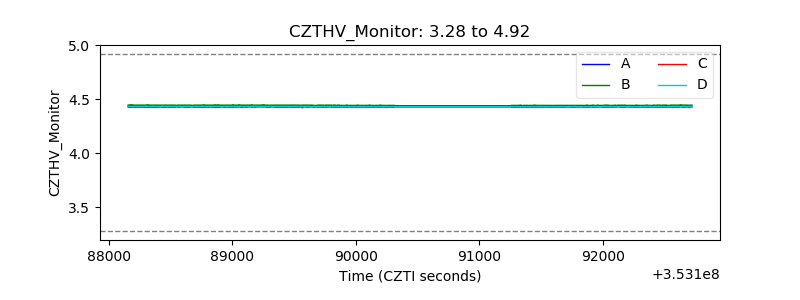 |
| D_VDD | 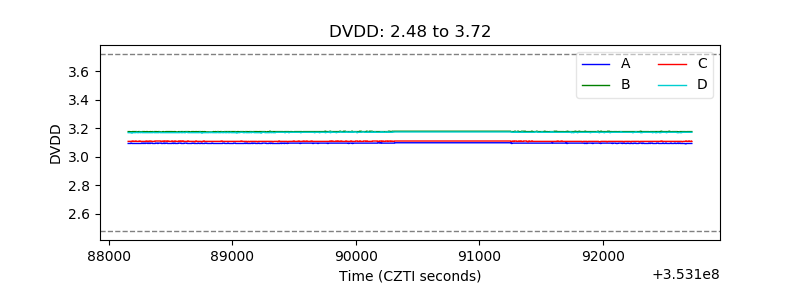 |
| Temperature 1 |  |
| Veto HV Monitor |  |
| Veto LLD | 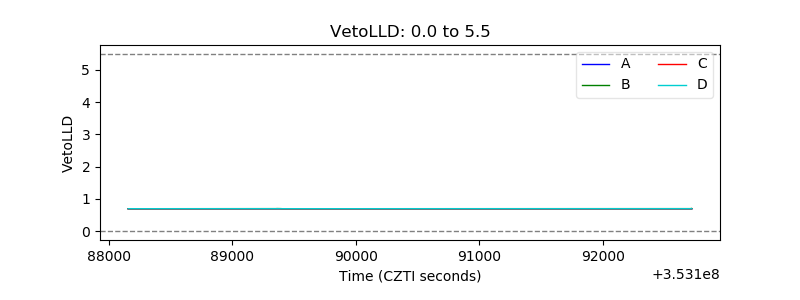 |
| Alpha Counter | 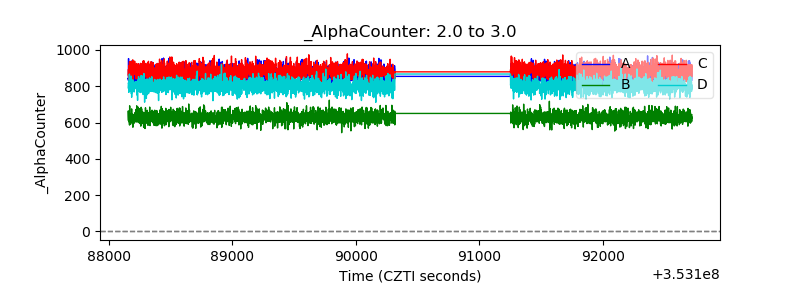 |
| _CPM_Rate |  |
| CZT Counter |  |
| +2.5 Volts monitor |  |
| +5 Volts monitor |  |
| _ROLL_ROT |  |
| _Roll_DEC |  |
| _Roll_RA |  |
| Veto Counter |  |