| Param | Original file | Final file |
|---|---|---|
| Filename | modeM0/AS1A10_048T05_9000004250_29502cztM0_level2.evt | modeM0/AS1A10_048T05_9000004250_29502cztM0_level2_quad_clean.evt |
| Size (bytes) | 131,523,840 | 24,307,200 |
| Size | 125.4 MB | 23.2 MB |
| Events in quadrant A | 677,107 | 162,194 |
| Events in quadrant B | 687,741 | 167,590 |
| Events in quadrant C | 711,721 | 162,998 |
| Events in quadrant D | 1,816,520 | 145,947 |
| Mode SS | |||
|---|---|---|---|
| Quadrant | BADHDUFLAG | Total packets | Discarded packets |
| A | 0 | 26 | 0 |
| B | 0 | 26 | 0 |
| C | 0 | 26 | 0 |
| D | 0 | 26 | 0 |
| Mode M9 | |||
|---|---|---|---|
| Quadrant | BADHDUFLAG | Total packets | Discarded packets |
| A | 0 | 6 | 0 |
| B | 0 | 6 | 0 |
| C | 0 | 6 | 0 |
| D | 0 | 6 | 0 |
| Mode M0 | |||
|---|---|---|---|
| Quadrant | BADHDUFLAG | Total packets | Discarded packets |
| A | 0 | 2728 | 1 |
| B | 0 | 2765 | 1 |
| C | 0 | 2815 | 1 |
| D | 0 | 6300 | 4 |
| Quadrant | Total seconds | Saturated seconds | Saturation percentage |
|---|---|---|---|
| A | 1290 | 25 | 1.937984% |
| B | 1290 | 25 | 1.937984% |
| C | 1290 | 31 | 2.403101% |
| D | 1289 | 120 | 9.309542% |
Noise dominated data is calculated using 1-second bins in cleaned event files. If a bin has >2000 counts, and if more than 50% of those come from <1% of pixels, then it is considered to be noise-dominated and hence unusable.
| Quadrant | # 1 sec bins | Bins with >0 counts | Bins with >2000 counts | High rate bins dominated by noise | Noise dominated (total time) | Noise dominated (detector-on time) | Marked lightcurve |
|---|---|---|---|---|---|---|---|
| A | 1290 | 1290 | 0 | 0 | 0.00% | 0.00% | 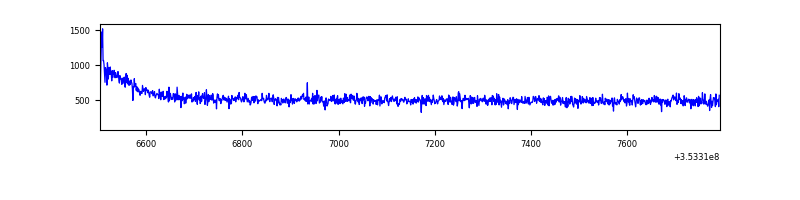 |
| B | 1290 | 1290 | 0 | 0 | 0.00% | 0.00% | 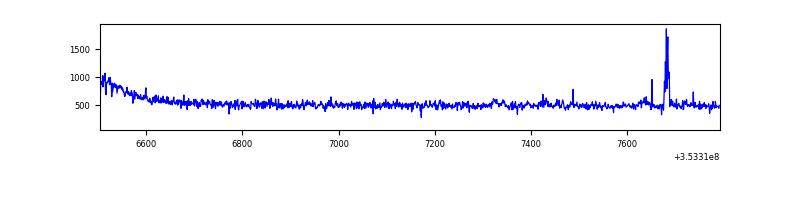 |
| C | 1290 | 1290 | 1 | 1 | 0.08% | 0.08% | 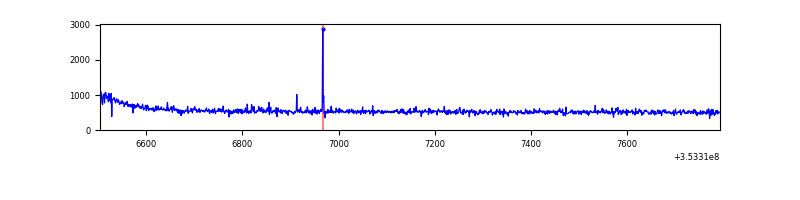 |
| D | 1289 | 1289 | 120 | 120 | 9.31% | 9.31% | 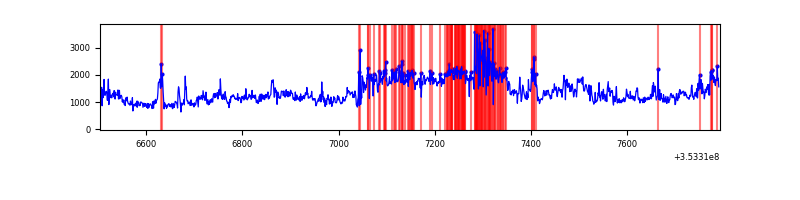 |
Top three noisy pixels from each quadrant. If the there are fewer than three noisy pixels in the level2.evt file, extra rows are filled as -1
| Pixel properties | Quadrant properties | ||||||
|---|---|---|---|---|---|---|---|
| Quadrant | DetID | PixID | Counts | Sigma | Mean | Median | Sigma |
| A | 14 | 254 | 3300 | 83.74 | 174 | 171 | 37.4 |
| A | 13 | 254 | 2205 | 54.43 | 174 | 171 | 37.4 |
| A | 3 | 137 | 1554 | 37.01 | 174 | 171 | 37.4 |
| B | 0 | 190 | 11179 | 307.52 | 171 | 167 | 35.8 |
| B | 12 | 111 | 3825 | 102.15 | 171 | 167 | 35.8 |
| B | 11 | 111 | 3515 | 93.5 | 171 | 167 | 35.8 |
| C | 14 | 238 | 27245 | 658.1 | 169 | 171 | 41.1 |
| C | 3 | 233 | 20537 | 495.05 | 169 | 171 | 41.1 |
| C | 2 | 114 | 3189 | 73.36 | 169 | 171 | 41.1 |
| D | 8 | 195 | 887121 | 21374.17 | 166 | 161 | 41.5 |
| D | 7 | 238 | 251280 | 6051.52 | 166 | 161 | 41.5 |
| D | 13 | 153 | 22962 | 549.46 | 166 | 161 | 41.5 |
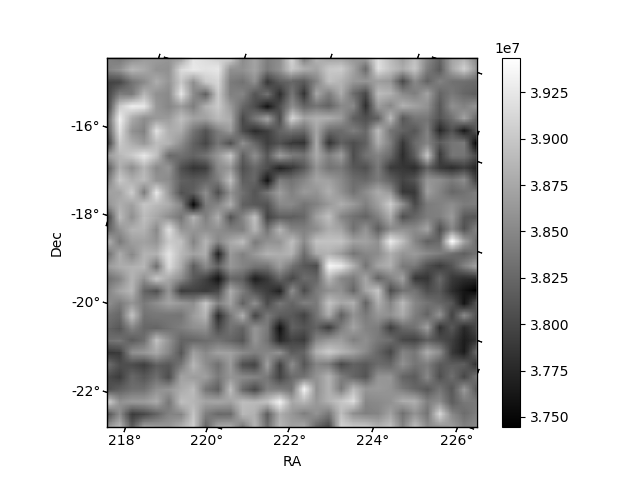
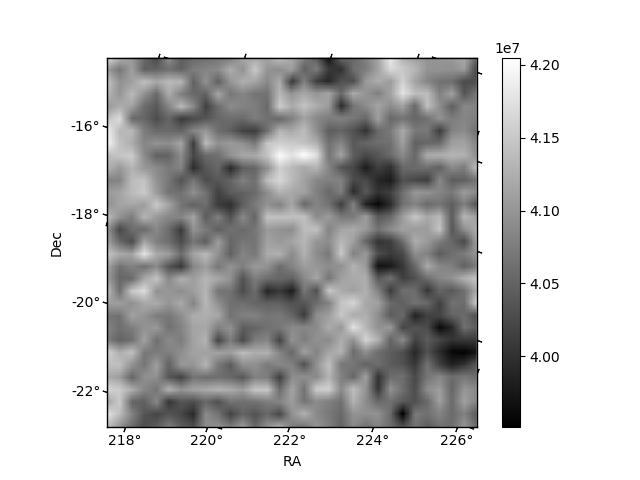
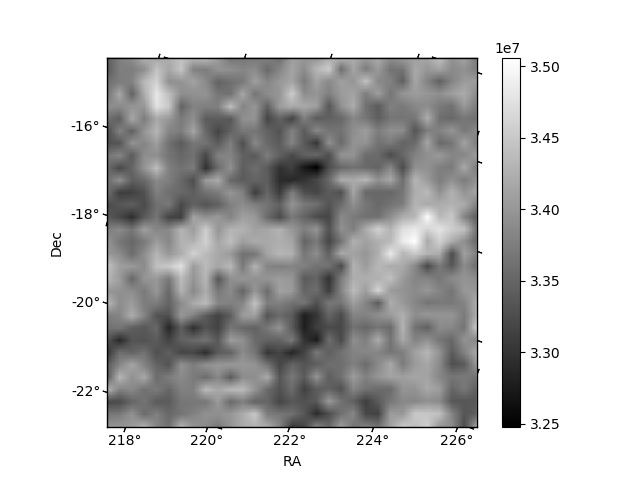
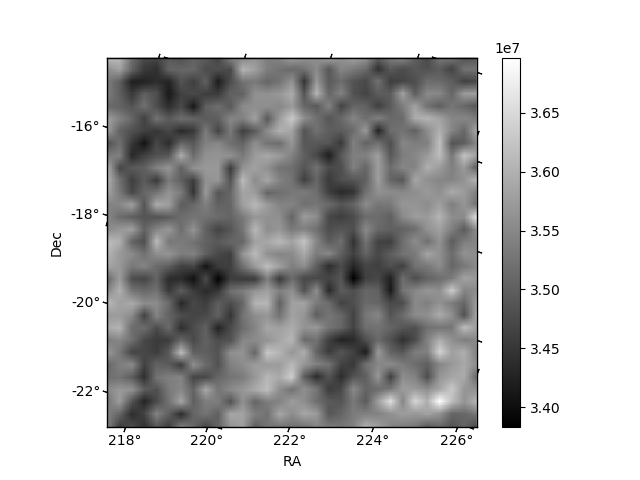
Histogram calculated using DETX and DETY for each event in the final _common_clean file
| Quadrant A |  |
 |
Quadrant B |
|---|---|---|---|
| Quadrant D |  |
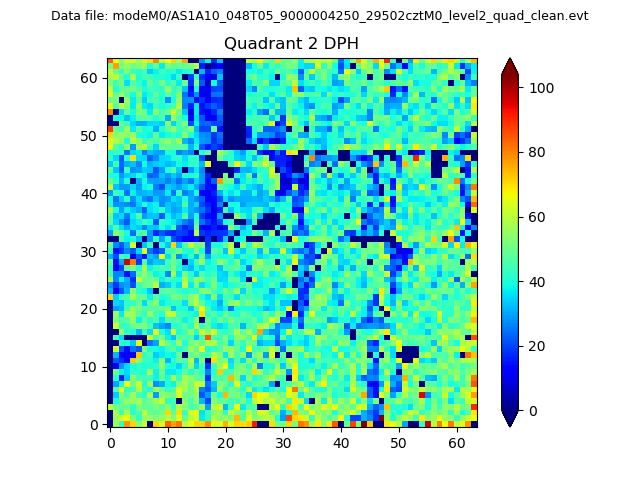 |
Quadrant C |
| Plot type | Count rate plots | Images |
|---|---|---|
| Comparison with Poisson distribution Blue bars denote a histogram of data divided into 1 sec bins. Red curve is a Poisson curve with rate = median count rate of data. |
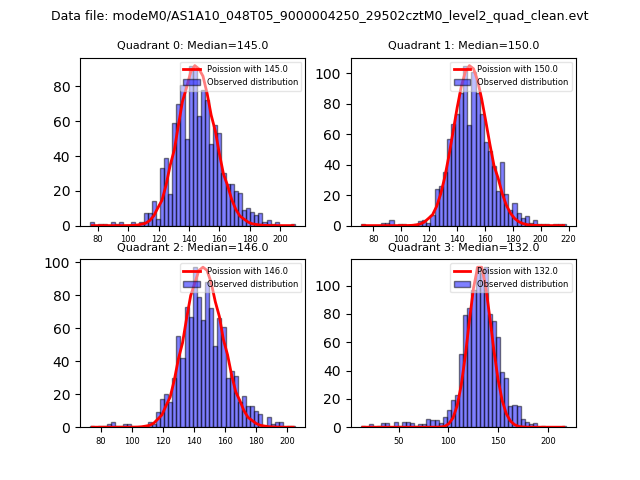 |
 |
| Quadrant-wise count rates Data is divided into 100 sec bins |
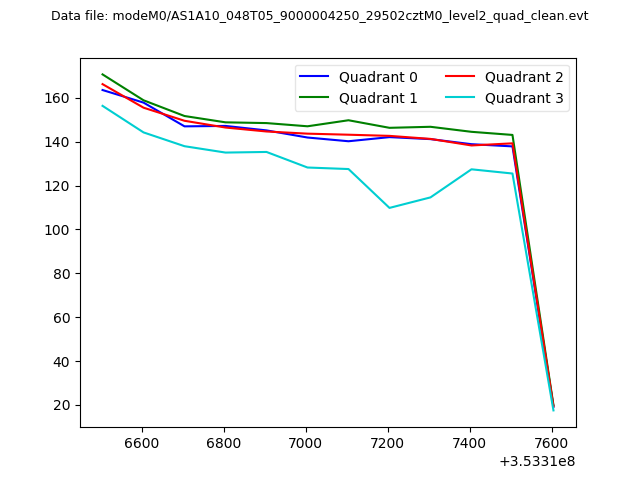 |
|
| Module-wise count rates for Quadrant A Data is divided into 100 sec bins |
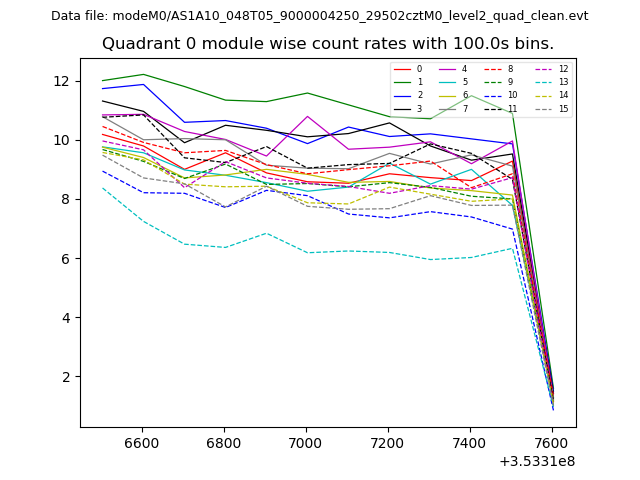 |
 |
| Module-wise count rates for Quadrant B Data is divided into 100 sec bins |
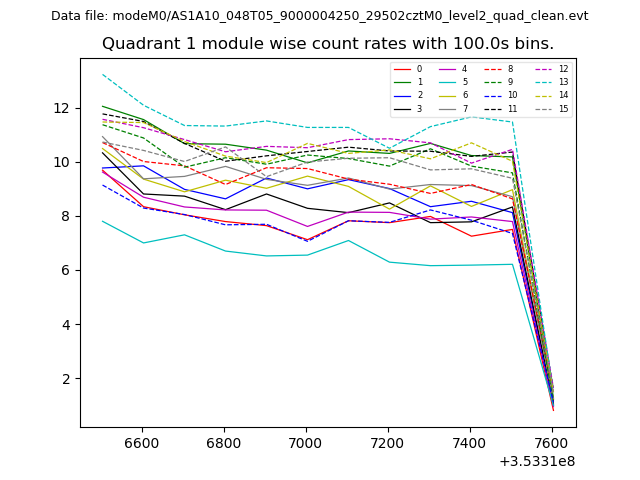 |
 |
| Module-wise count rates for Quadrant C Data is divided into 100 sec bins |
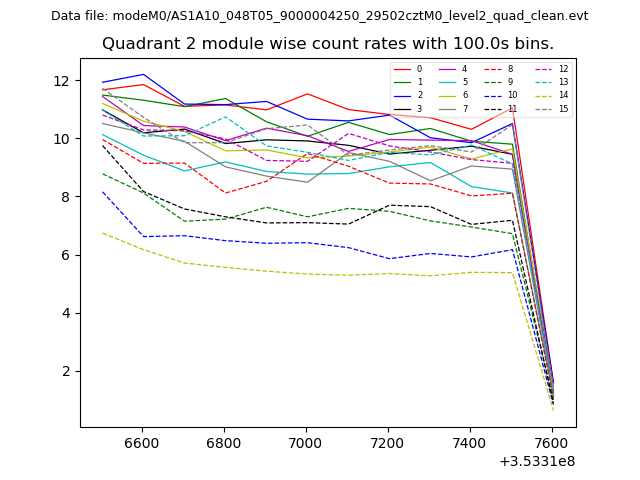 |
 |
| Module-wise count rates for Quadrant D Data is divided into 100 sec bins |
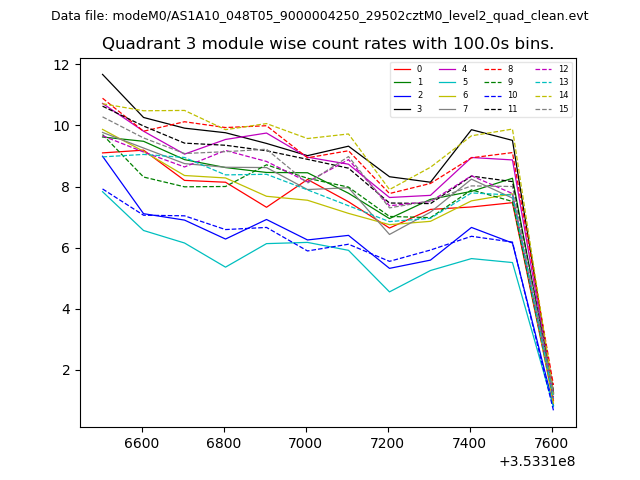 |
 |
| Parameter | Plot |
|---|---|
| CZT HV Monitor | 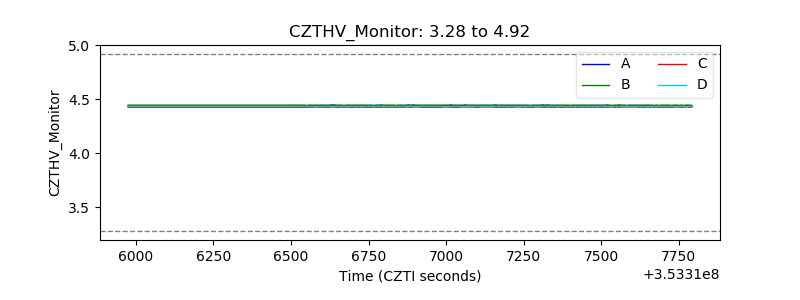 |
| D_VDD | 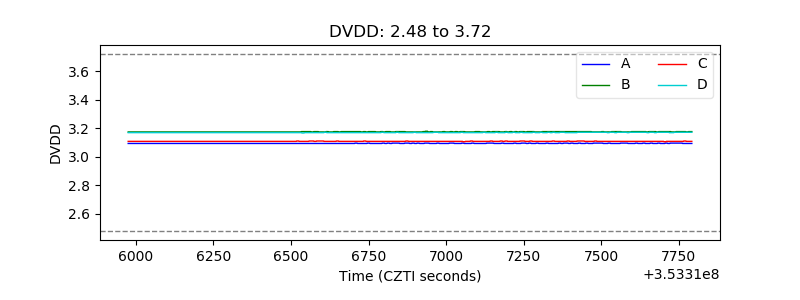 |
| Temperature 1 | 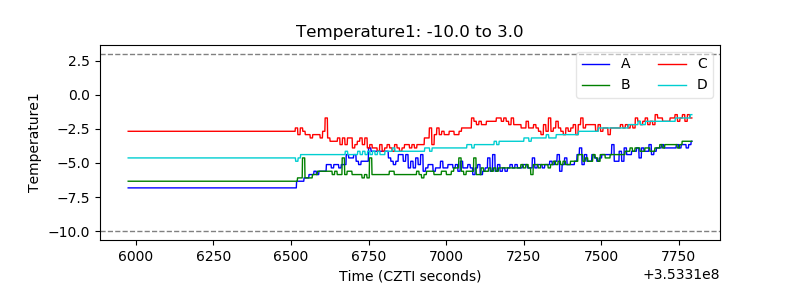 |
| Veto HV Monitor | 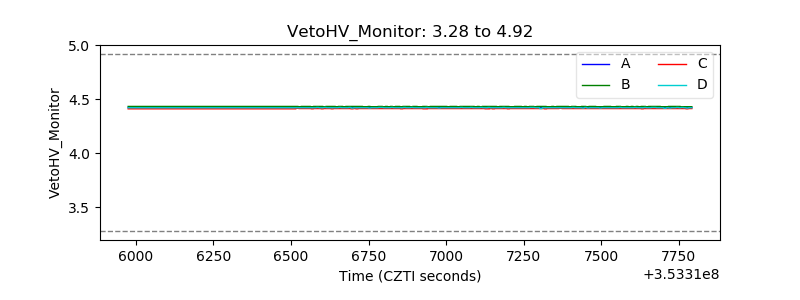 |
| Veto LLD | 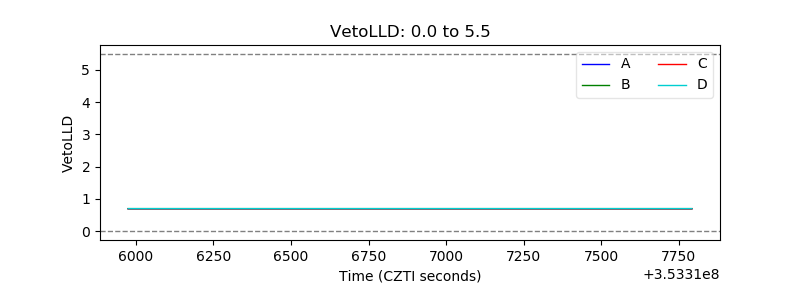 |
| Alpha Counter | 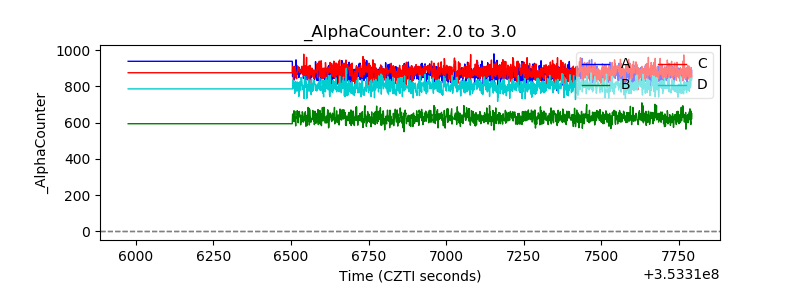 |
| _CPM_Rate | 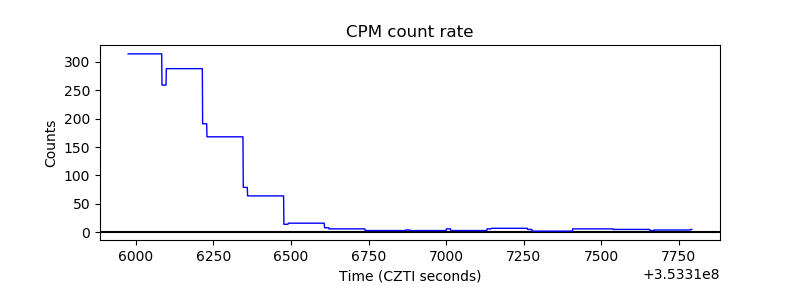 |
| CZT Counter | 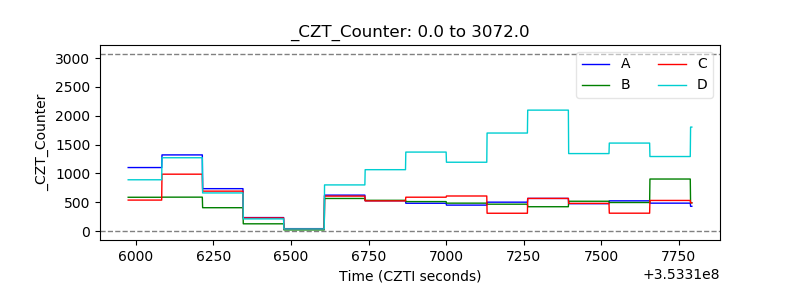 |
| +2.5 Volts monitor |  |
| +5 Volts monitor | 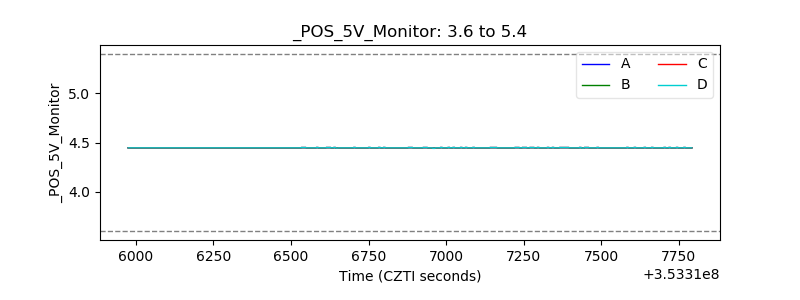 |
| _ROLL_ROT | 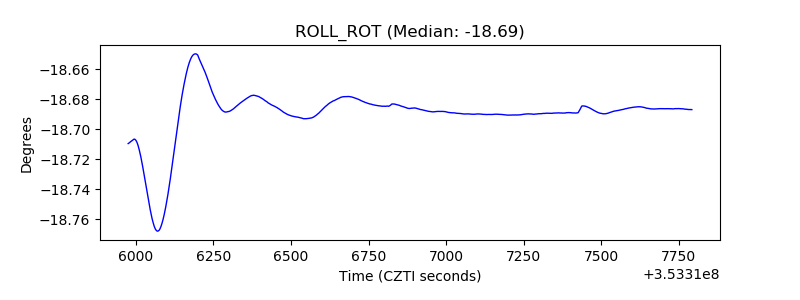 |
| _Roll_DEC | 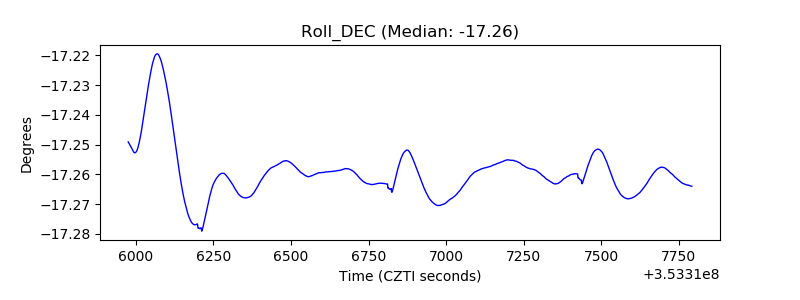 |
| _Roll_RA | 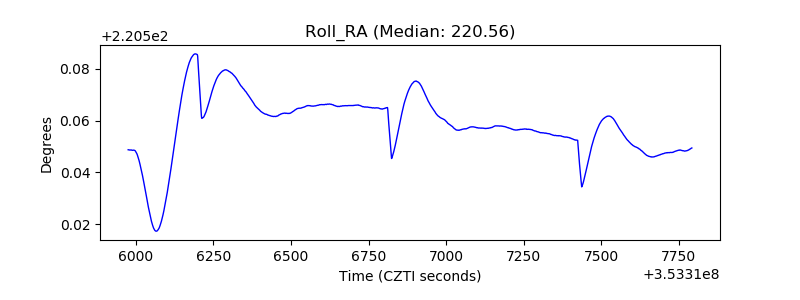 |
| Veto Counter | 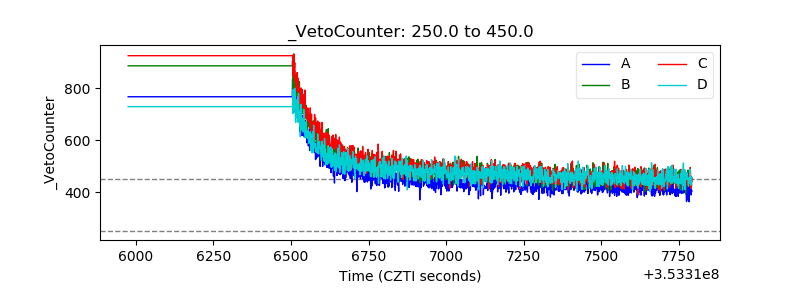 |