| Param | Original file | Final file |
|---|---|---|
| Filename | modeM0/AS1A10_048T05_9000004250_29503cztM0_level2.evt | modeM0/AS1A10_048T05_9000004250_29503cztM0_level2_quad_clean.evt |
| Size (bytes) | 775,062,720 | 78,039,360 |
| Size | 739.2 MB | 74.4 MB |
| Events in quadrant A | 3,259,590 | 499,331 |
| Events in quadrant B | 3,450,581 | 506,444 |
| Events in quadrant C | 3,763,001 | 488,666 |
| Events in quadrant D | 12,554,511 | 408,194 |
| Mode SS | |||
|---|---|---|---|
| Quadrant | BADHDUFLAG | Total packets | Discarded packets |
| A | 0 | 134 | 0 |
| B | 0 | 134 | 0 |
| C | 0 | 134 | 0 |
| D | 0 | 134 | 0 |
| Mode M9 | |||
|---|---|---|---|
| Quadrant | BADHDUFLAG | Total packets | Discarded packets |
| A | 0 | 6 | 0 |
| B | 0 | 6 | 0 |
| C | 0 | 6 | 0 |
| D | 0 | 6 | 0 |
| Mode M0 | |||
|---|---|---|---|
| Quadrant | BADHDUFLAG | Total packets | Discarded packets |
| A | 0 | 13576 | 1 |
| B | 0 | 14131 | 1 |
| C | 0 | 14895 | 1 |
| D | 0 | 41861 | 1 |
| Quadrant | Total seconds | Saturated seconds | Saturation percentage |
|---|---|---|---|
| A | 6590 | 146 | 2.215478% |
| B | 6590 | 198 | 3.004552% |
| C | 6590 | 286 | 4.339909% |
| D | 6590 | 3039 | 46.115326% |
Noise dominated data is calculated using 1-second bins in cleaned event files. If a bin has >2000 counts, and if more than 50% of those come from <1% of pixels, then it is considered to be noise-dominated and hence unusable.
| Quadrant | # 1 sec bins | Bins with >0 counts | Bins with >2000 counts | High rate bins dominated by noise | Noise dominated (total time) | Noise dominated (detector-on time) | Marked lightcurve |
|---|---|---|---|---|---|---|---|
| A | 7175 | 6591 | 0 | 0 | 0.00% | 0.00% | 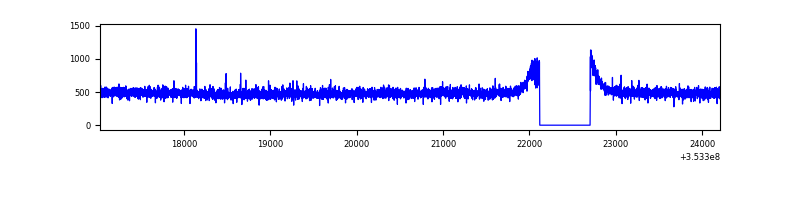 |
| B | 7175 | 6591 | 41 | 41 | 0.57% | 0.62% | 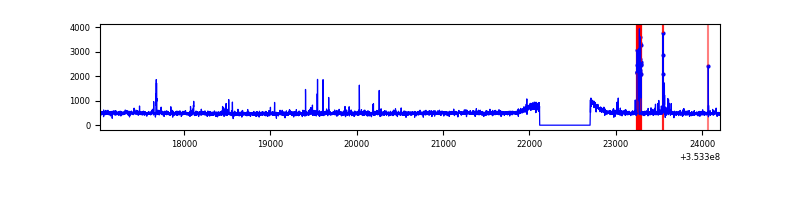 |
| C | 7175 | 6591 | 17 | 17 | 0.24% | 0.26% | 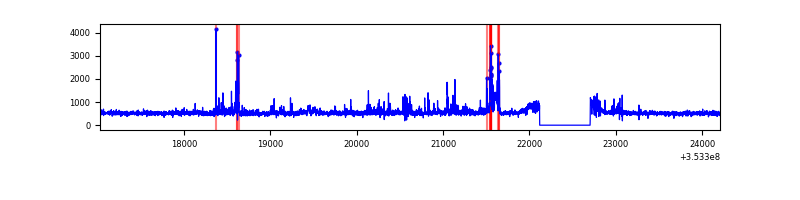 |
| D | 7175 | 6591 | 2995 | 2995 | 41.74% | 45.44% | 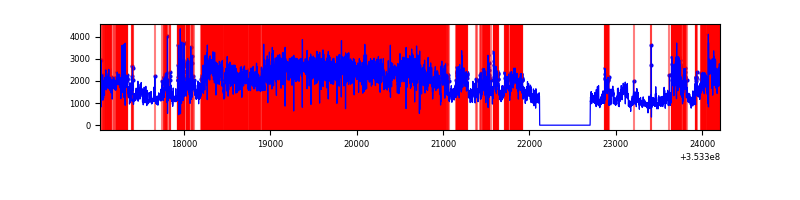 |
Top three noisy pixels from each quadrant. If the there are fewer than three noisy pixels in the level2.evt file, extra rows are filled as -1
| Pixel properties | Quadrant properties | ||||||
|---|---|---|---|---|---|---|---|
| Quadrant | DetID | PixID | Counts | Sigma | Mean | Median | Sigma |
| A | 13 | 254 | 12354 | 67.58 | 843 | 824 | 170.6 |
| A | 3 | 137 | 8024 | 42.2 | 843 | 824 | 170.6 |
| A | 0 | 226 | 7127 | 36.94 | 843 | 824 | 170.6 |
| B | 15 | 222 | 121281 | 751.18 | 831 | 809 | 160.4 |
| B | 0 | 190 | 30959 | 188.0 | 831 | 809 | 160.4 |
| B | 12 | 111 | 19273 | 115.13 | 831 | 809 | 160.4 |
| C | 3 | 233 | 226751 | 1194.92 | 809 | 816 | 189.1 |
| C | 7 | 247 | 186705 | 983.13 | 809 | 816 | 189.1 |
| C | 14 | 238 | 151886 | 798.98 | 809 | 816 | 189.1 |
| D | 8 | 195 | 5766152 | 34698.68 | 695 | 678 | 166.2 |
| D | 12 | 33 | 3559706 | 21419.5 | 695 | 678 | 166.2 |
| D | 7 | 238 | 481081 | 2891.24 | 695 | 678 | 166.2 |
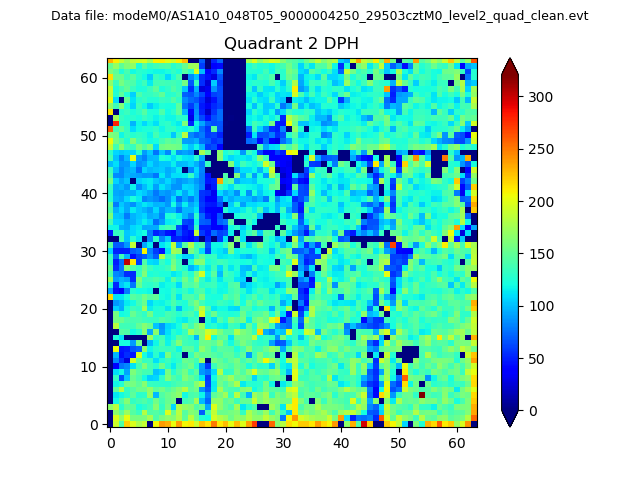
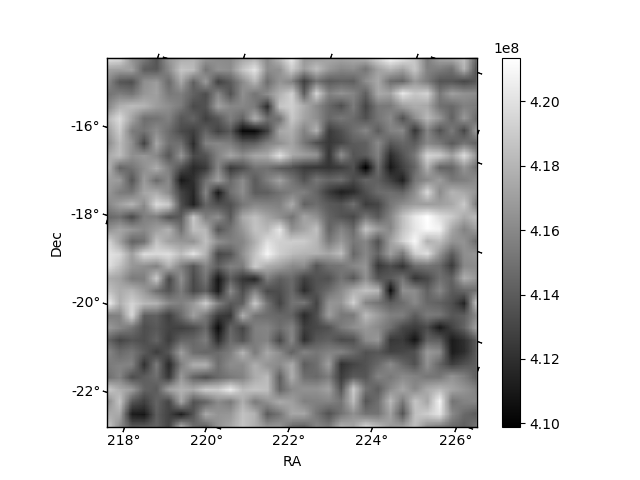
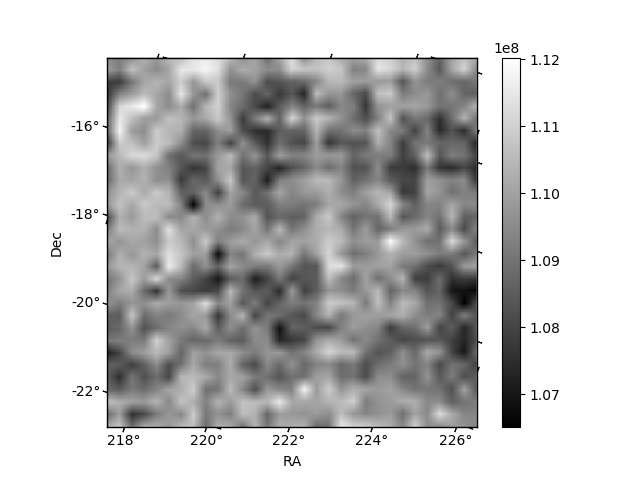
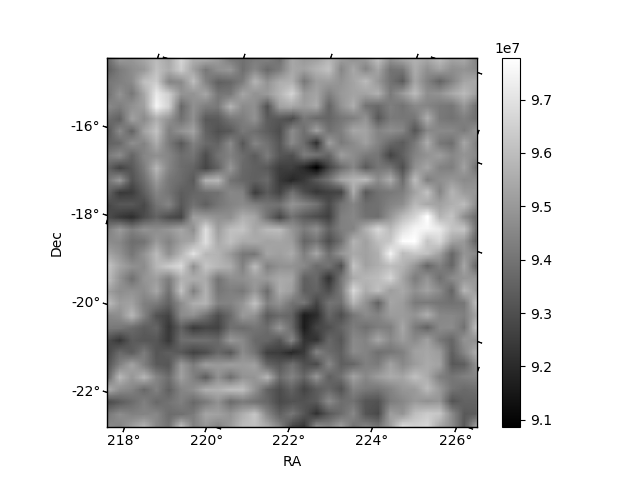
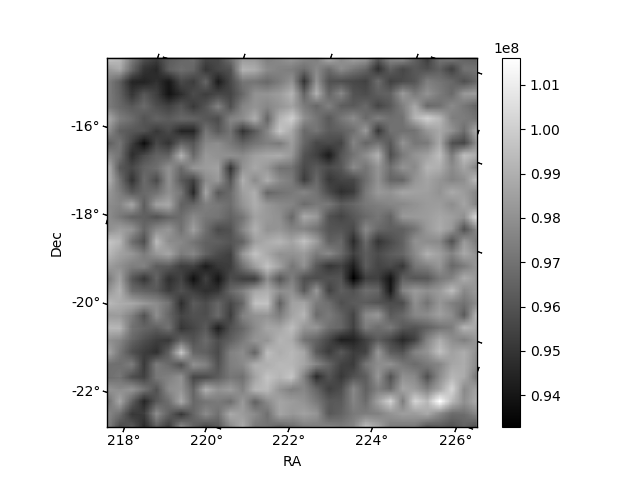
Histogram calculated using DETX and DETY for each event in the final _common_clean file
| Quadrant A | 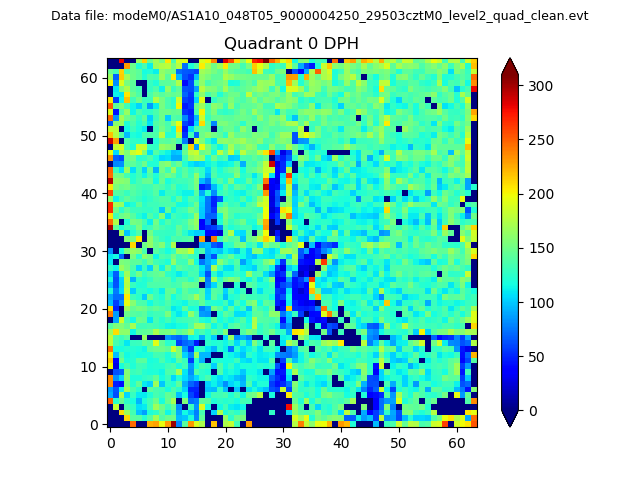 |
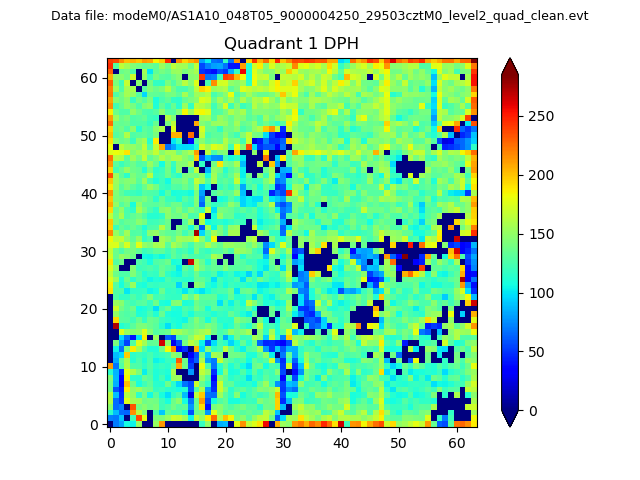 |
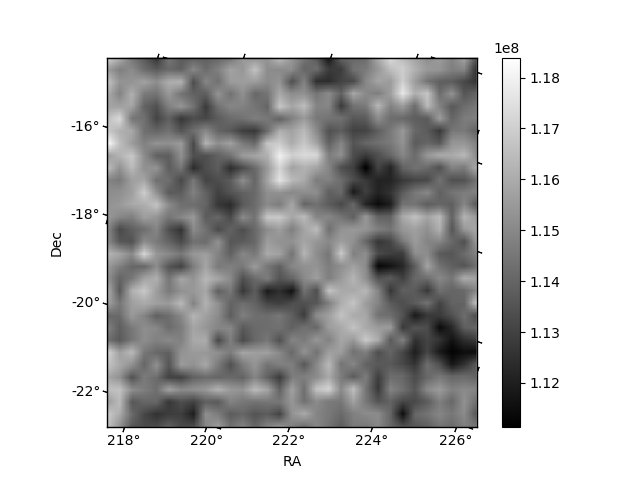
Quadrant B |
|---|---|---|---|
| Quadrant D | 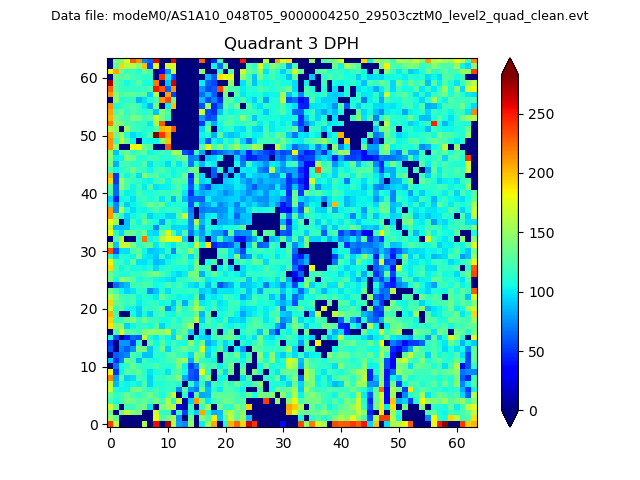 |
 |
Quadrant C |
| Plot type | Count rate plots | Images |
|---|---|---|
| Comparison with Poisson distribution Blue bars denote a histogram of data divided into 1 sec bins. Red curve is a Poisson curve with rate = median count rate of data. |
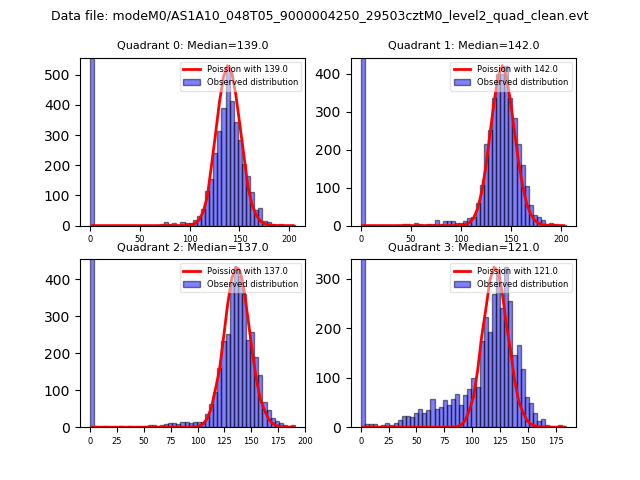 |
 |
| Quadrant-wise count rates Data is divided into 100 sec bins |
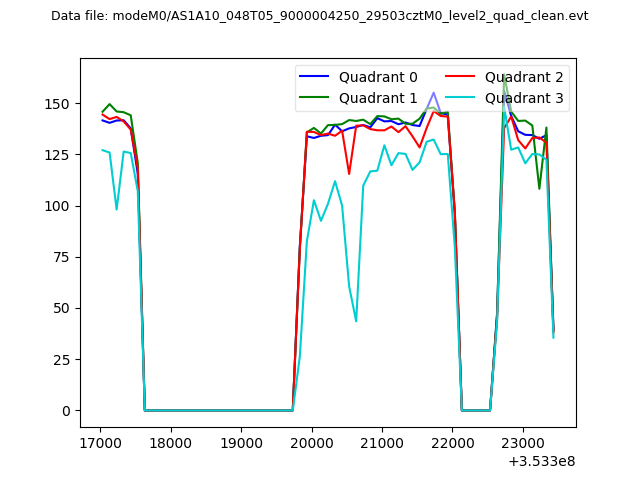 |
|
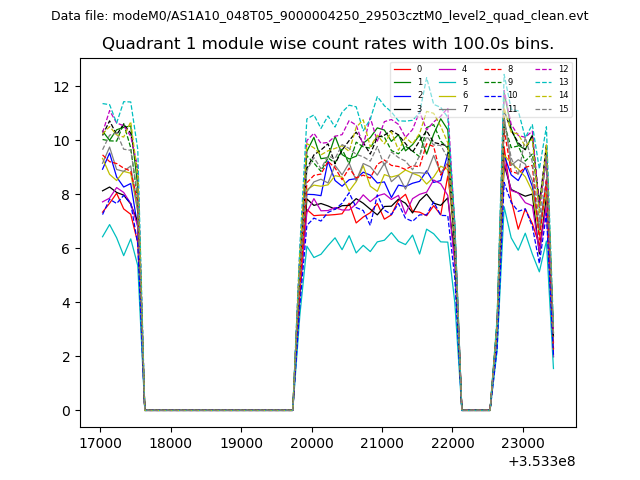
| Module-wise count rates for Quadrant A Data is divided into 100 sec bins |
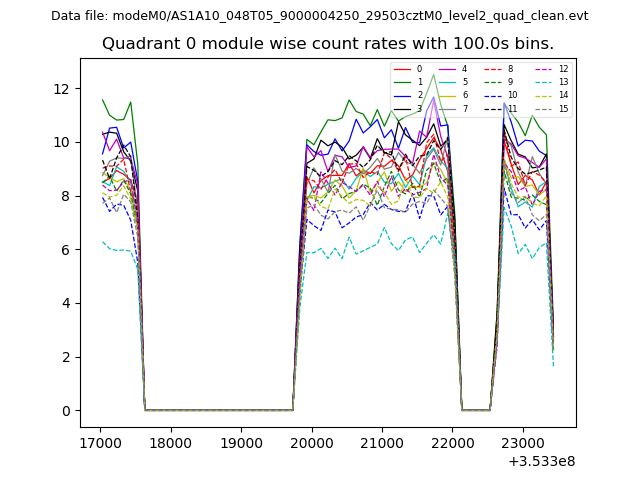 |
 |
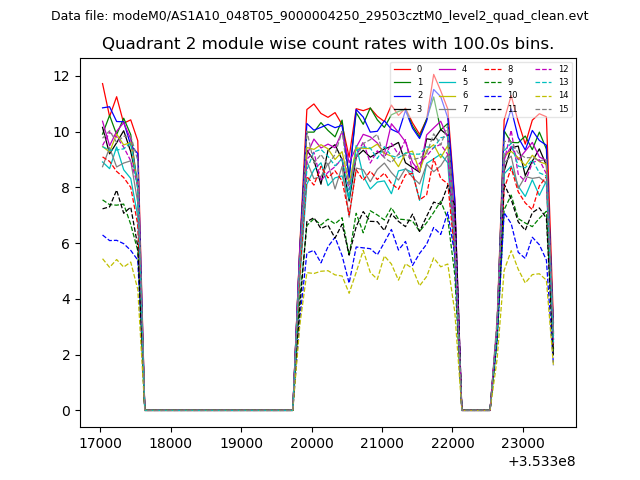
| Module-wise count rates for Quadrant B Data is divided into 100 sec bins |
 |
 |
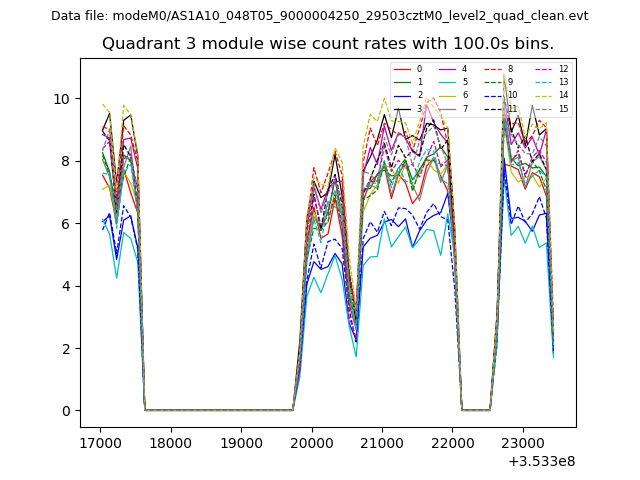
| Module-wise count rates for Quadrant C Data is divided into 100 sec bins |
 |
 |
| Module-wise count rates for Quadrant D Data is divided into 100 sec bins |
 |
 |
| Parameter | Plot |
|---|---|
| CZT HV Monitor | 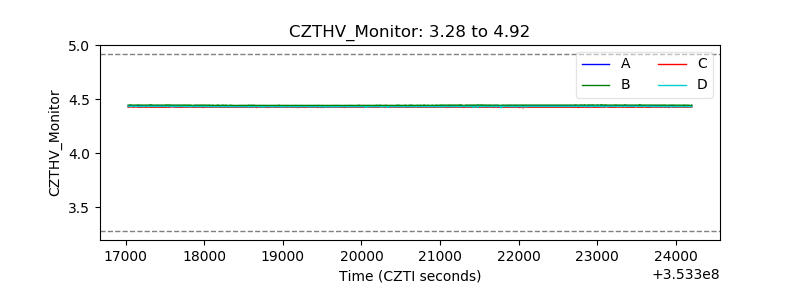 |
| D_VDD | 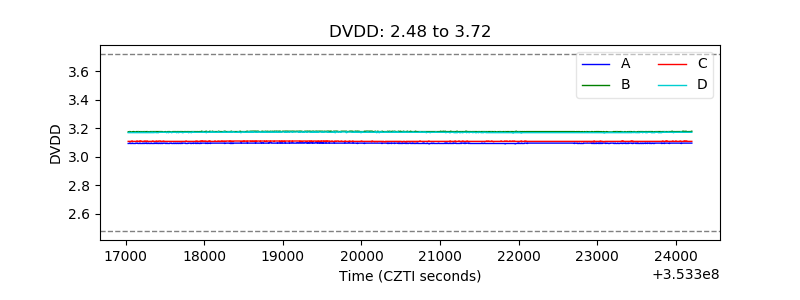 |
| Temperature 1 |  |
| Veto HV Monitor | 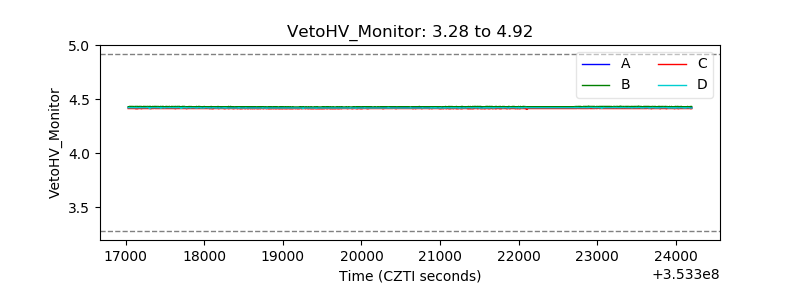 |
| Veto LLD | 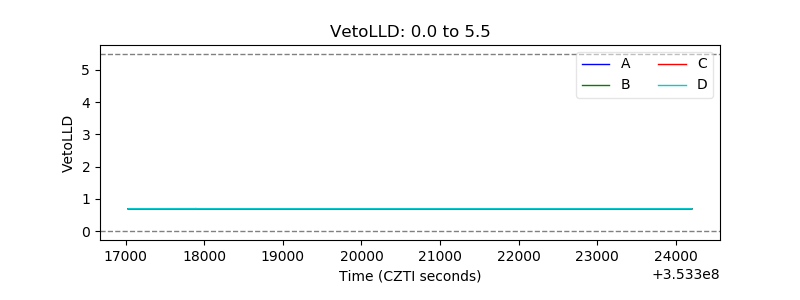 |
| Alpha Counter | 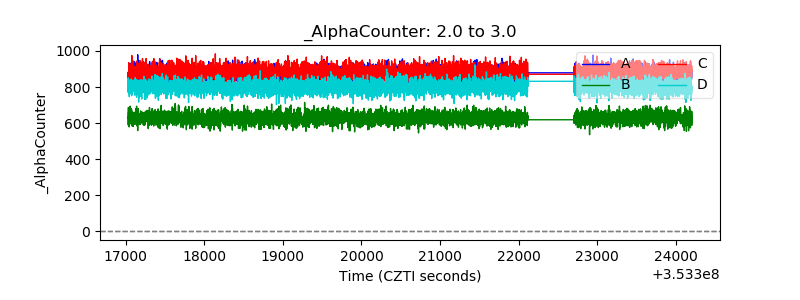 |
| _CPM_Rate | 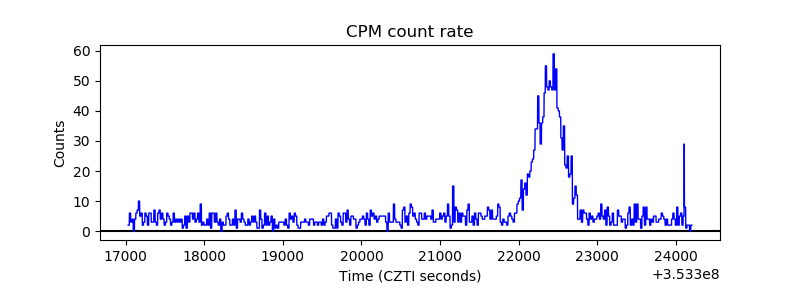 |
| CZT Counter | 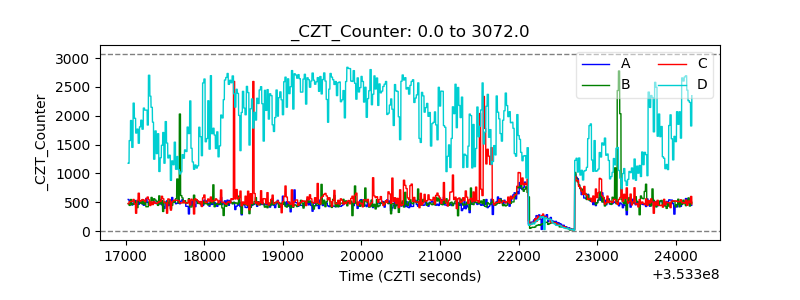 |
| +2.5 Volts monitor |  |
| +5 Volts monitor |  |
| _ROLL_ROT | 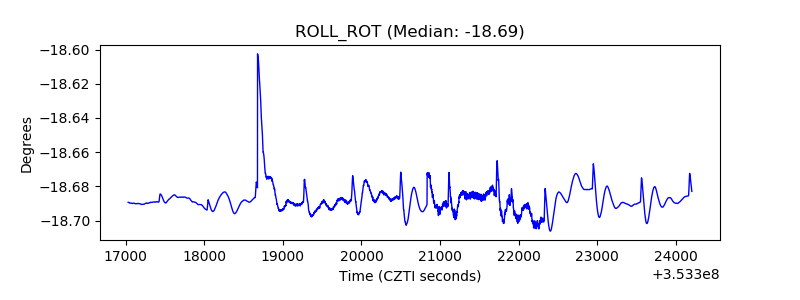 |
| _Roll_DEC | 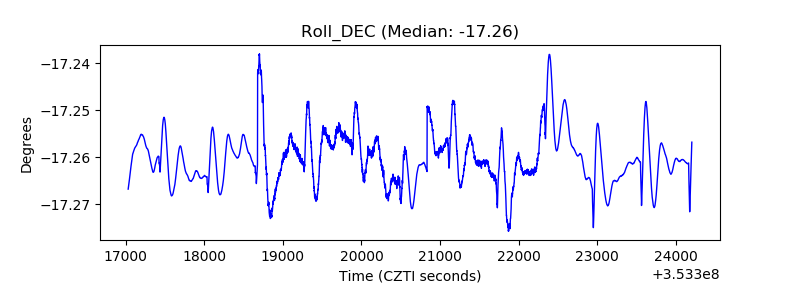 |
| _Roll_RA | 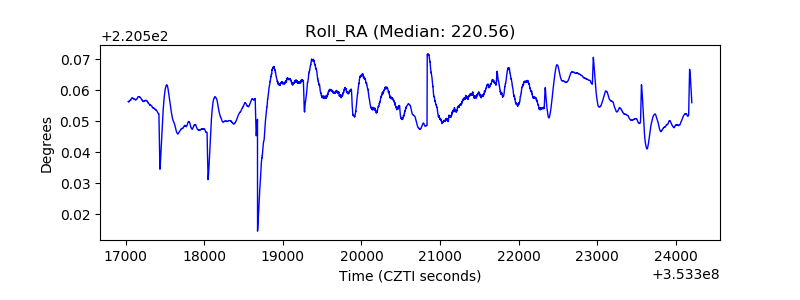 |
| Veto Counter | 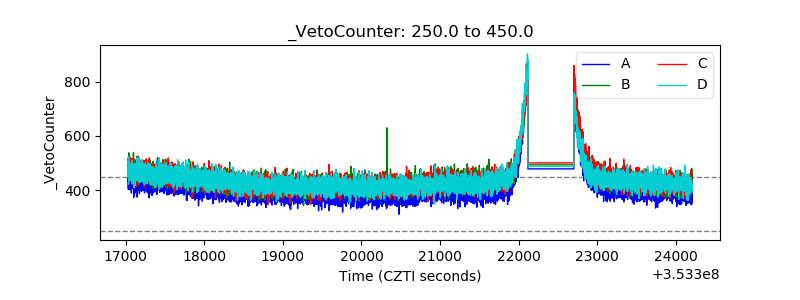 |