| Param | Original file | Final file |
|---|---|---|
| Filename | modeM0/AS1A10_048T05_9000004250_29504cztM0_level2.evt | modeM0/AS1A10_048T05_9000004250_29504cztM0_level2_quad_clean.evt |
| Size (bytes) | 818,475,840 | 91,509,120 |
| Size | 780.6 MB | 87.3 MB |
| Events in quadrant A | 3,994,592 | 569,875 |
| Events in quadrant B | 4,135,773 | 577,333 |
| Events in quadrant C | 4,444,486 | 558,165 |
| Events in quadrant D | 11,679,448 | 516,164 |
| Mode SS | |||
|---|---|---|---|
| Quadrant | BADHDUFLAG | Total packets | Discarded packets |
| A | 0 | 158 | 0 |
| B | 0 | 158 | 0 |
| C | 0 | 158 | 0 |
| D | 0 | 158 | 0 |
| Mode M9 | |||
|---|---|---|---|
| Quadrant | BADHDUFLAG | Total packets | Discarded packets |
| A | 0 | 1 | 0 |
| B | 0 | 1 | 0 |
| C | 0 | 1 | 0 |
| D | 0 | 1 | 0 |
| Mode M0 | |||
|---|---|---|---|
| Quadrant | BADHDUFLAG | Total packets | Discarded packets |
| A | 0 | 16824 | 1 |
| B | 0 | 17139 | 1 |
| C | 0 | 17834 | 1 |
| D | 0 | 40275 | 7 |
| Quadrant | Total seconds | Saturated seconds | Saturation percentage |
|---|---|---|---|
| A | 7901 | 288 | 3.645108% |
| B | 7902 | 346 | 4.378638% |
| C | 7902 | 430 | 5.441660% |
| D | 7901 | 1941 | 24.566511% |
Noise dominated data is calculated using 1-second bins in cleaned event files. If a bin has >2000 counts, and if more than 50% of those come from <1% of pixels, then it is considered to be noise-dominated and hence unusable.
| Quadrant | # 1 sec bins | Bins with >0 counts | Bins with >2000 counts | High rate bins dominated by noise | Noise dominated (total time) | Noise dominated (detector-on time) | Marked lightcurve |
|---|---|---|---|---|---|---|---|
| A | 7951 | 7903 | 0 | 0 | 0.00% | 0.00% | 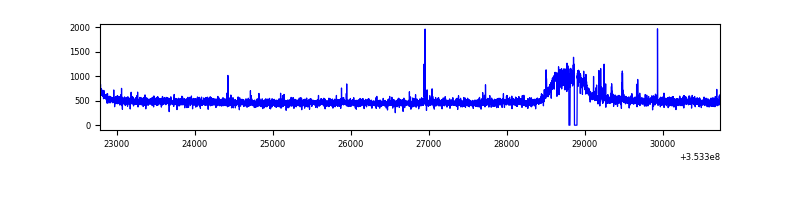 |
| B | 7952 | 7904 | 42 | 42 | 0.53% | 0.53% | 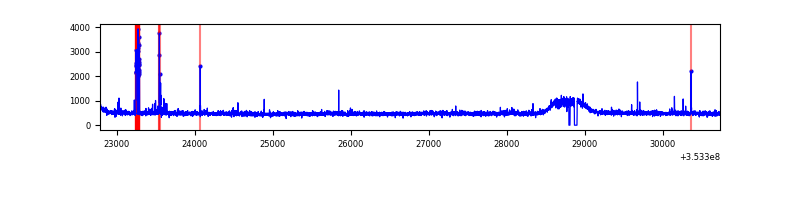 |
| C | 7952 | 7904 | 5 | 5 | 0.06% | 0.06% | 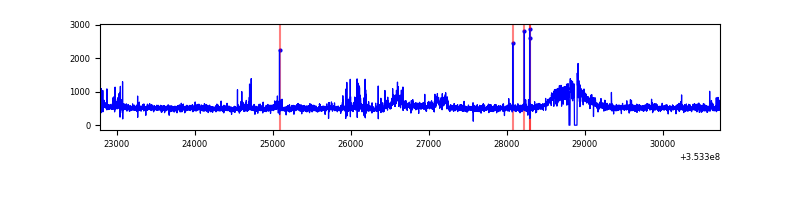 |
| D | 7951 | 7903 | 1560 | 1560 | 19.62% | 19.74% | 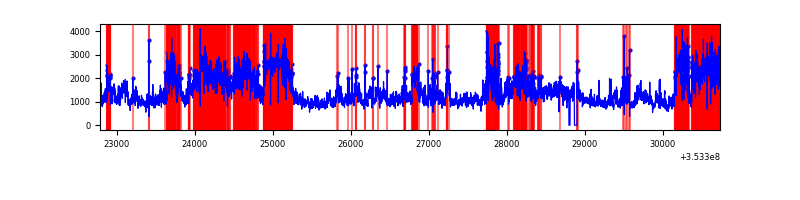 |
Top three noisy pixels from each quadrant. If the there are fewer than three noisy pixels in the level2.evt file, extra rows are filled as -1
| Pixel properties | Quadrant properties | ||||||
|---|---|---|---|---|---|---|---|
| Quadrant | DetID | PixID | Counts | Sigma | Mean | Median | Sigma |
| A | 12 | 96 | 46038 | 215.8 | 1022 | 999 | 208.7 |
| A | 13 | 254 | 14586 | 65.1 | 1022 | 999 | 208.7 |
| A | 3 | 137 | 10126 | 43.73 | 1022 | 999 | 208.7 |
| B | 15 | 222 | 120433 | 604.94 | 1007 | 980 | 197.5 |
| B | 12 | 111 | 24307 | 118.13 | 1007 | 980 | 197.5 |
| B | 11 | 111 | 22136 | 107.14 | 1007 | 980 | 197.5 |
| C | 3 | 233 | 347849 | 1497.01 | 981 | 989 | 231.7 |
| C | 14 | 238 | 177778 | 763.0 | 981 | 989 | 231.7 |
| C | 7 | 247 | 46096 | 194.68 | 981 | 989 | 231.7 |
| D | 8 | 195 | 5296434 | 24041.52 | 914 | 892 | 220.3 |
| D | 12 | 33 | 2574374 | 11683.49 | 914 | 892 | 220.3 |
| D | 7 | 238 | 262097 | 1185.86 | 914 | 892 | 220.3 |
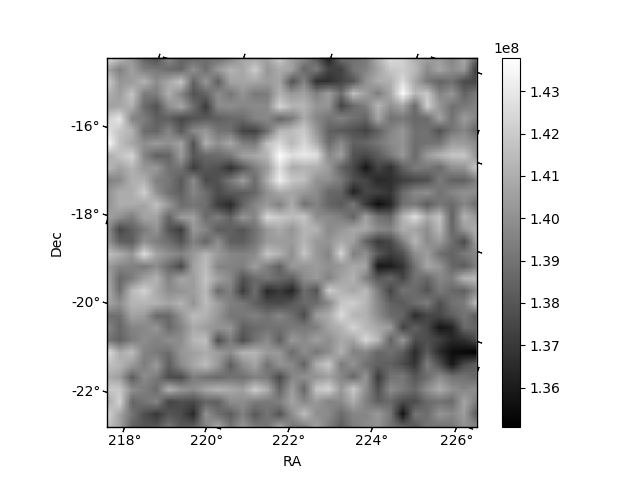
Histogram calculated using DETX and DETY for each event in the final _common_clean file
| Quadrant A | 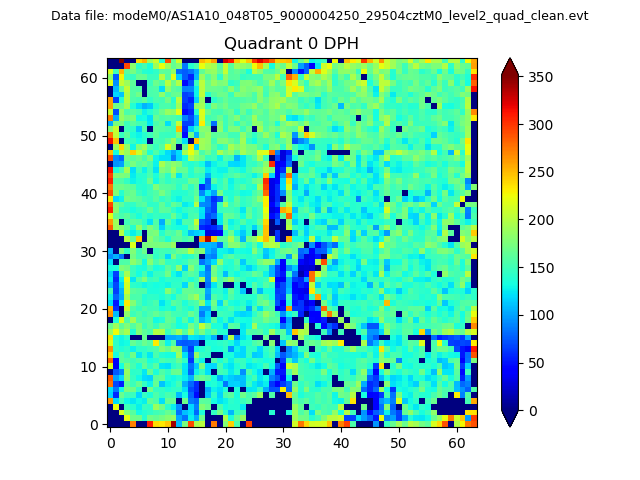 |
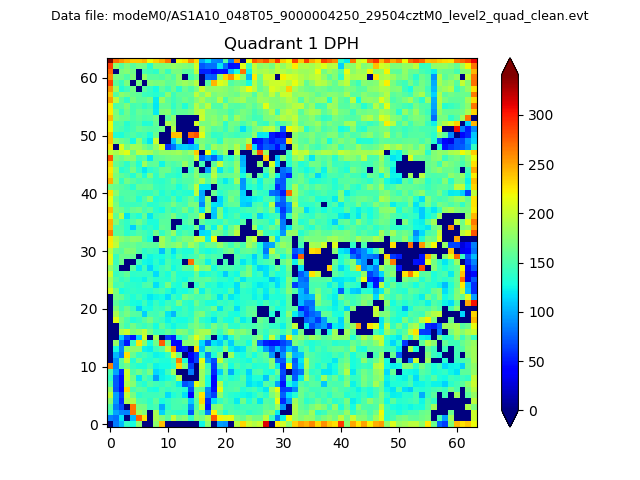 |
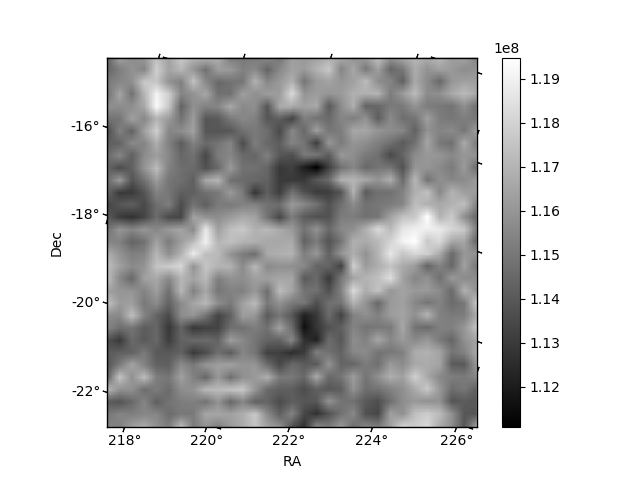
Quadrant B |
|---|---|---|---|
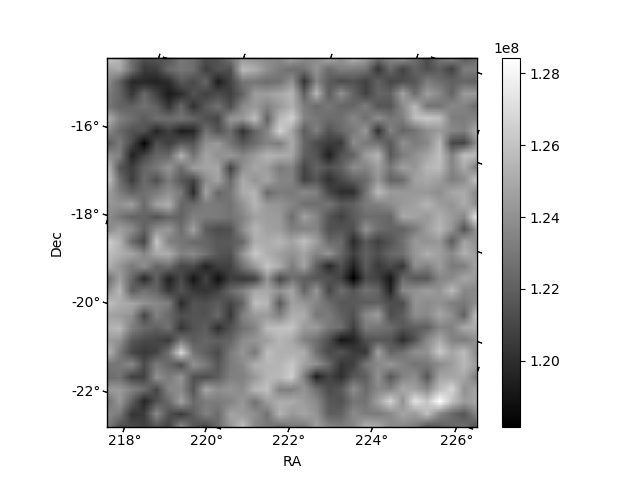
| Quadrant D | 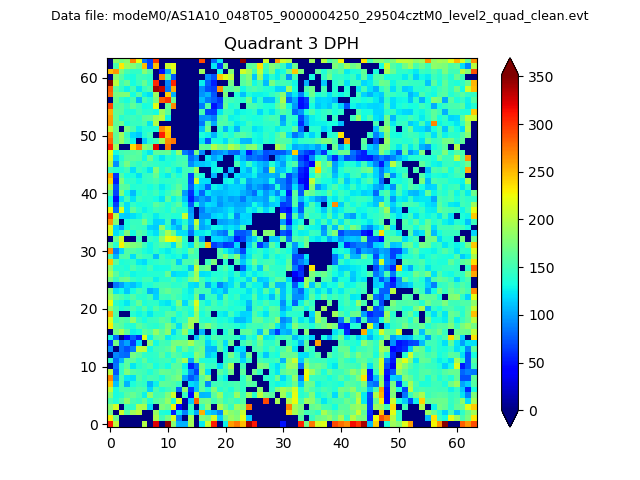 |
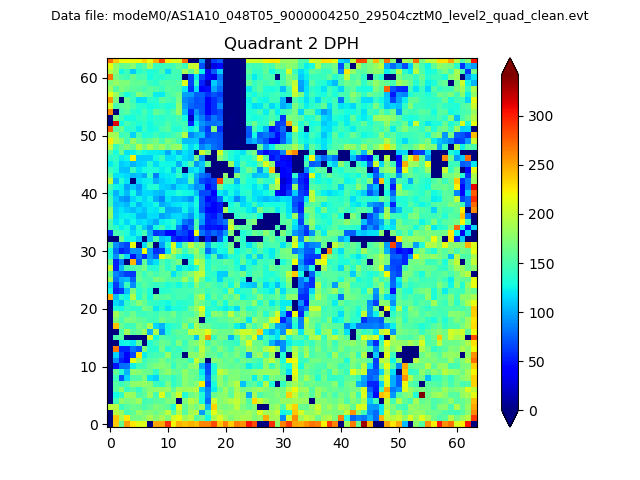 |
Quadrant C |
| Plot type | Count rate plots | Images |
|---|---|---|
| Comparison with Poisson distribution Blue bars denote a histogram of data divided into 1 sec bins. Red curve is a Poisson curve with rate = median count rate of data. |
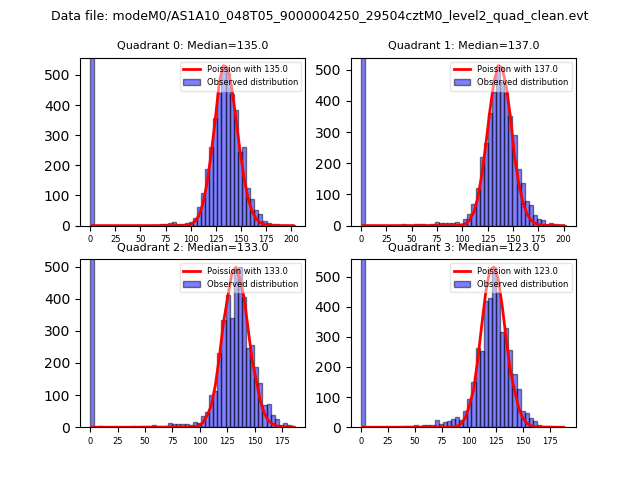 |
 |
| Quadrant-wise count rates Data is divided into 100 sec bins |
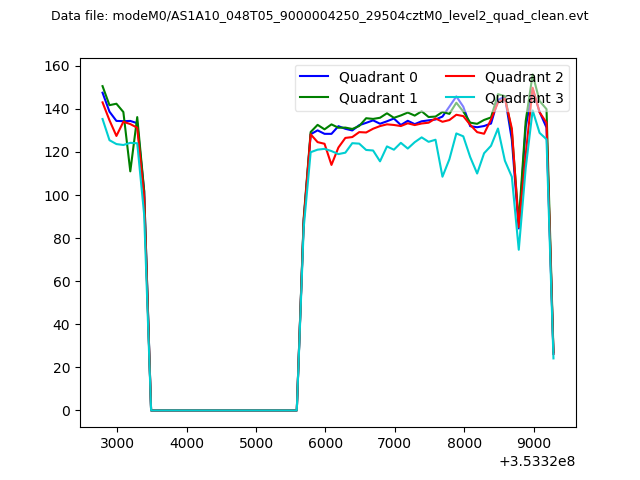 |
|
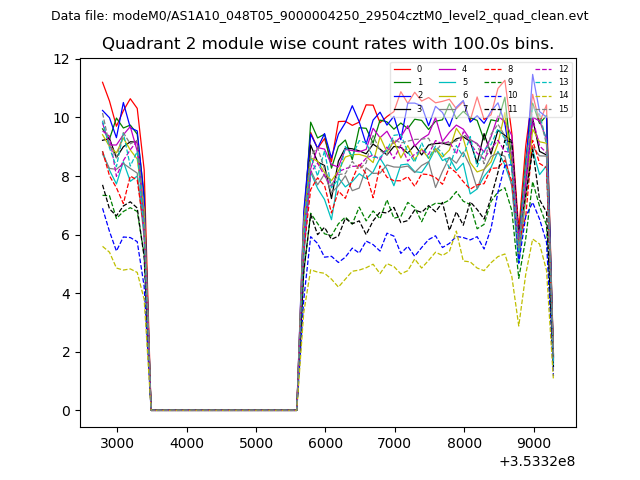
| Module-wise count rates for Quadrant A Data is divided into 100 sec bins |
 |
 |
| Module-wise count rates for Quadrant B Data is divided into 100 sec bins |
 |
 |
| Module-wise count rates for Quadrant C Data is divided into 100 sec bins |
 |
 |
| Module-wise count rates for Quadrant D Data is divided into 100 sec bins |
 |
 |
| Parameter | Plot |
|---|---|
| CZT HV Monitor | 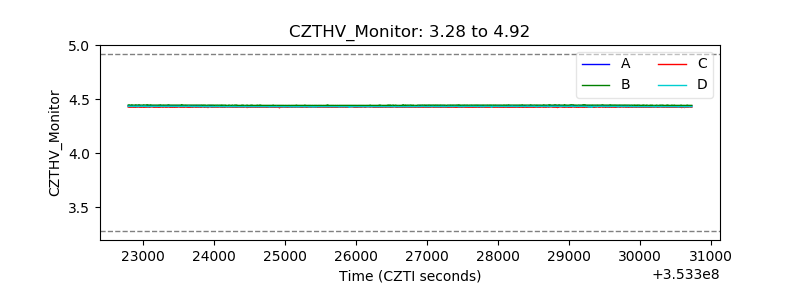 |
| D_VDD | 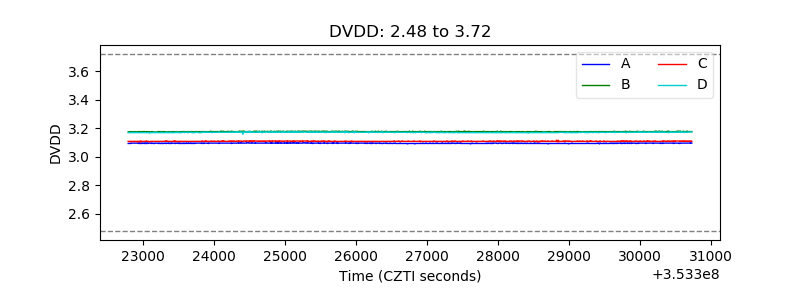 |
| Temperature 1 | 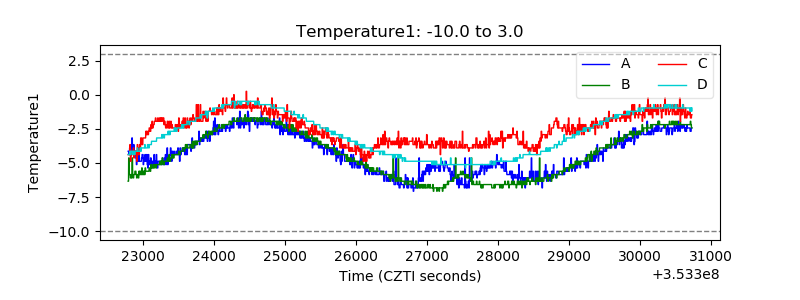 |
| Veto HV Monitor |  |
| Veto LLD | 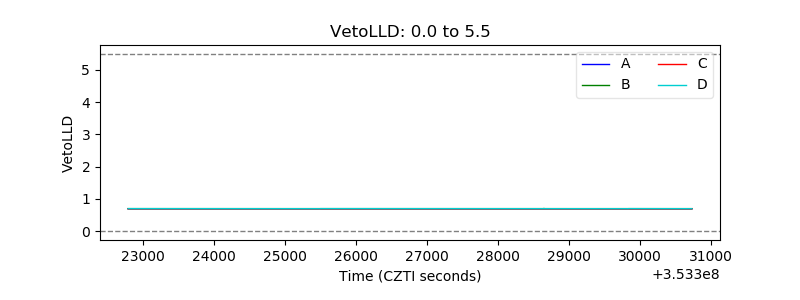 |
| Alpha Counter | 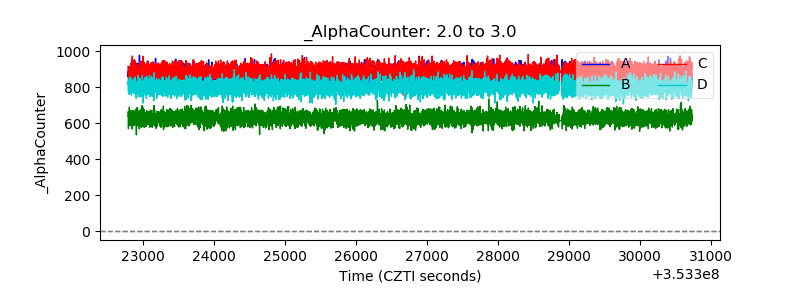 |
| _CPM_Rate | 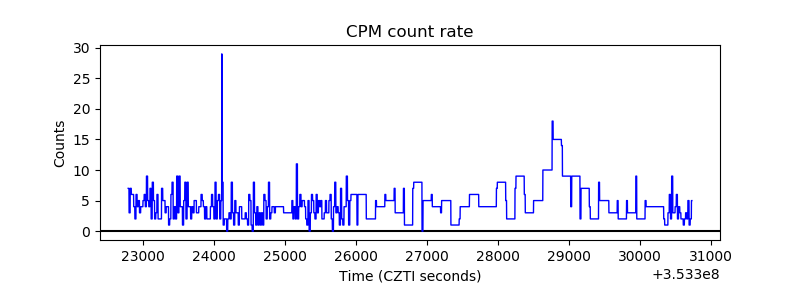 |
| CZT Counter |  |
| +2.5 Volts monitor |  |
| +5 Volts monitor |  |
| _ROLL_ROT | 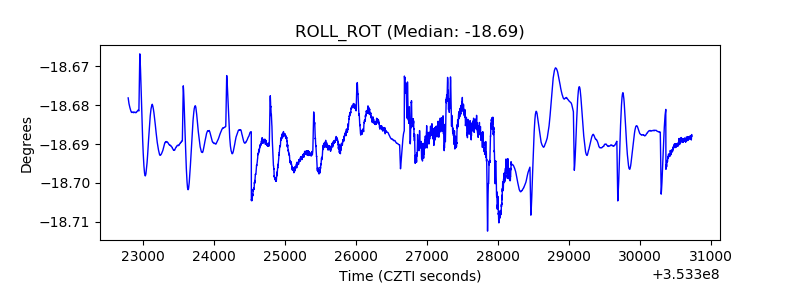 |
| _Roll_DEC |  |
| _Roll_RA | 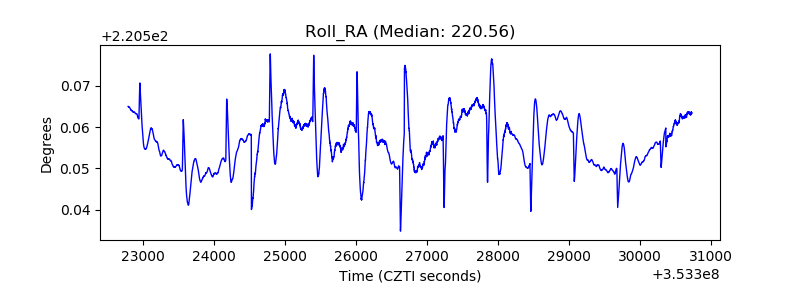 |
| Veto Counter |  |