| Param | Original file | Final file |
|---|---|---|
| Filename | modeM0/AS1A10_048T05_9000004250_29509cztM0_level2.evt | modeM0/AS1A10_048T05_9000004250_29509cztM0_level2_quad_clean.evt |
| Size (bytes) | 1,936,624,320 | 264,798,720 |
| Size | 1.8 GB | 252.5 MB |
| Events in quadrant A | 8,970,014 | 1,733,060 |
| Events in quadrant B | 9,083,978 | 1,767,509 |
| Events in quadrant C | 10,286,503 | 1,717,076 |
| Events in quadrant D | 29,034,864 | 1,494,743 |
| Mode SS | |||
|---|---|---|---|
| Quadrant | BADHDUFLAG | Total packets | Discarded packets |
| A | 0 | 386 | 0 |
| B | 0 | 386 | 0 |
| C | 0 | 386 | 0 |
| D | 0 | 386 | 0 |
| Mode M9 | |||
|---|---|---|---|
| Quadrant | BADHDUFLAG | Total packets | Discarded packets |
| A | 0 | 16 | 0 |
| B | 0 | 16 | 0 |
| C | 0 | 16 | 0 |
| D | 0 | 16 | 0 |
| Mode M0 | |||
|---|---|---|---|
| Quadrant | BADHDUFLAG | Total packets | Discarded packets |
| A | 0 | 39186 | 3 |
| B | 0 | 39220 | 3 |
| C | 0 | 42096 | 3 |
| D | 0 | 99541 | 15 |
| Quadrant | Total seconds | Saturated seconds | Saturation percentage |
|---|---|---|---|
| A | 18972 | 216 | 1.138520% |
| B | 18973 | 228 | 1.201708% |
| C | 18973 | 545 | 2.872503% |
| D | 18971 | 4102 | 21.622476% |
Noise dominated data is calculated using 1-second bins in cleaned event files. If a bin has >2000 counts, and if more than 50% of those come from <1% of pixels, then it is considered to be noise-dominated and hence unusable.
| Quadrant | # 1 sec bins | Bins with >0 counts | Bins with >2000 counts | High rate bins dominated by noise | Noise dominated (total time) | Noise dominated (detector-on time) | Marked lightcurve |
|---|---|---|---|---|---|---|---|
| A | 20578 | 18976 | 19 | 19 | 0.09% | 0.10% | 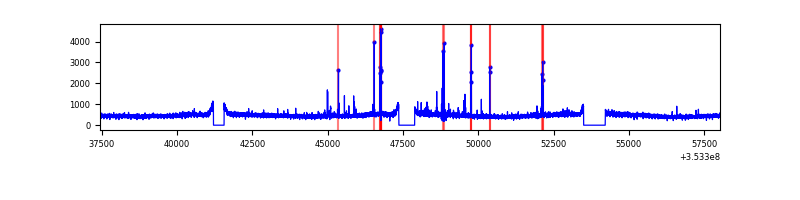 |
| B | 20578 | 18976 | 10 | 10 | 0.05% | 0.05% | 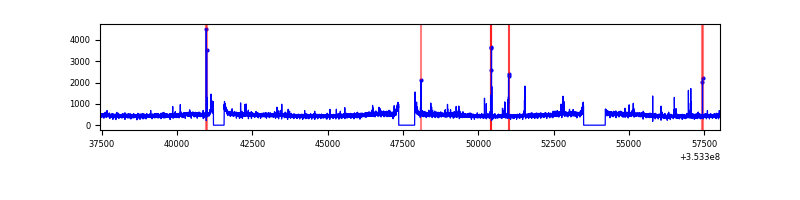 |
| C | 20578 | 18976 | 71 | 71 | 0.35% | 0.37% | 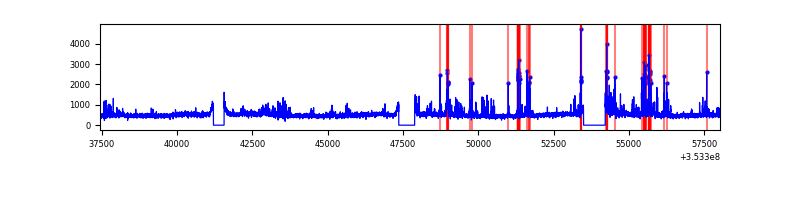 |
| D | 20578 | 18976 | 4122 | 4122 | 20.03% | 21.72% | 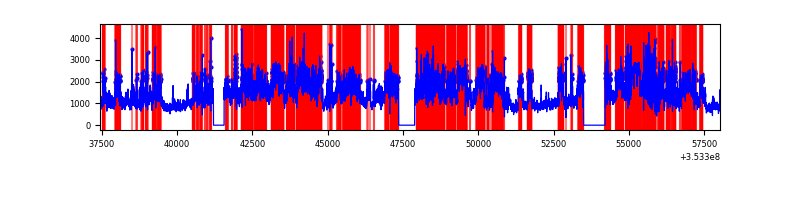 |
Top three noisy pixels from each quadrant. If the there are fewer than three noisy pixels in the level2.evt file, extra rows are filled as -1
| Pixel properties | Quadrant properties | ||||||
|---|---|---|---|---|---|---|---|
| Quadrant | DetID | PixID | Counts | Sigma | Mean | Median | Sigma |
| A | 12 | 96 | 149605 | 320.52 | 2277 | 2223 | 459.8 |
| A | 13 | 254 | 34375 | 69.92 | 2277 | 2223 | 459.8 |
| A | 0 | 13 | 31866 | 64.47 | 2277 | 2223 | 459.8 |
| B | 12 | 111 | 54903 | 120.76 | 2271 | 2208 | 436.3 |
| B | 0 | 230 | 53113 | 116.66 | 2271 | 2208 | 436.3 |
| B | 11 | 111 | 49601 | 108.61 | 2271 | 2208 | 436.3 |
| C | 7 | 247 | 702878 | 1362.57 | 2204 | 2224 | 514.2 |
| C | 3 | 233 | 499458 | 966.98 | 2204 | 2224 | 514.2 |
| C | 14 | 238 | 393011 | 759.97 | 2204 | 2224 | 514.2 |
| D | 8 | 195 | 18032578 | 36771.91 | 2045 | 1996 | 490.3 |
| D | 7 | 238 | 2067087 | 4211.58 | 2045 | 1996 | 490.3 |
| D | 12 | 33 | 856922 | 1743.55 | 2045 | 1996 | 490.3 |
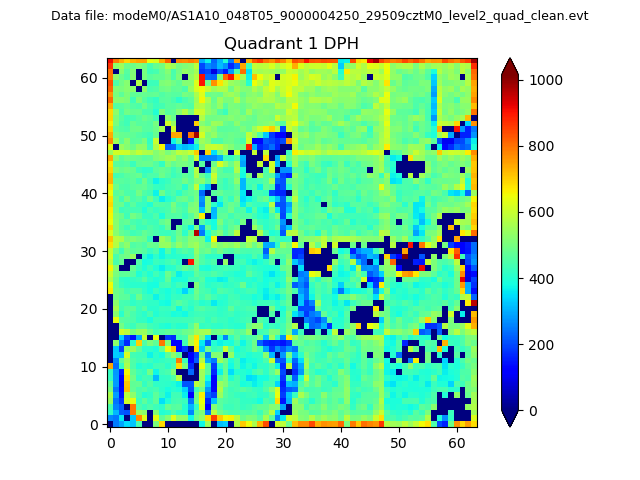
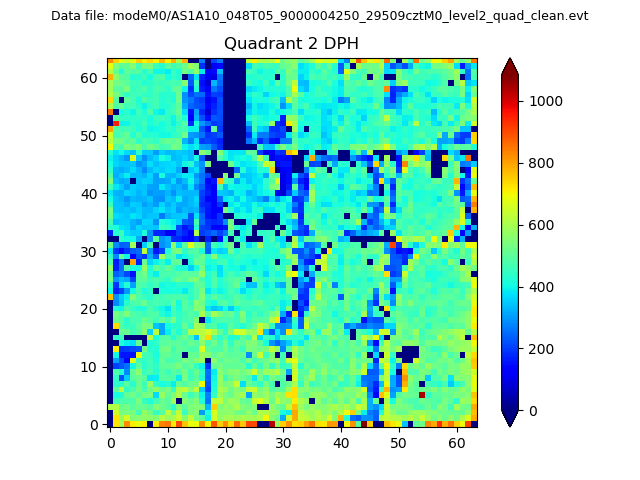
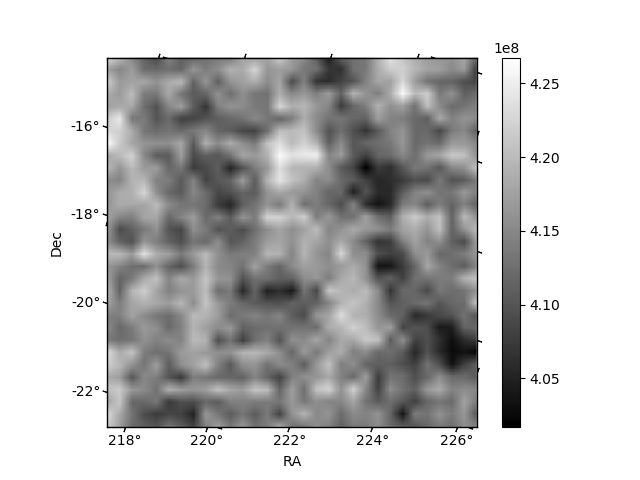
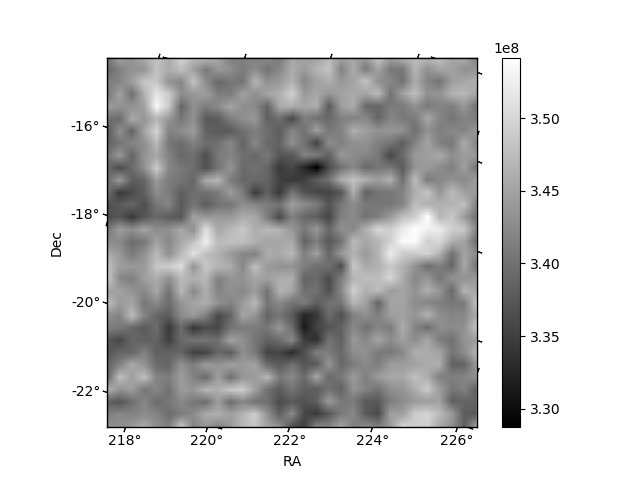
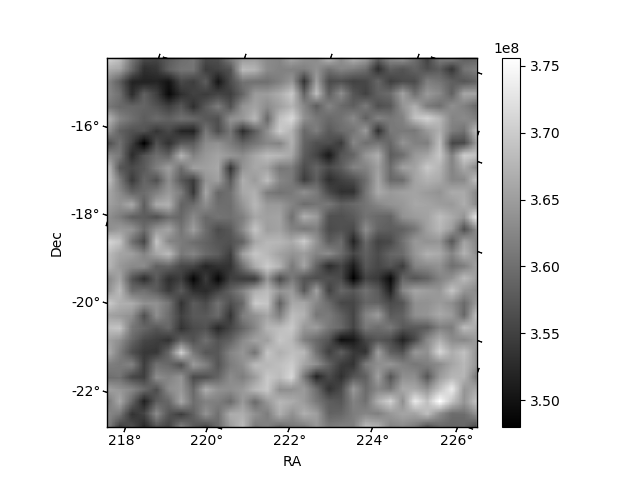
Histogram calculated using DETX and DETY for each event in the final _common_clean file
| Quadrant A |  |
 |
Quadrant B |
|---|---|---|---|
| Quadrant D |  |
 |
Quadrant C |
| Plot type | Count rate plots | Images |
|---|---|---|
| Comparison with Poisson distribution Blue bars denote a histogram of data divided into 1 sec bins. Red curve is a Poisson curve with rate = median count rate of data. |
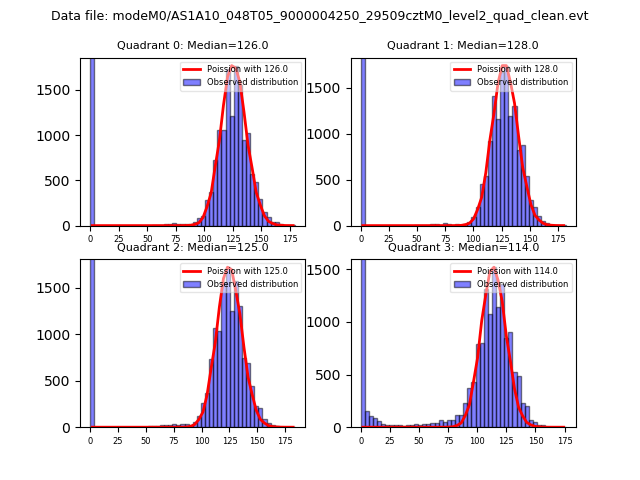 |
 |
| Quadrant-wise count rates Data is divided into 100 sec bins |
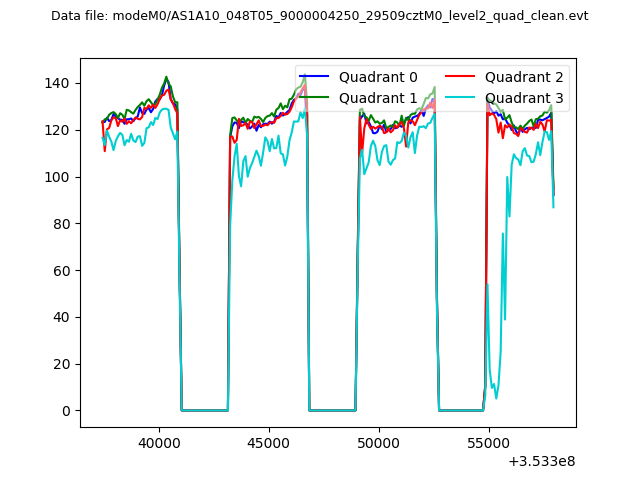 |
|
| Module-wise count rates for Quadrant A Data is divided into 100 sec bins |
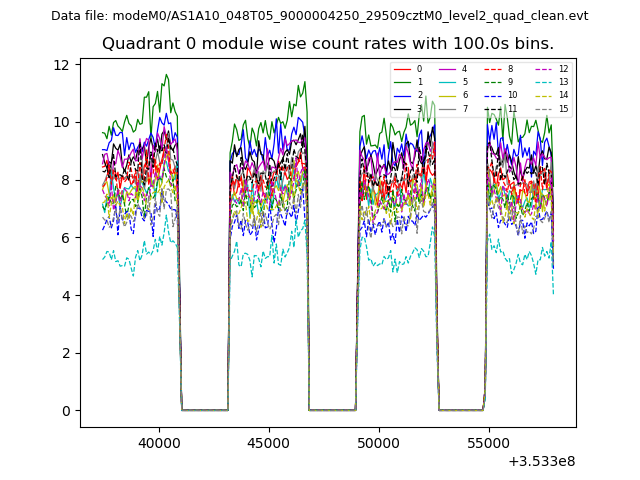 |
 |
| Module-wise count rates for Quadrant B Data is divided into 100 sec bins |
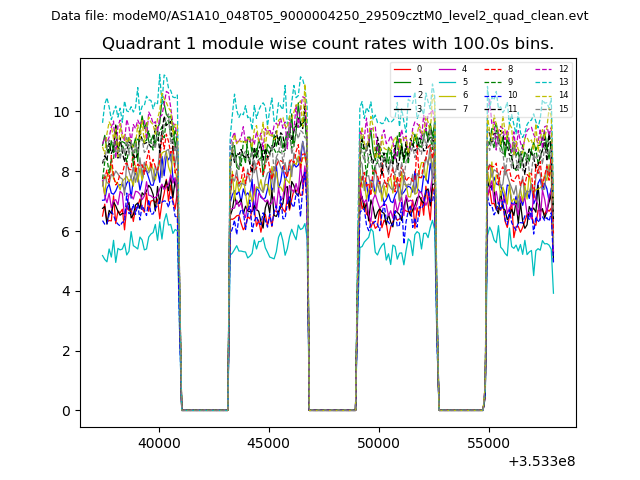 |
 |
| Module-wise count rates for Quadrant C Data is divided into 100 sec bins |
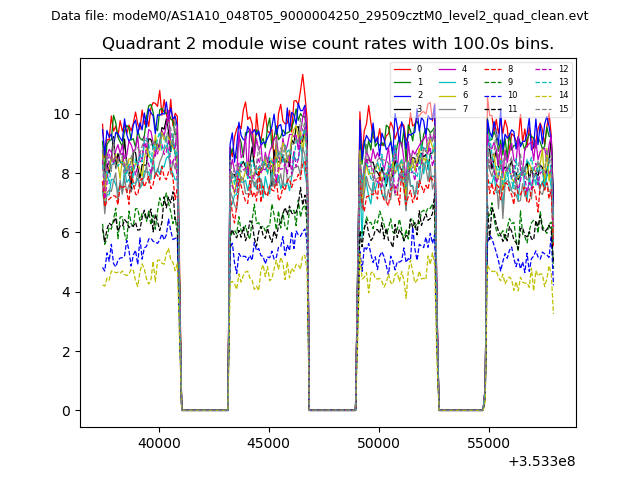 |
 |
| Module-wise count rates for Quadrant D Data is divided into 100 sec bins |
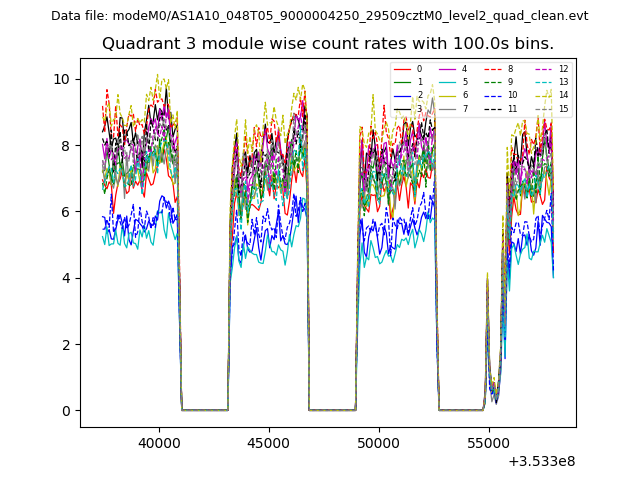 |
 |
| Parameter | Plot |
|---|---|
| CZT HV Monitor | 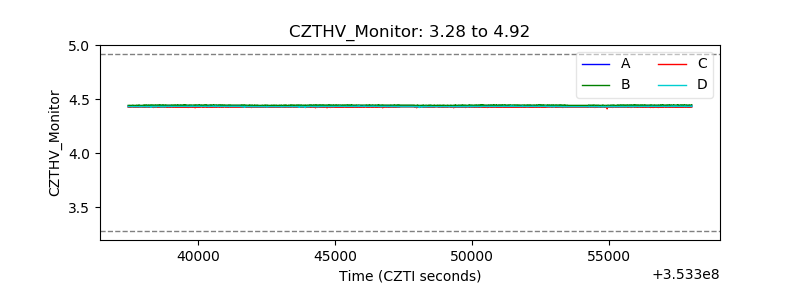 |
| D_VDD | 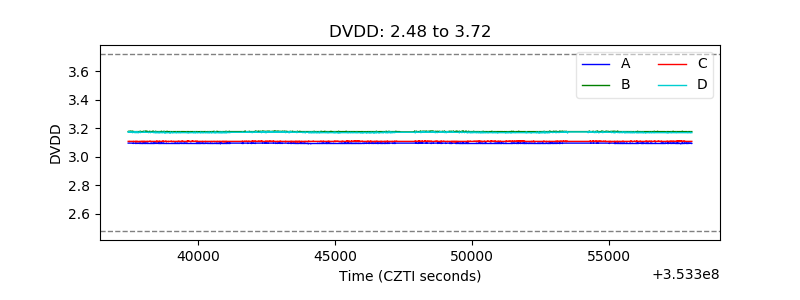 |
| Temperature 1 | 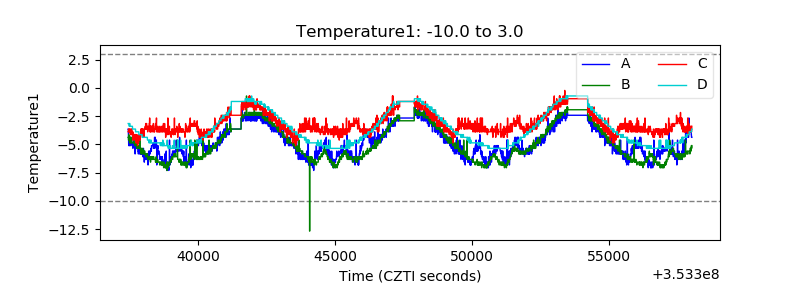 |
| Veto HV Monitor | 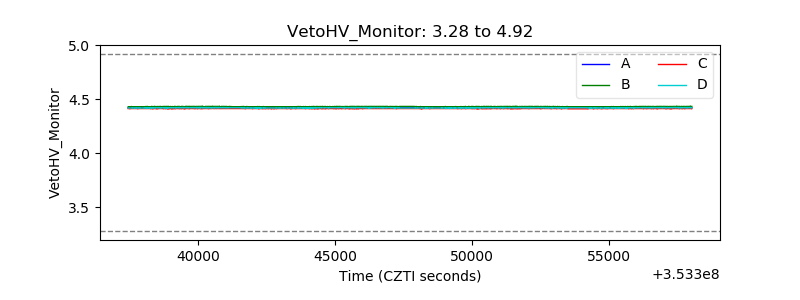 |
| Veto LLD | 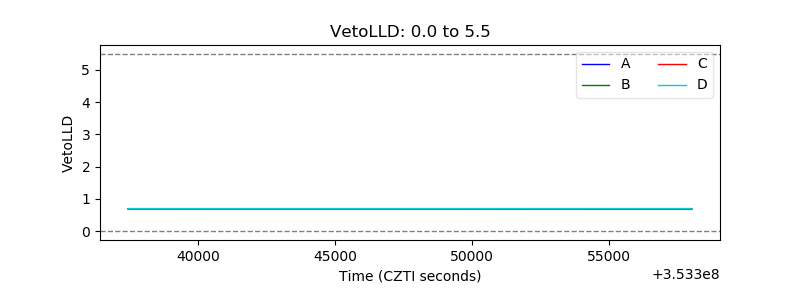 |
| Alpha Counter | 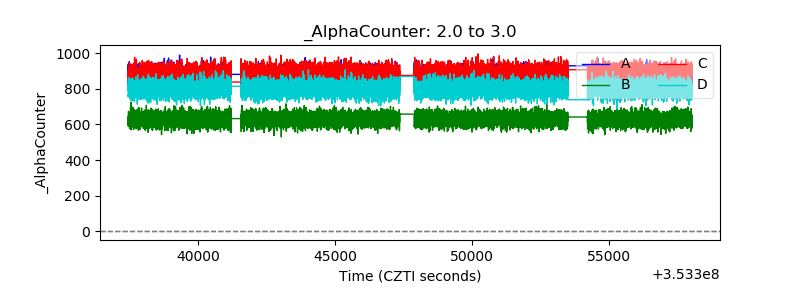 |
| _CPM_Rate | 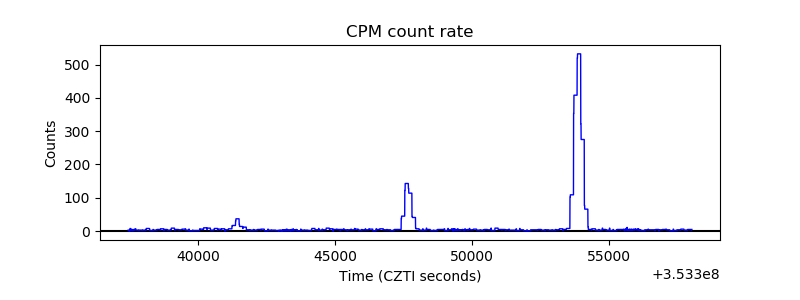 |
| CZT Counter | 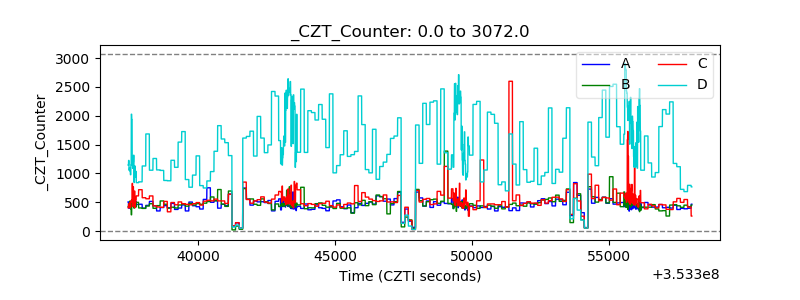 |
| +2.5 Volts monitor |  |
| +5 Volts monitor | 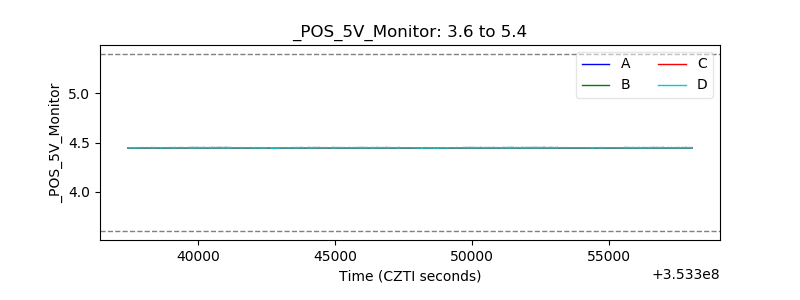 |
| _ROLL_ROT | 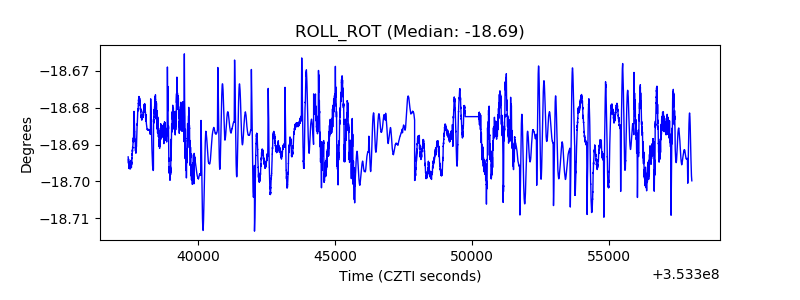 |
| _Roll_DEC | 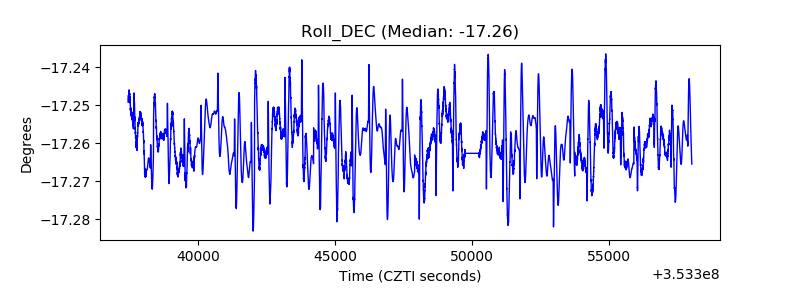 |
| _Roll_RA | 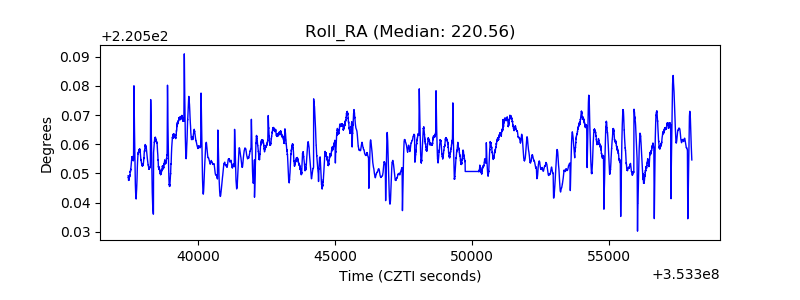 |
| Veto Counter | 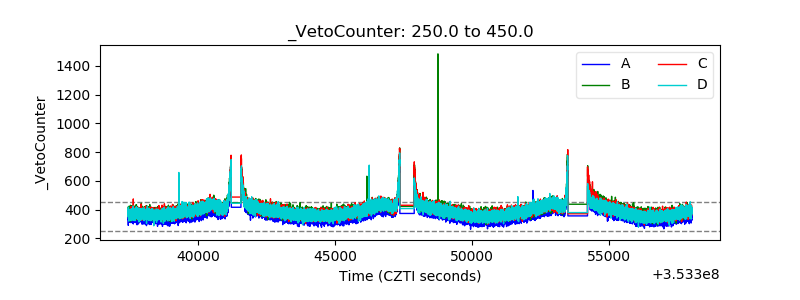 |