| Param | Original file | Final file |
|---|---|---|
| Filename | modeM0/AS1A10_048T05_9000004250_29512cztM0_level2.evt | modeM0/AS1A10_048T05_9000004250_29512cztM0_level2_quad_clean.evt |
| Size (bytes) | 730,123,200 | 110,862,720 |
| Size | 696.3 MB | 105.7 MB |
| Events in quadrant A | 3,321,638 | 736,468 |
| Events in quadrant B | 3,470,868 | 765,087 |
| Events in quadrant C | 3,930,779 | 731,400 |
| Events in quadrant D | 10,934,859 | 655,863 |
| Mode SS | |||
|---|---|---|---|
| Quadrant | BADHDUFLAG | Total packets | Discarded packets |
| A | 0 | 136 | 0 |
| B | 0 | 136 | 0 |
| C | 0 | 136 | 0 |
| D | 0 | 136 | 0 |
| Mode M9 | |||
|---|---|---|---|
| Quadrant | BADHDUFLAG | Total packets | Discarded packets |
| A | 0 | 17 | 0 |
| B | 0 | 18 | 0 |
| C | 0 | 18 | 0 |
| D | 0 | 18 | 0 |
| Mode M0 | |||
|---|---|---|---|
| Quadrant | BADHDUFLAG | Total packets | Discarded packets |
| A | 0 | 14115 | 2 |
| B | 0 | 14541 | 2 |
| C | 0 | 15763 | 2 |
| D | 0 | 37123 | 6 |
| Quadrant | Total seconds | Saturated seconds | Saturation percentage |
|---|---|---|---|
| A | 6724 | 12 | 0.178465% |
| B | 6724 | 36 | 0.535396% |
| C | 6724 | 178 | 2.647234% |
| D | 6723 | 1650 | 24.542615% |
Noise dominated data is calculated using 1-second bins in cleaned event files. If a bin has >2000 counts, and if more than 50% of those come from <1% of pixels, then it is considered to be noise-dominated and hence unusable.
| Quadrant | # 1 sec bins | Bins with >0 counts | Bins with >2000 counts | High rate bins dominated by noise | Noise dominated (total time) | Noise dominated (detector-on time) | Marked lightcurve |
|---|---|---|---|---|---|---|---|
| A | 7944 | 6725 | 0 | 0 | 0.00% | 0.00% | 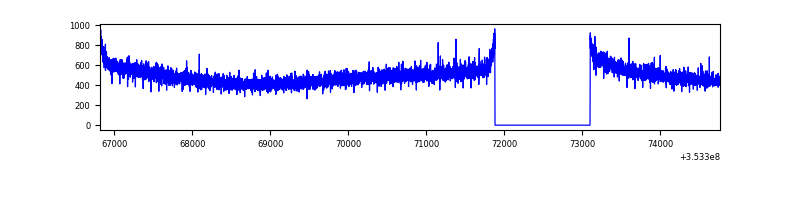 |
| B | 7944 | 6725 | 5 | 5 | 0.06% | 0.07% | 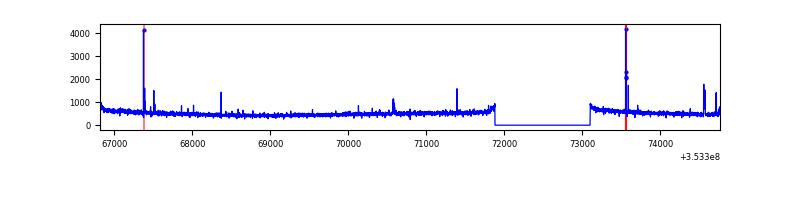 |
| C | 7944 | 6725 | 69 | 69 | 0.87% | 1.03% | 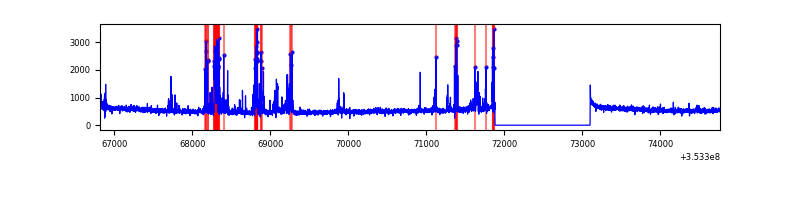 |
| D | 7943 | 6724 | 1940 | 1940 | 24.42% | 28.85% | 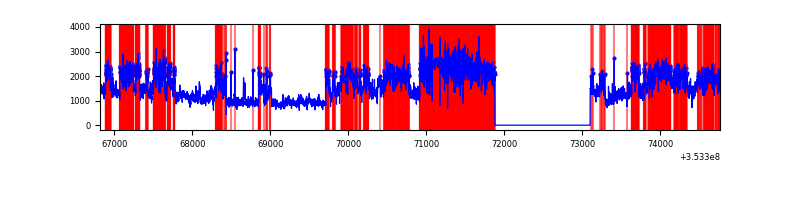 |
Top three noisy pixels from each quadrant. If the there are fewer than three noisy pixels in the level2.evt file, extra rows are filled as -1
| Pixel properties | Quadrant properties | ||||||
|---|---|---|---|---|---|---|---|
| Quadrant | DetID | PixID | Counts | Sigma | Mean | Median | Sigma |
| A | 13 | 254 | 12247 | 66.49 | 859 | 845 | 171.5 |
| A | 3 | 137 | 8039 | 41.95 | 859 | 845 | 171.5 |
| A | 0 | 226 | 7244 | 37.32 | 859 | 845 | 171.5 |
| B | 15 | 222 | 29544 | 173.48 | 867 | 842 | 165.4 |
| B | 12 | 111 | 19915 | 115.28 | 867 | 842 | 165.4 |
| B | 5 | 172 | 19059 | 110.1 | 867 | 842 | 165.4 |
| C | 7 | 247 | 424838 | 2174.57 | 836 | 844 | 195.0 |
| C | 14 | 238 | 141665 | 722.24 | 836 | 844 | 195.0 |
| C | 3 | 233 | 71503 | 362.39 | 836 | 844 | 195.0 |
| D | 8 | 195 | 6519019 | 35699.69 | 764 | 746 | 182.6 |
| D | 12 | 33 | 1274933 | 6978.55 | 764 | 746 | 182.6 |
| D | 7 | 238 | 90277 | 490.35 | 764 | 746 | 182.6 |
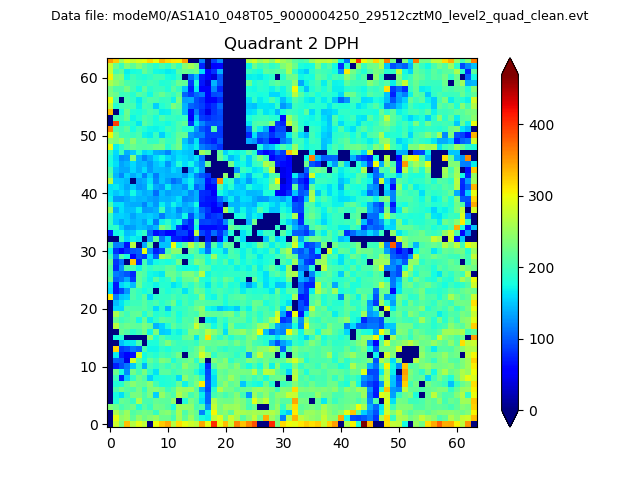
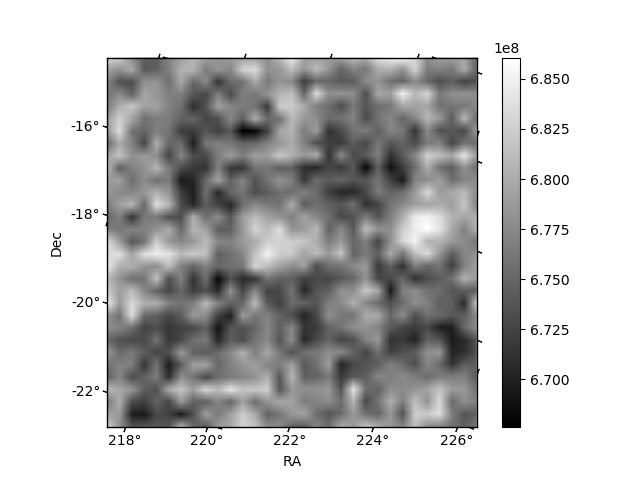
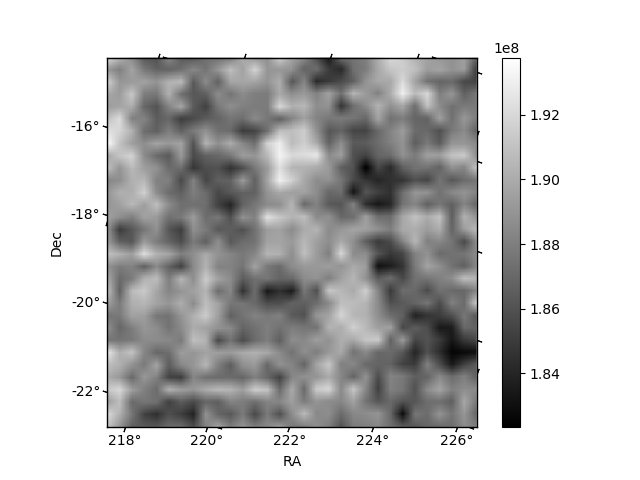
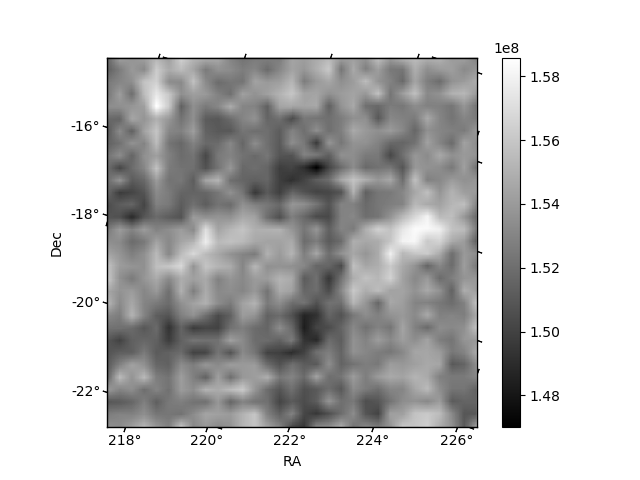
Histogram calculated using DETX and DETY for each event in the final _common_clean file
| Quadrant A | 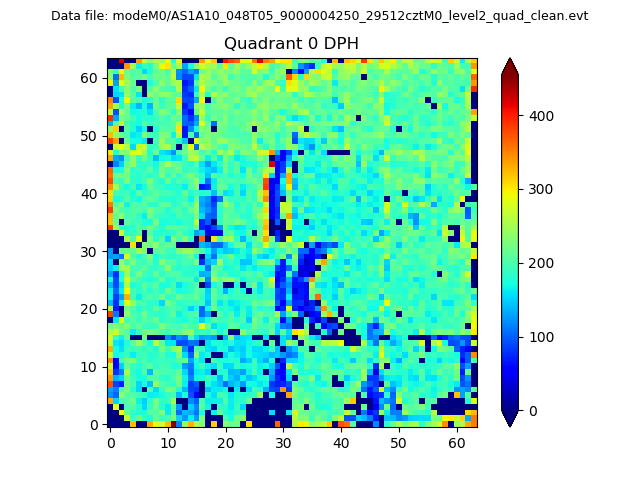 |
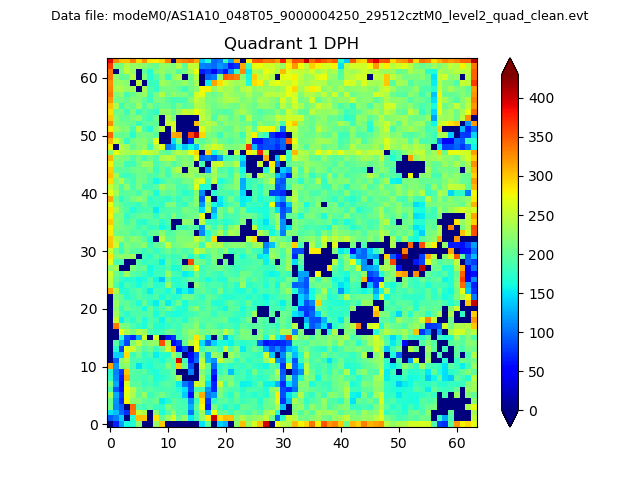 |
Quadrant B |
|---|---|---|---|
| Quadrant D | 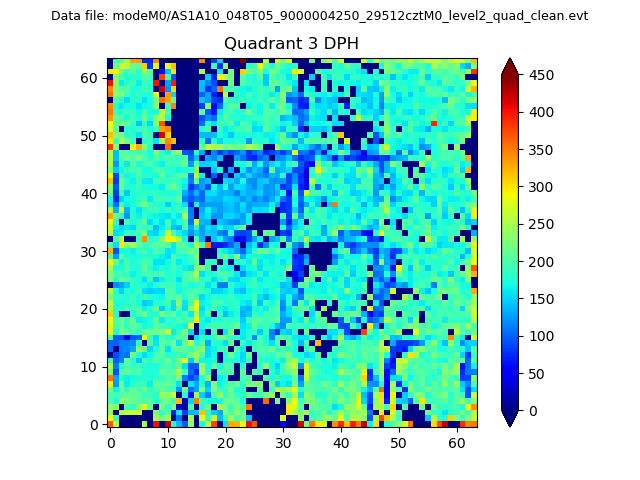 |
 |
Quadrant C |
| Plot type | Count rate plots | Images |
|---|---|---|
| Comparison with Poisson distribution Blue bars denote a histogram of data divided into 1 sec bins. Red curve is a Poisson curve with rate = median count rate of data. |
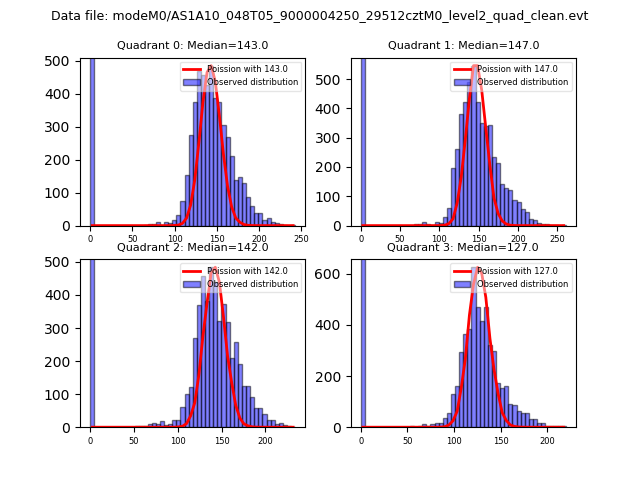 |
 |
| Quadrant-wise count rates Data is divided into 100 sec bins |
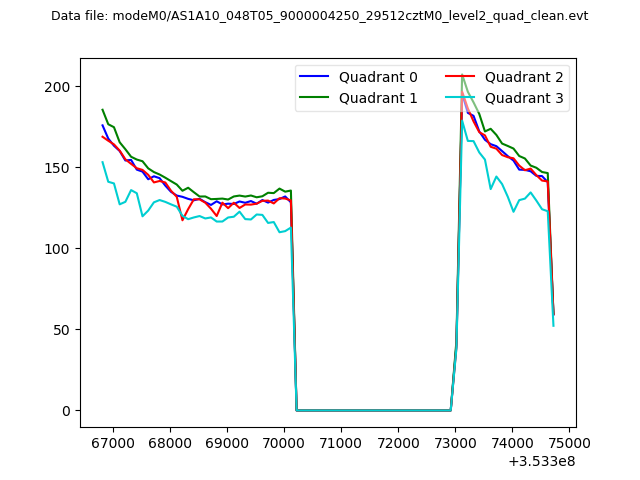 |
|
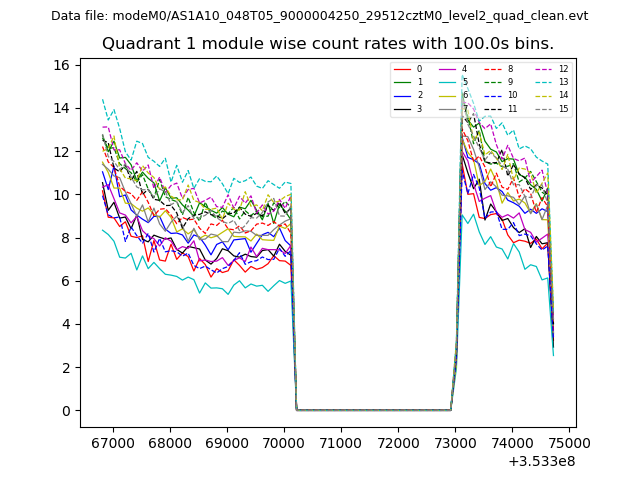
| Module-wise count rates for Quadrant A Data is divided into 100 sec bins |
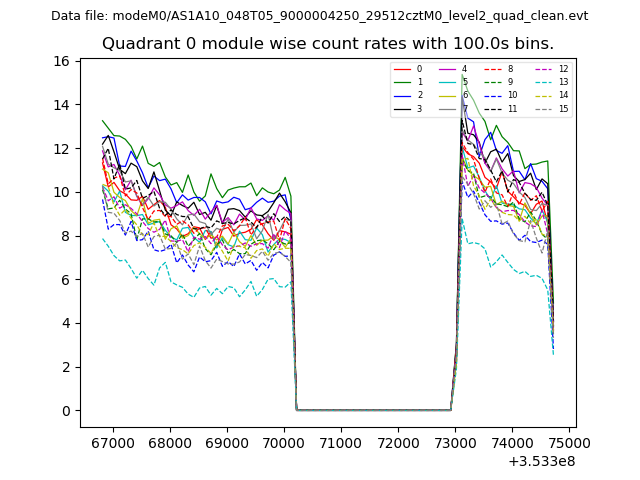 |
 |
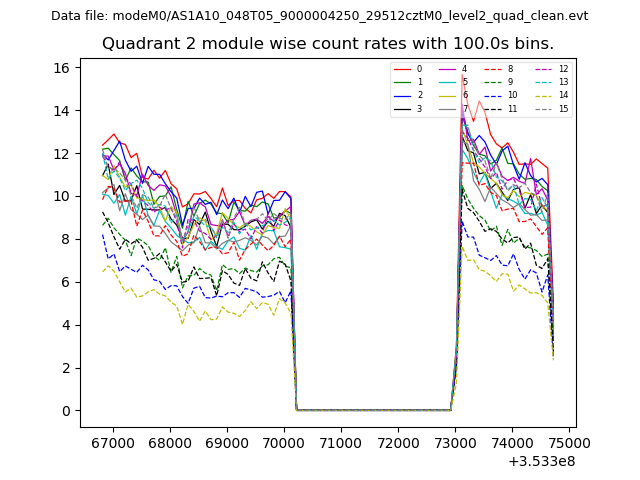
| Module-wise count rates for Quadrant B Data is divided into 100 sec bins |
 |
 |
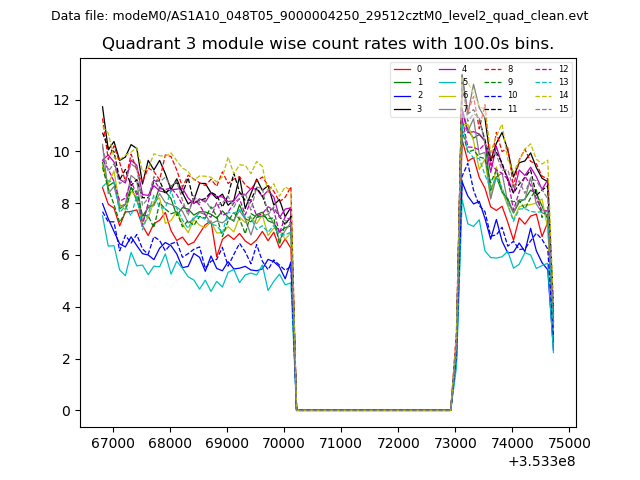
| Module-wise count rates for Quadrant C Data is divided into 100 sec bins |
 |
 |
| Module-wise count rates for Quadrant D Data is divided into 100 sec bins |
 |
 |
| Parameter | Plot |
|---|---|
| CZT HV Monitor | 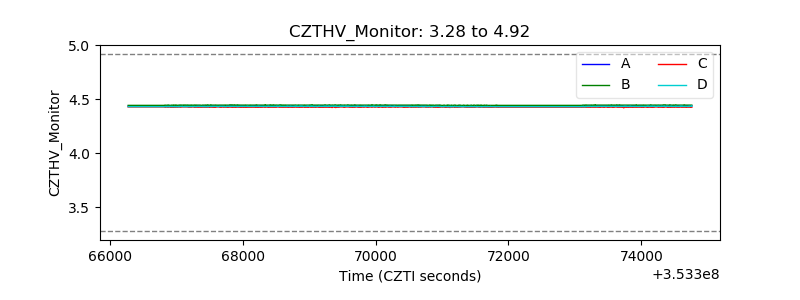 |
| D_VDD | 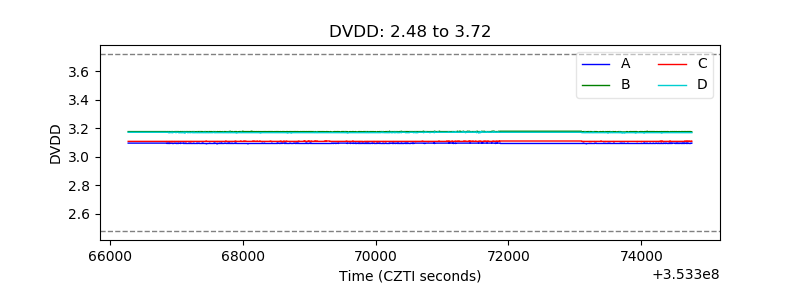 |
| Temperature 1 |  |
| Veto HV Monitor | 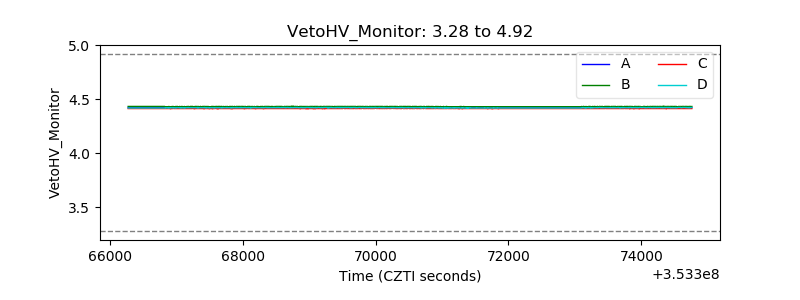 |
| Veto LLD | 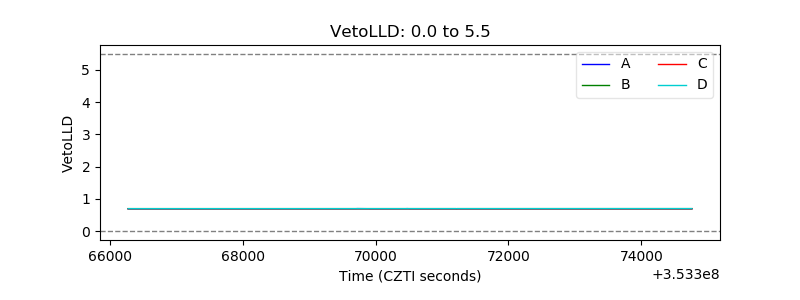 |
| Alpha Counter | 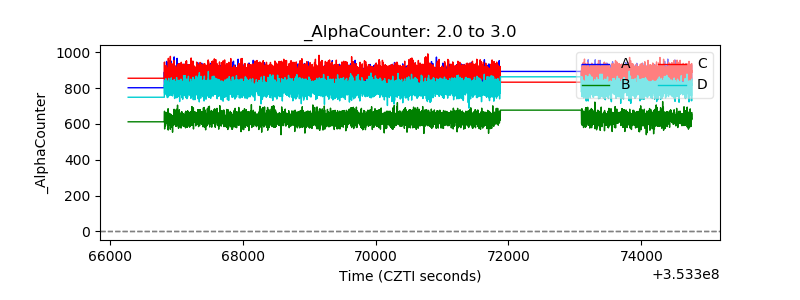 |
| _CPM_Rate | 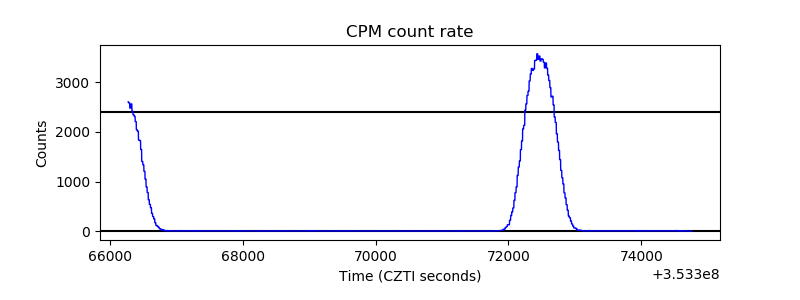 |
| CZT Counter | 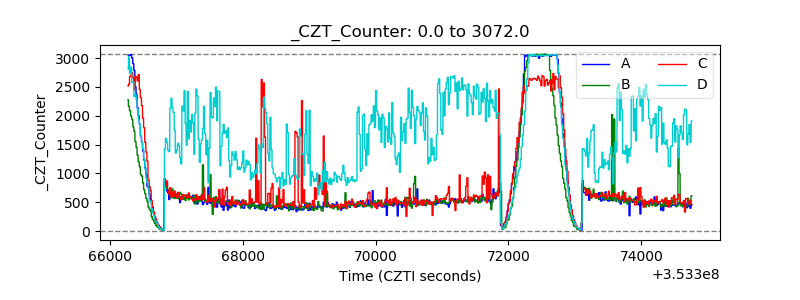 |
| +2.5 Volts monitor |  |
| +5 Volts monitor |  |
| _ROLL_ROT | 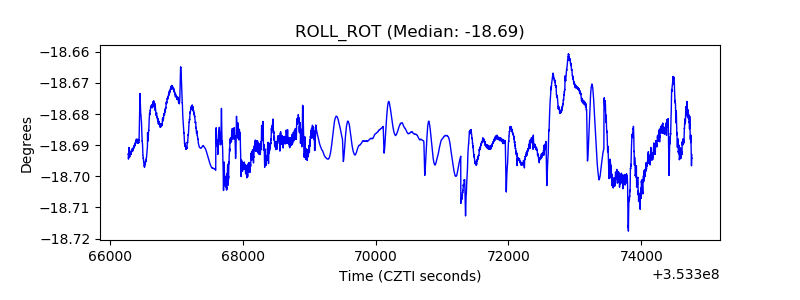 |
| _Roll_DEC | 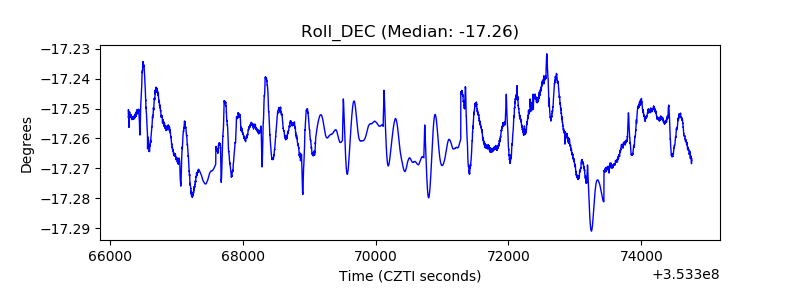 |
| _Roll_RA | 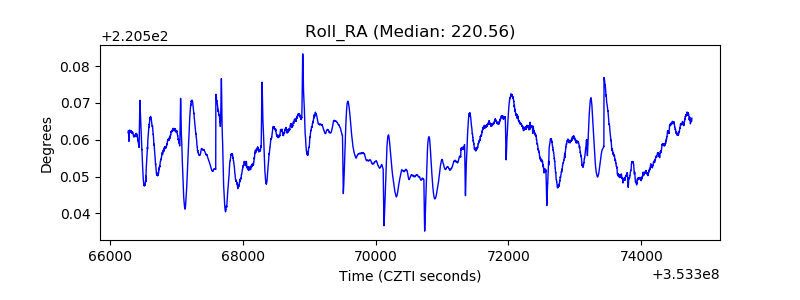 |
| Veto Counter |  |