| Param | Original file | Final file |
|---|---|---|
| Filename | modeM0/AS1A10_048T05_9000004250_29514cztM0_level2.evt | modeM0/AS1A10_048T05_9000004250_29514cztM0_level2_quad_clean.evt |
| Size (bytes) | 784,679,040 | 104,610,240 |
| Size | 748.3 MB | 99.8 MB |
| Events in quadrant A | 3,456,574 | 697,513 |
| Events in quadrant B | 3,532,273 | 724,024 |
| Events in quadrant C | 3,796,904 | 694,241 |
| Events in quadrant D | 12,542,818 | 601,468 |
| Mode SS | |||
|---|---|---|---|
| Quadrant | BADHDUFLAG | Total packets | Discarded packets |
| A | 0 | 132 | 0 |
| B | 0 | 132 | 0 |
| C | 0 | 132 | 0 |
| D | 0 | 132 | 0 |
| Mode M9 | |||
|---|---|---|---|
| Quadrant | BADHDUFLAG | Total packets | Discarded packets |
| A | 0 | 19 | 0 |
| B | 0 | 20 | 0 |
| C | 0 | 20 | 0 |
| D | 0 | 20 | 0 |
| Mode M0 | |||
|---|---|---|---|
| Quadrant | BADHDUFLAG | Total packets | Discarded packets |
| A | 0 | 14024 | 2 |
| B | 0 | 14261 | 2 |
| C | 0 | 15177 | 2 |
| D | 0 | 41642 | 2 |
| Quadrant | Total seconds | Saturated seconds | Saturation percentage |
|---|---|---|---|
| A | 6458 | 49 | 0.758749% |
| B | 6458 | 76 | 1.176835% |
| C | 6458 | 108 | 1.672344% |
| D | 6458 | 2708 | 41.932487% |
Noise dominated data is calculated using 1-second bins in cleaned event files. If a bin has >2000 counts, and if more than 50% of those come from <1% of pixels, then it is considered to be noise-dominated and hence unusable.
| Quadrant | # 1 sec bins | Bins with >0 counts | Bins with >2000 counts | High rate bins dominated by noise | Noise dominated (total time) | Noise dominated (detector-on time) | Marked lightcurve |
|---|---|---|---|---|---|---|---|
| A | 7784 | 6459 | 0 | 0 | 0.00% | 0.00% |  |
| B | 7784 | 6459 | 8 | 8 | 0.10% | 0.12% |  |
| C | 7784 | 6459 | 4 | 4 | 0.05% | 0.06% |  |
| D | 7784 | 6458 | 3112 | 3112 | 39.98% | 48.19% |  |
Top three noisy pixels from each quadrant. If the there are fewer than three noisy pixels in the level2.evt file, extra rows are filled as -1
| Pixel properties | Quadrant properties | ||||||
|---|---|---|---|---|---|---|---|
| Quadrant | DetID | PixID | Counts | Sigma | Mean | Median | Sigma |
| A | 0 | 13 | 15535 | 82.75 | 889 | 875 | 177.2 |
| A | 11 | 29 | 12312 | 64.55 | 889 | 875 | 177.2 |
| A | 13 | 254 | 11670 | 60.93 | 889 | 875 | 177.2 |
| B | 5 | 172 | 22411 | 129.14 | 888 | 866 | 166.8 |
| B | 12 | 111 | 19516 | 111.79 | 888 | 866 | 166.8 |
| B | 11 | 111 | 17374 | 98.95 | 888 | 866 | 166.8 |
| C | 7 | 247 | 200980 | 994.77 | 867 | 877 | 201.2 |
| C | 14 | 238 | 140538 | 694.29 | 867 | 877 | 201.2 |
| C | 3 | 233 | 63203 | 309.84 | 867 | 877 | 201.2 |
| D | 8 | 195 | 7659232 | 44221.41 | 736 | 720 | 173.2 |
| D | 12 | 33 | 1522725 | 8788.29 | 736 | 720 | 173.2 |
| D | 7 | 238 | 362713 | 2090.2 | 736 | 720 | 173.2 |
Histogram calculated using DETX and DETY for each event in the final _common_clean file
| Quadrant A |  |
 |
Quadrant B |
|---|---|---|---|
| Quadrant D |  |
 |
Quadrant C |
| Plot type | Count rate plots | Images |
|---|---|---|
| Comparison with Poisson distribution Blue bars denote a histogram of data divided into 1 sec bins. Red curve is a Poisson curve with rate = median count rate of data. |
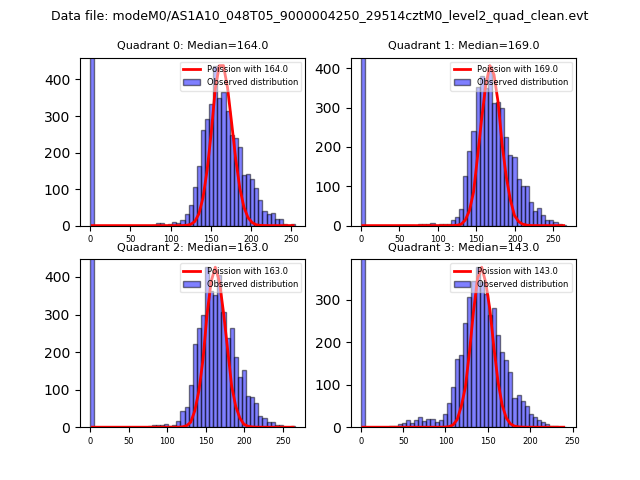 |
 |
| Quadrant-wise count rates Data is divided into 100 sec bins |
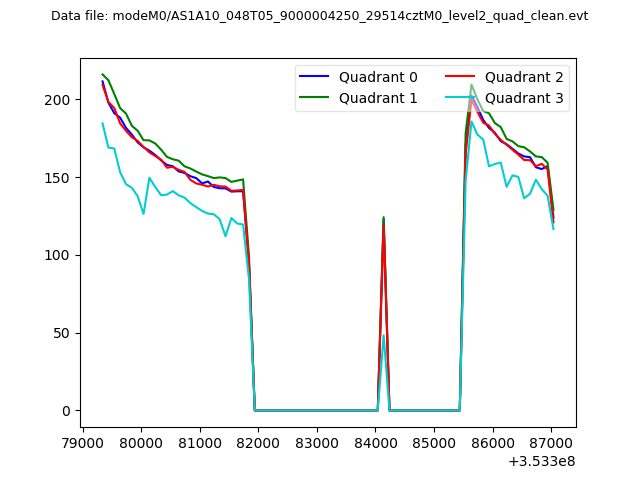 |
|
| Module-wise count rates for Quadrant A Data is divided into 100 sec bins |
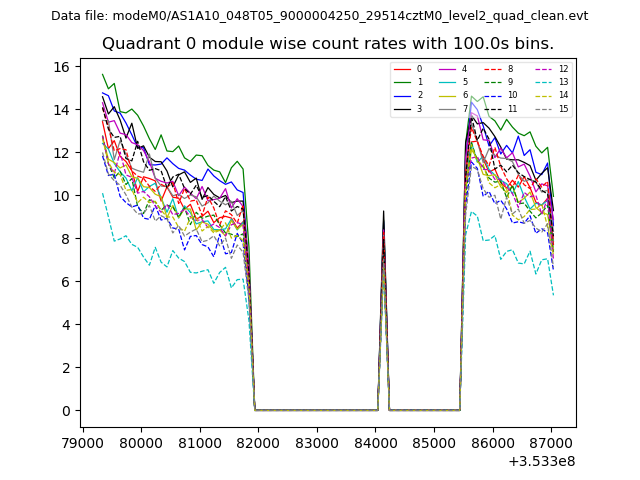 |
 |
| Module-wise count rates for Quadrant B Data is divided into 100 sec bins |
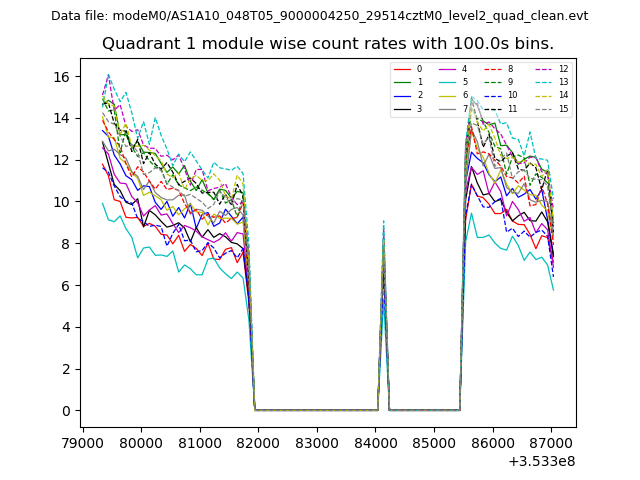 |
 |
| Module-wise count rates for Quadrant C Data is divided into 100 sec bins |
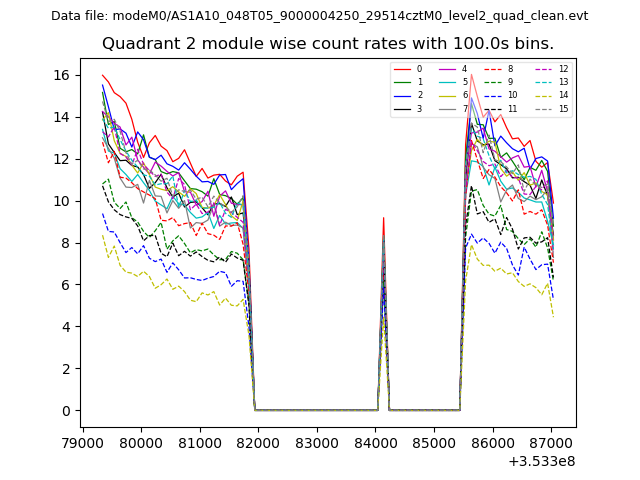 |
 |
| Module-wise count rates for Quadrant D Data is divided into 100 sec bins |
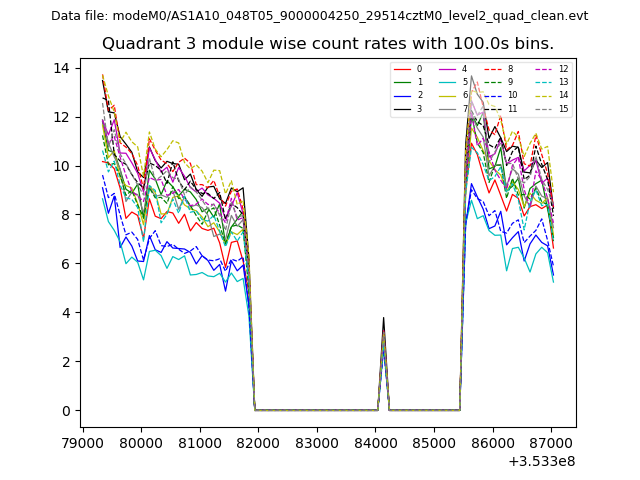 |
 |
| Parameter | Plot |
|---|---|
| CZT HV Monitor | 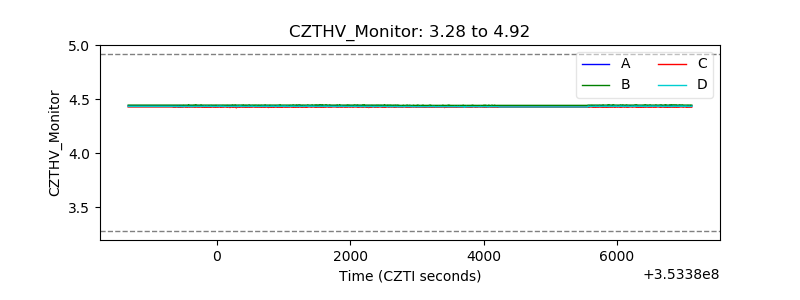 |
| D_VDD |  |
| Temperature 1 |  |
| Veto HV Monitor |  |
| Veto LLD |  |
| Alpha Counter | 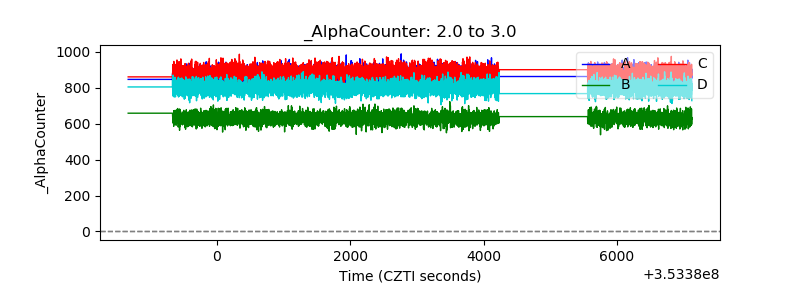 |
| _CPM_Rate | 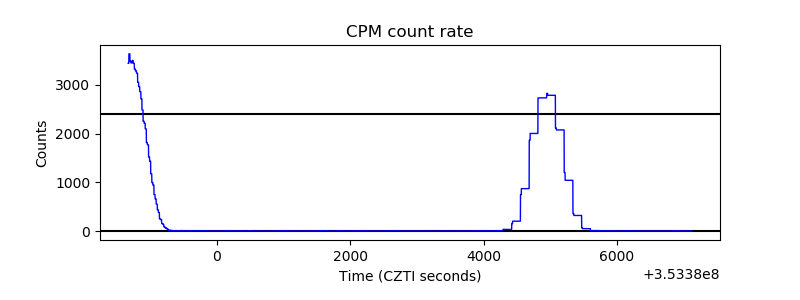 |
| CZT Counter |  |
| +2.5 Volts monitor |  |
| +5 Volts monitor |  |
| _ROLL_ROT | 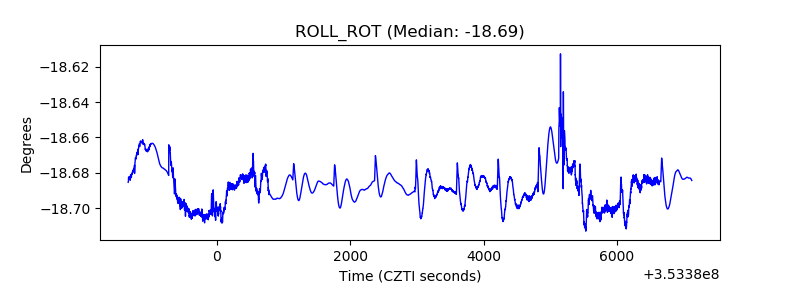 |
| _Roll_DEC |  |
| _Roll_RA |  |
| Veto Counter | 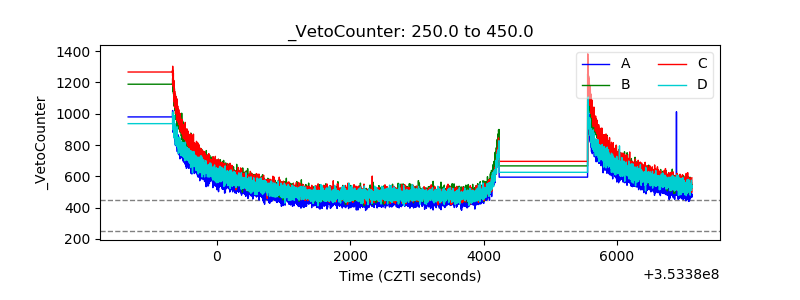 |