| Param | Original file | Final file |
|---|---|---|
| Filename | modeM0/AS1A10_048T05_9000004250_29515cztM0_level2.evt | modeM0/AS1A10_048T05_9000004250_29515cztM0_level2_quad_clean.evt |
| Size (bytes) | 632,695,680 | 84,919,680 |
| Size | 603.4 MB | 81.0 MB |
| Events in quadrant A | 3,034,188 | 560,111 |
| Events in quadrant B | 3,069,924 | 576,077 |
| Events in quadrant C | 3,309,901 | 551,510 |
| Events in quadrant D | 9,358,662 | 481,452 |
| Mode SS | |||
|---|---|---|---|
| Quadrant | BADHDUFLAG | Total packets | Discarded packets |
| A | 0 | 118 | 0 |
| B | 0 | 118 | 0 |
| C | 0 | 118 | 0 |
| D | 0 | 118 | 0 |
| Mode M9 | |||
|---|---|---|---|
| Quadrant | BADHDUFLAG | Total packets | Discarded packets |
| A | 0 | 13 | 0 |
| B | 0 | 13 | 0 |
| C | 0 | 13 | 0 |
| D | 0 | 13 | 0 |
| Mode M0 | |||
|---|---|---|---|
| Quadrant | BADHDUFLAG | Total packets | Discarded packets |
| A | 0 | 12156 | 1 |
| B | 0 | 12282 | 1 |
| C | 0 | 13208 | 3 |
| D | 0 | 31773 | 1 |
| Quadrant | Total seconds | Saturated seconds | Saturation percentage |
|---|---|---|---|
| A | 5750 | 56 | 0.973913% |
| B | 5751 | 80 | 1.391062% |
| C | 5750 | 155 | 2.695652% |
| D | 5750 | 1460 | 25.391304% |
Noise dominated data is calculated using 1-second bins in cleaned event files. If a bin has >2000 counts, and if more than 50% of those come from <1% of pixels, then it is considered to be noise-dominated and hence unusable.
| Quadrant | # 1 sec bins | Bins with >0 counts | Bins with >2000 counts | High rate bins dominated by noise | Noise dominated (total time) | Noise dominated (detector-on time) | Marked lightcurve |
|---|---|---|---|---|---|---|---|
| A | 7065 | 5751 | 0 | 0 | 0.00% | 0.00% | 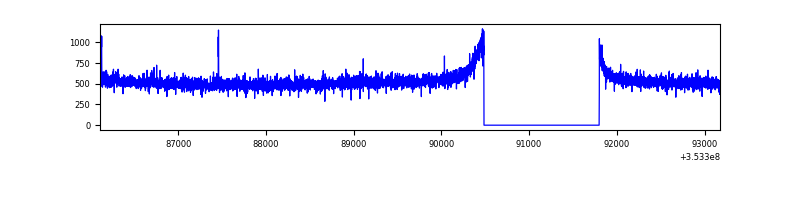 |
| B | 7066 | 5752 | 2 | 2 | 0.03% | 0.03% |  |
| C | 7065 | 5751 | 0 | 0 | 0.00% | 0.00% | 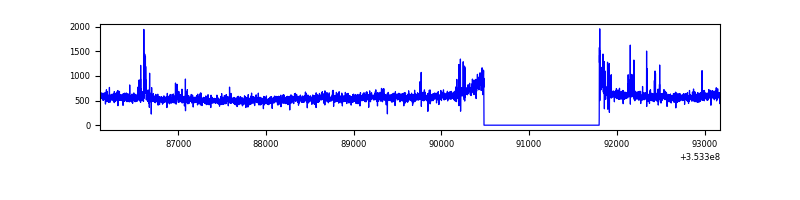 |
| D | 7065 | 5751 | 1448 | 1448 | 20.50% | 25.18% |  |
Top three noisy pixels from each quadrant. If the there are fewer than three noisy pixels in the level2.evt file, extra rows are filled as -1
| Pixel properties | Quadrant properties | ||||||
|---|---|---|---|---|---|---|---|
| Quadrant | DetID | PixID | Counts | Sigma | Mean | Median | Sigma |
| A | 0 | 13 | 13785 | 83.41 | 782 | 770 | 156.0 |
| A | 13 | 254 | 10025 | 59.31 | 782 | 770 | 156.0 |
| A | 3 | 137 | 6995 | 39.89 | 782 | 770 | 156.0 |
| B | 12 | 111 | 17218 | 112.84 | 774 | 755 | 145.9 |
| B | 0 | 230 | 16583 | 108.49 | 774 | 755 | 145.9 |
| B | 11 | 111 | 15586 | 101.66 | 774 | 755 | 145.9 |
| C | 3 | 233 | 158786 | 900.95 | 756 | 761 | 175.4 |
| C | 14 | 238 | 139578 | 791.44 | 756 | 761 | 175.4 |
| C | 7 | 247 | 28571 | 158.55 | 756 | 761 | 175.4 |
| D | 8 | 195 | 5118232 | 30723.4 | 711 | 696 | 166.6 |
| D | 12 | 33 | 1234618 | 7407.92 | 711 | 696 | 166.6 |
| D | 7 | 238 | 234452 | 1403.37 | 711 | 696 | 166.6 |
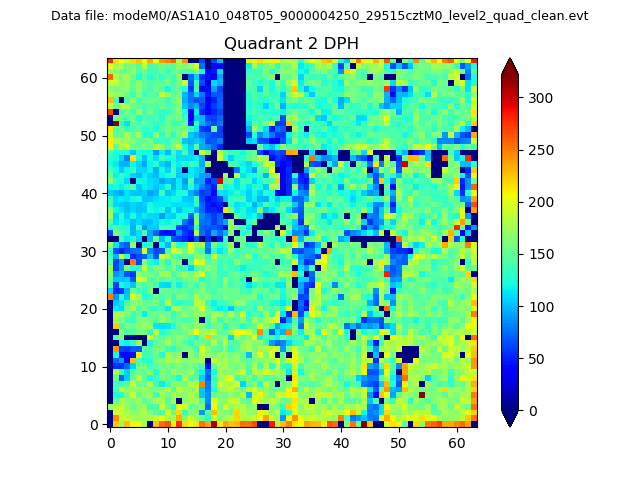
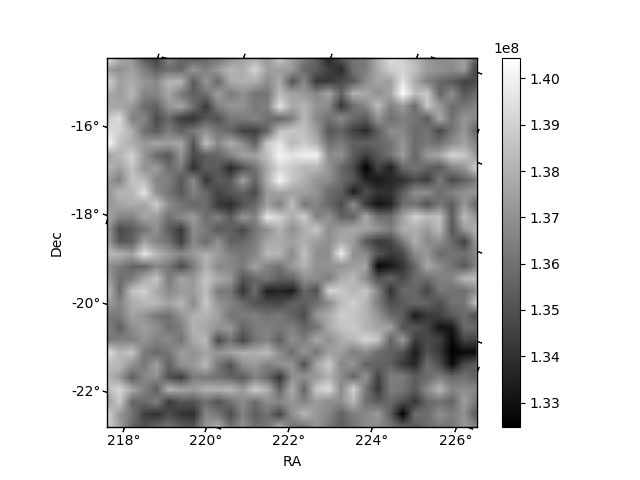
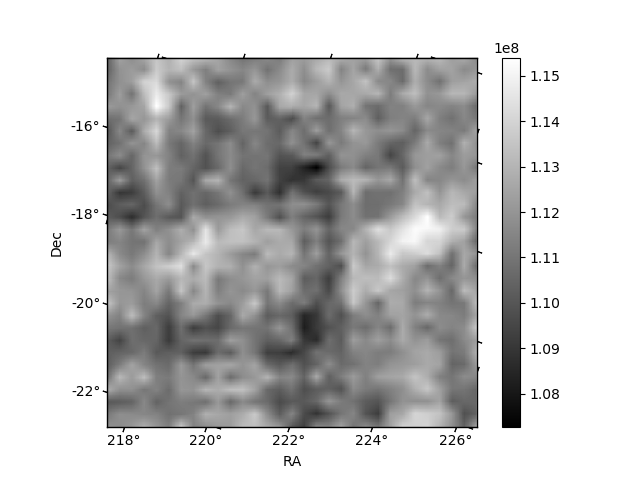
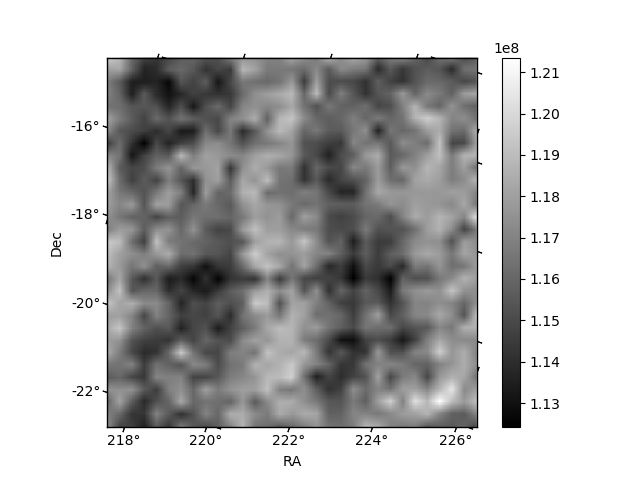
Histogram calculated using DETX and DETY for each event in the final _common_clean file
| Quadrant A | 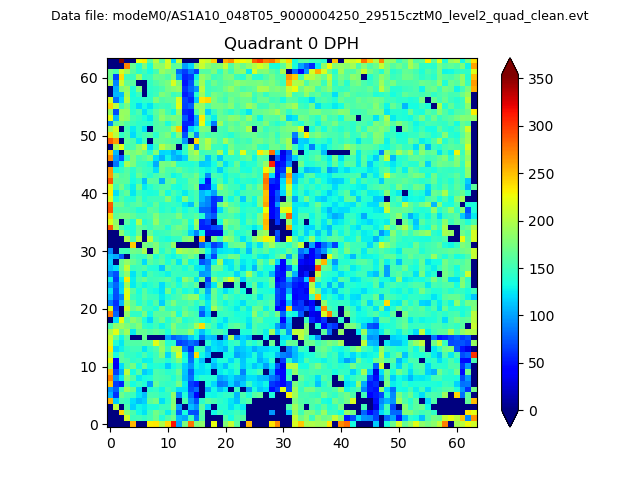 |
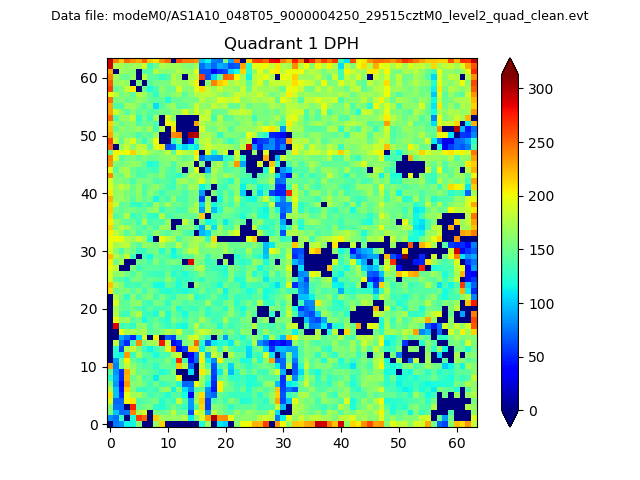 |
Quadrant B |
|---|---|---|---|
| Quadrant D | 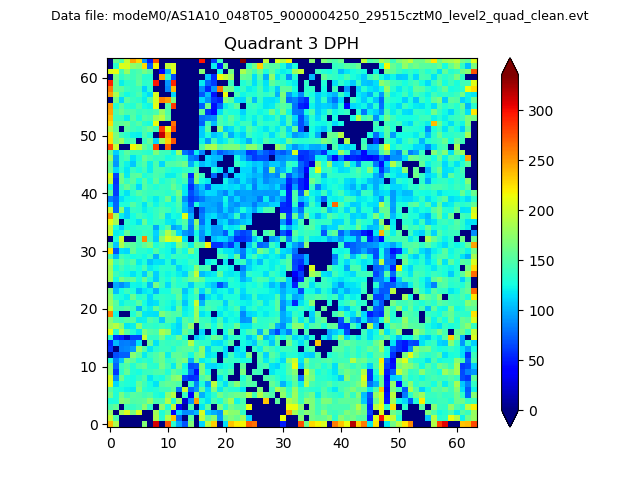 |
 |
Quadrant C |
| Plot type | Count rate plots | Images |
|---|---|---|
| Comparison with Poisson distribution Blue bars denote a histogram of data divided into 1 sec bins. Red curve is a Poisson curve with rate = median count rate of data. |
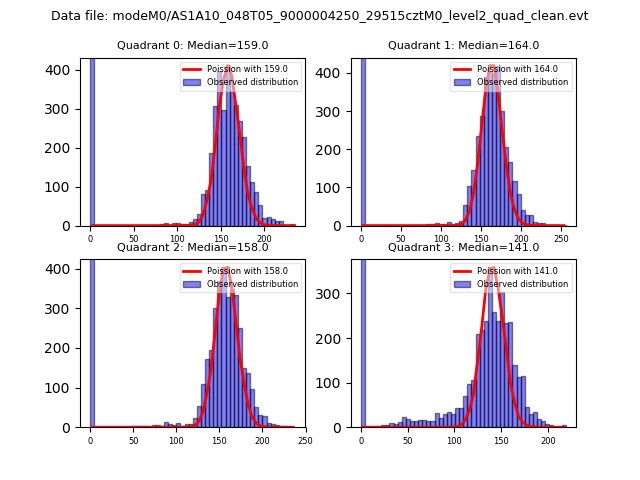 |
 |
| Quadrant-wise count rates Data is divided into 100 sec bins |
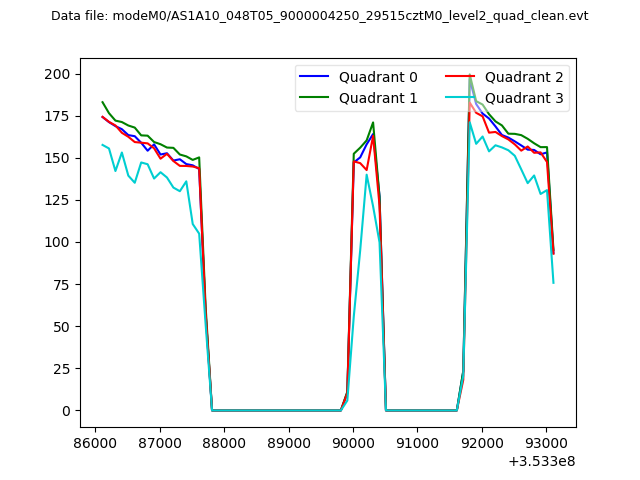 |
|
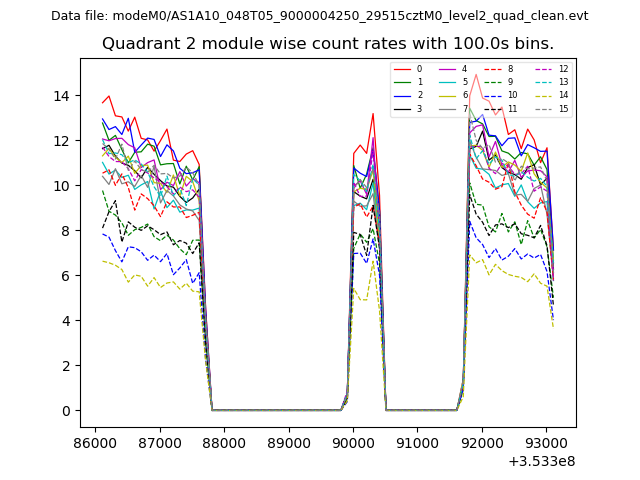
| Module-wise count rates for Quadrant A Data is divided into 100 sec bins |
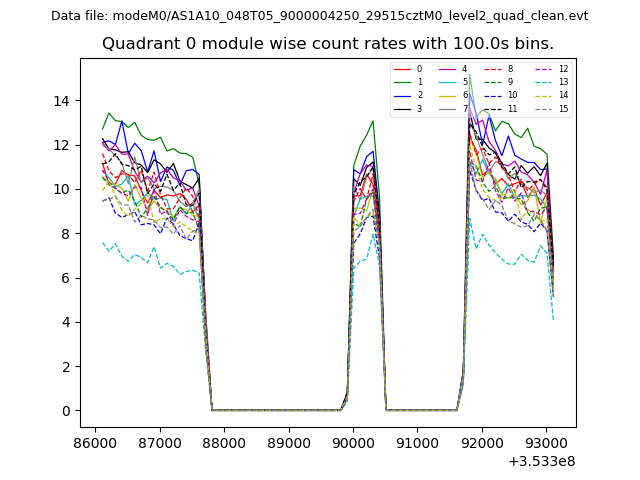 |
 |
| Module-wise count rates for Quadrant B Data is divided into 100 sec bins |
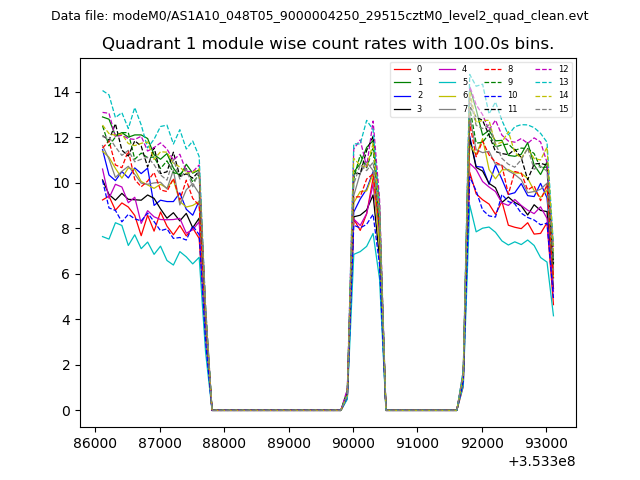 |
 |
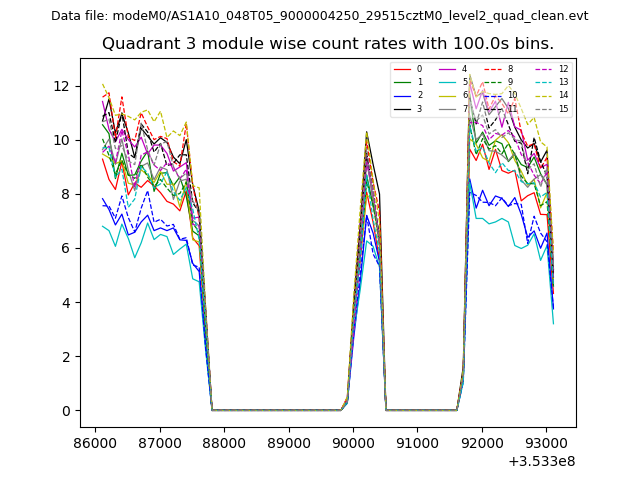
| Module-wise count rates for Quadrant C Data is divided into 100 sec bins |
 |
 |
| Module-wise count rates for Quadrant D Data is divided into 100 sec bins |
 |
 |
| Parameter | Plot |
|---|---|
| CZT HV Monitor | 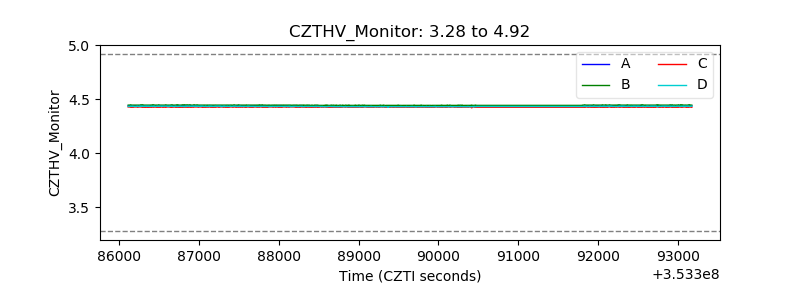 |
| D_VDD | 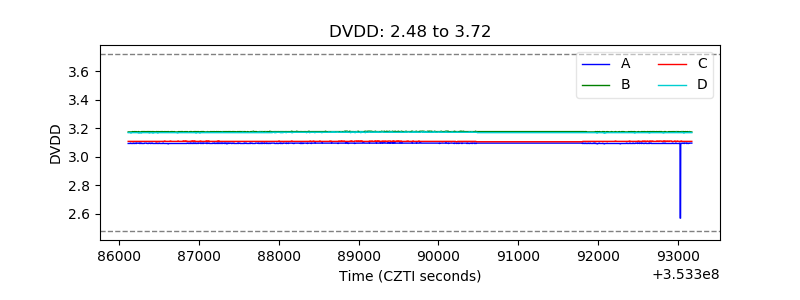 |
| Temperature 1 | 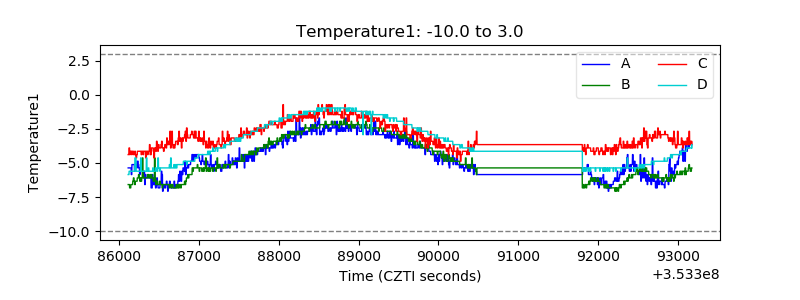 |
| Veto HV Monitor | 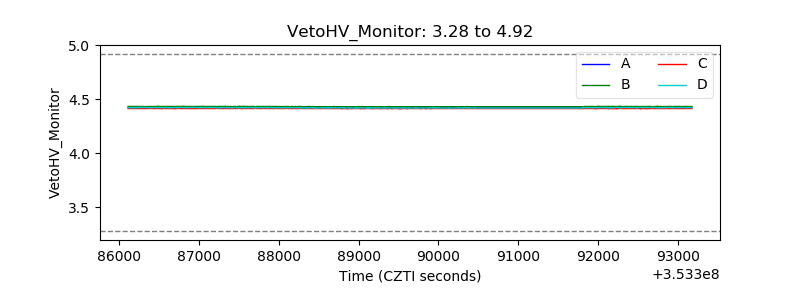 |
| Veto LLD | 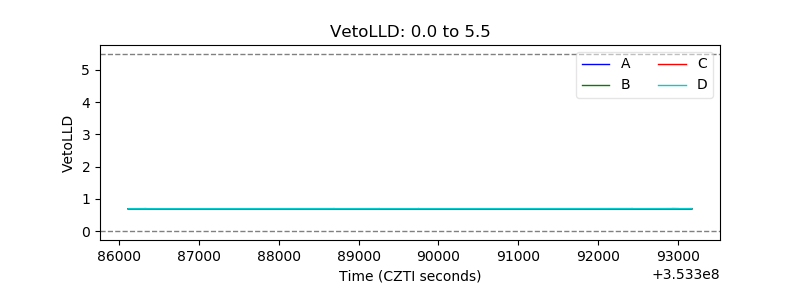 |
| Alpha Counter | 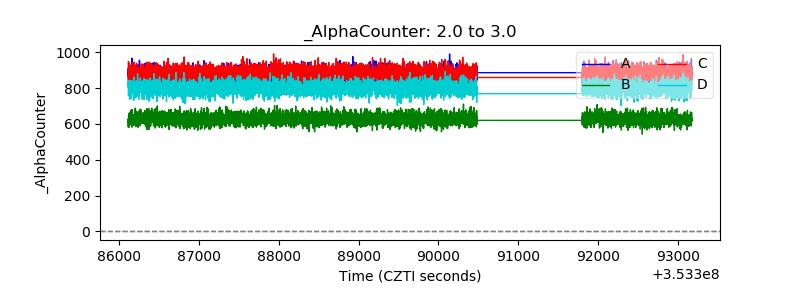 |
| _CPM_Rate | 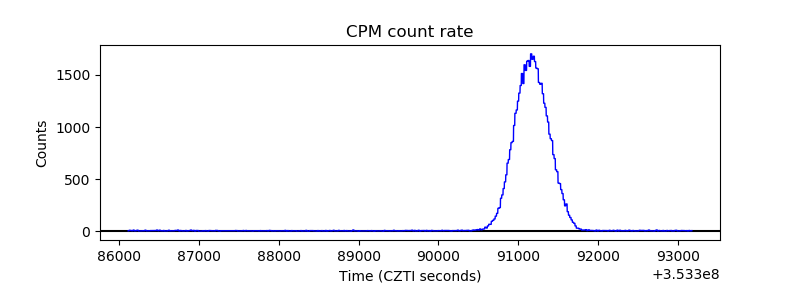 |
| CZT Counter | 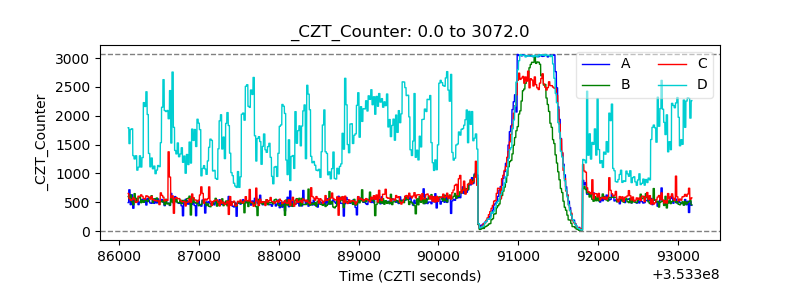 |
| +2.5 Volts monitor |  |
| +5 Volts monitor |  |
| _ROLL_ROT | 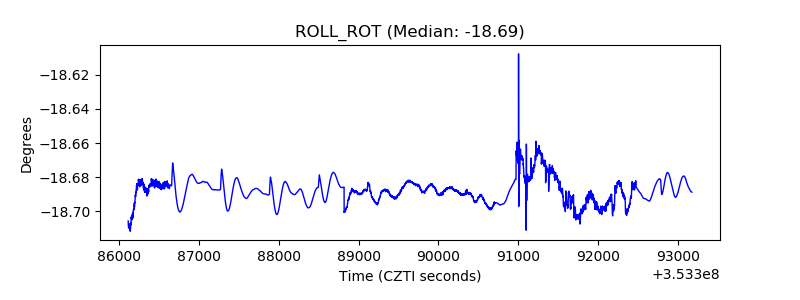 |
| _Roll_DEC | 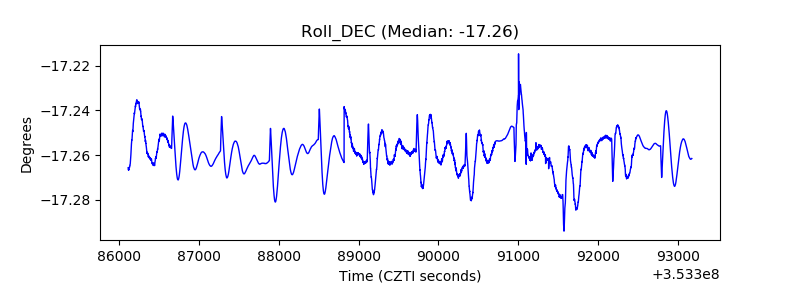 |
| _Roll_RA | 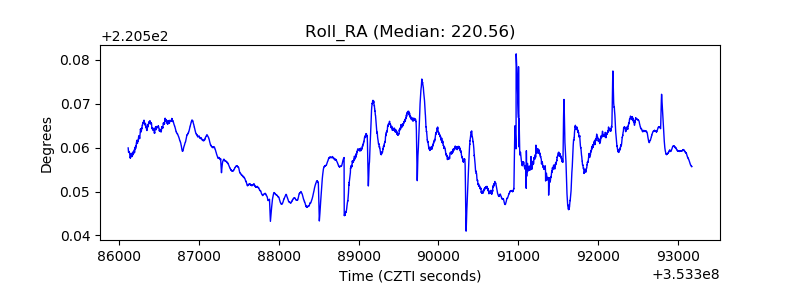 |
| Veto Counter | 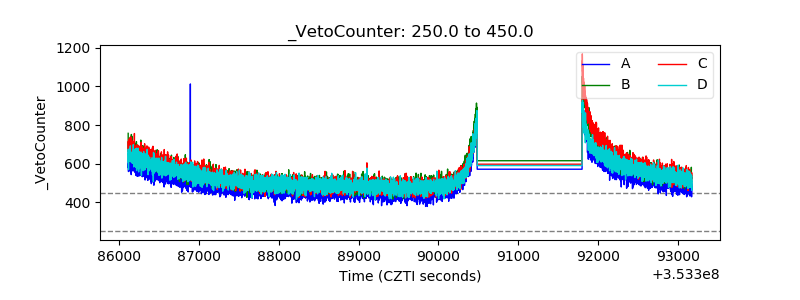 |