| Param | Original file | Final file |
|---|---|---|
| Filename | modeM0/AS1A10_048T05_9000004250_29516cztM0_level2.evt | modeM0/AS1A10_048T05_9000004250_29516cztM0_level2_quad_clean.evt |
| Size (bytes) | 754,833,600 | 96,652,800 |
| Size | 719.9 MB | 92.2 MB |
| Events in quadrant A | 3,345,948 | 641,711 |
| Events in quadrant B | 3,378,045 | 657,625 |
| Events in quadrant C | 4,126,340 | 622,553 |
| Events in quadrant D | 11,575,996 | 555,713 |
| Mode SS | |||
|---|---|---|---|
| Quadrant | BADHDUFLAG | Total packets | Discarded packets |
| A | 0 | 130 | 0 |
| B | 0 | 130 | 0 |
| C | 0 | 130 | 0 |
| D | 0 | 130 | 0 |
| Mode M9 | |||
|---|---|---|---|
| Quadrant | BADHDUFLAG | Total packets | Discarded packets |
| A | 0 | 16 | 0 |
| B | 0 | 17 | 0 |
| C | 0 | 17 | 0 |
| D | 0 | 17 | 0 |
| Mode M0 | |||
|---|---|---|---|
| Quadrant | BADHDUFLAG | Total packets | Discarded packets |
| A | 0 | 13543 | 2 |
| B | 0 | 13699 | 2 |
| C | 0 | 16269 | 2 |
| D | 0 | 38804 | 2 |
| Quadrant | Total seconds | Saturated seconds | Saturation percentage |
|---|---|---|---|
| A | 6439 | 51 | 0.792048% |
| B | 6439 | 67 | 1.040534% |
| C | 6439 | 348 | 5.404566% |
| D | 6439 | 1990 | 30.905420% |
Noise dominated data is calculated using 1-second bins in cleaned event files. If a bin has >2000 counts, and if more than 50% of those come from <1% of pixels, then it is considered to be noise-dominated and hence unusable.
| Quadrant | # 1 sec bins | Bins with >0 counts | Bins with >2000 counts | High rate bins dominated by noise | Noise dominated (total time) | Noise dominated (detector-on time) | Marked lightcurve |
|---|---|---|---|---|---|---|---|
| A | 7639 | 6440 | 0 | 0 | 0.00% | 0.00% | 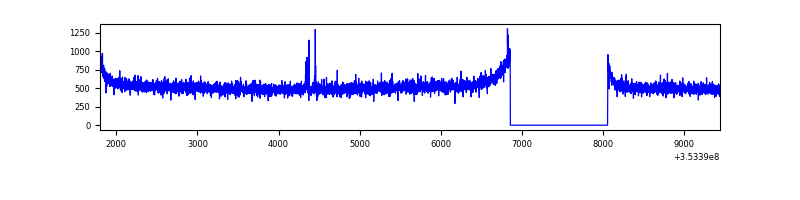 |
| B | 7639 | 6440 | 2 | 2 | 0.03% | 0.03% | 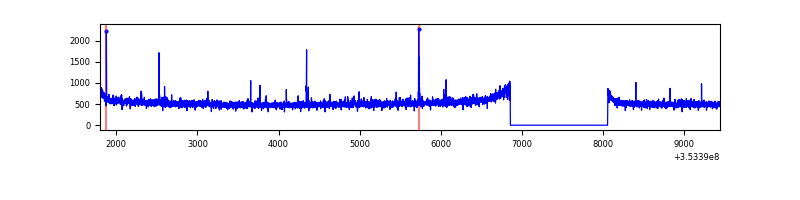 |
| C | 7639 | 6440 | 42 | 42 | 0.55% | 0.65% | 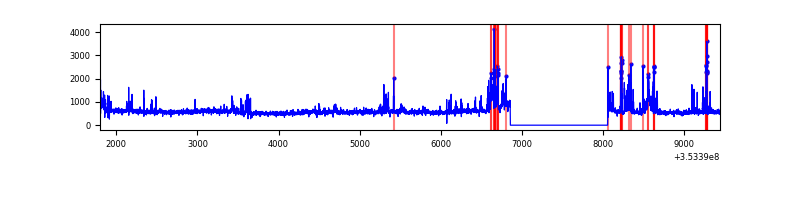 |
| D | 7639 | 6440 | 2395 | 2395 | 31.35% | 37.19% | 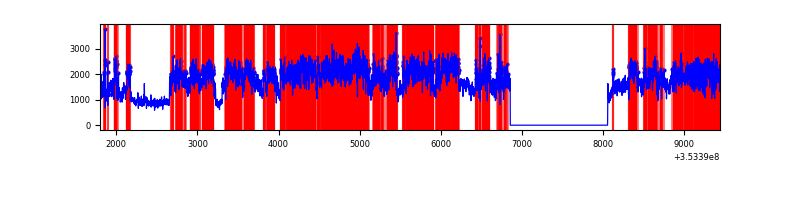 |
Top three noisy pixels from each quadrant. If the there are fewer than three noisy pixels in the level2.evt file, extra rows are filled as -1
| Pixel properties | Quadrant properties | ||||||
|---|---|---|---|---|---|---|---|
| Quadrant | DetID | PixID | Counts | Sigma | Mean | Median | Sigma |
| A | 13 | 254 | 11770 | 63.19 | 863 | 846 | 172.9 |
| A | 3 | 137 | 8003 | 41.4 | 863 | 846 | 172.9 |
| A | 15 | 174 | 7934 | 41.0 | 863 | 846 | 172.9 |
| B | 12 | 111 | 19324 | 114.2 | 852 | 831 | 161.9 |
| B | 11 | 111 | 17795 | 104.76 | 852 | 831 | 161.9 |
| B | 0 | 230 | 17168 | 100.89 | 852 | 831 | 161.9 |
| C | 7 | 247 | 405518 | 2102.9 | 825 | 833 | 192.4 |
| C | 3 | 233 | 270323 | 1400.38 | 825 | 833 | 192.4 |
| C | 14 | 238 | 167331 | 865.19 | 825 | 833 | 192.4 |
| D | 8 | 195 | 7033188 | 37777.8 | 794 | 775 | 186.2 |
| D | 7 | 80 | 973232 | 5223.99 | 794 | 775 | 186.2 |
| D | 12 | 33 | 404425 | 2168.39 | 794 | 775 | 186.2 |
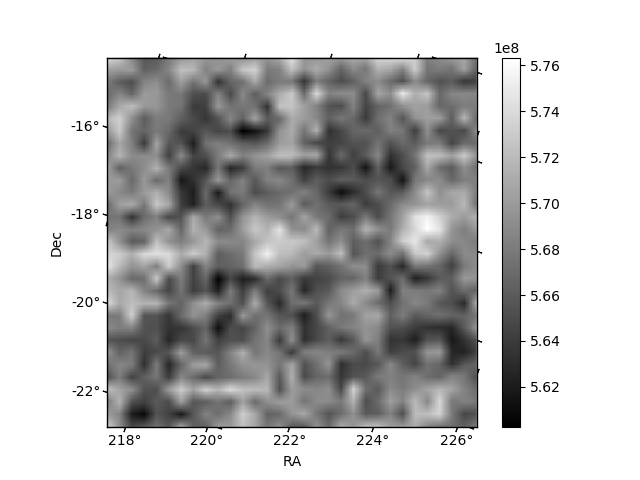
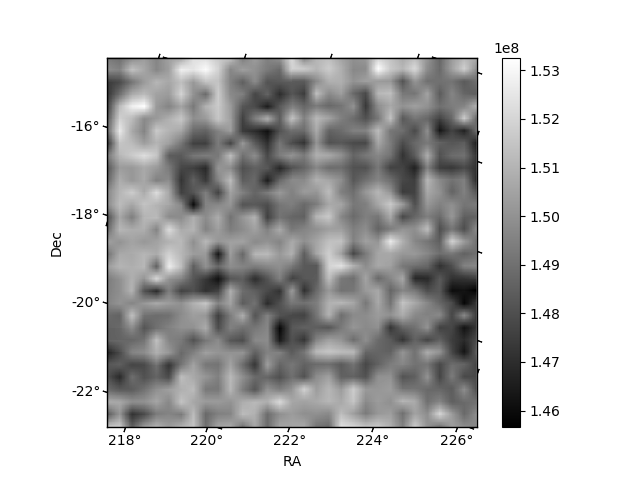
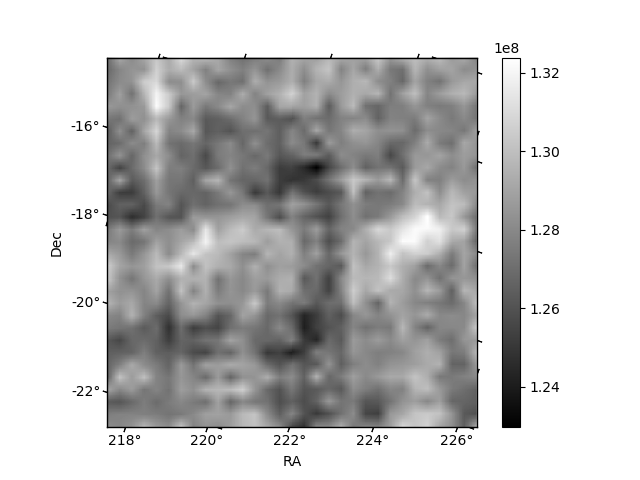
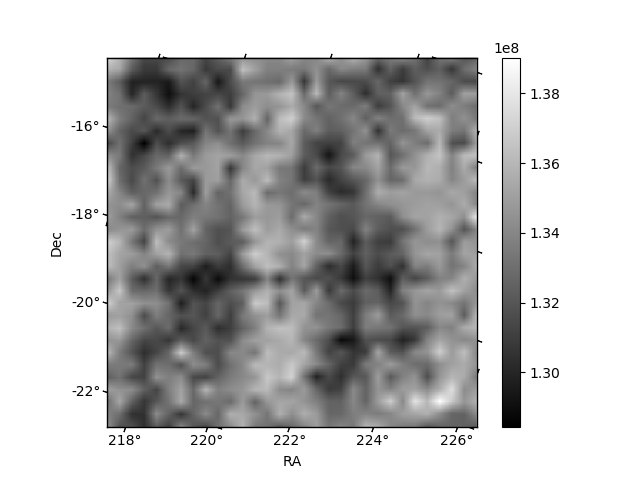
Histogram calculated using DETX and DETY for each event in the final _common_clean file
| Quadrant A | 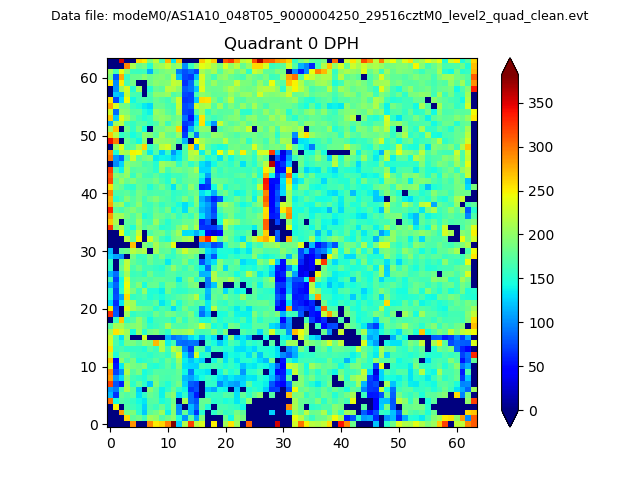 |
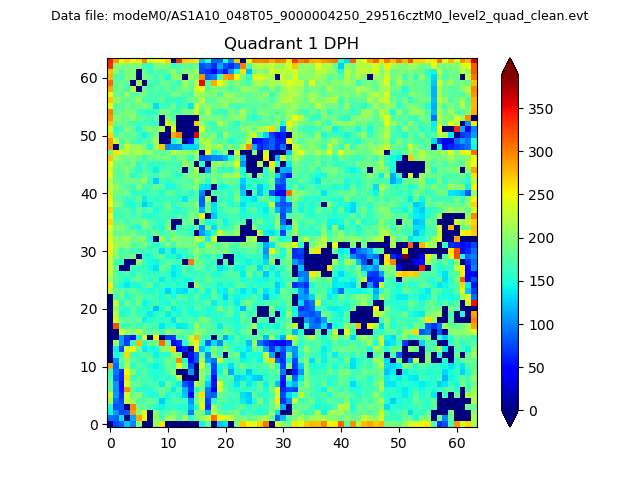 |
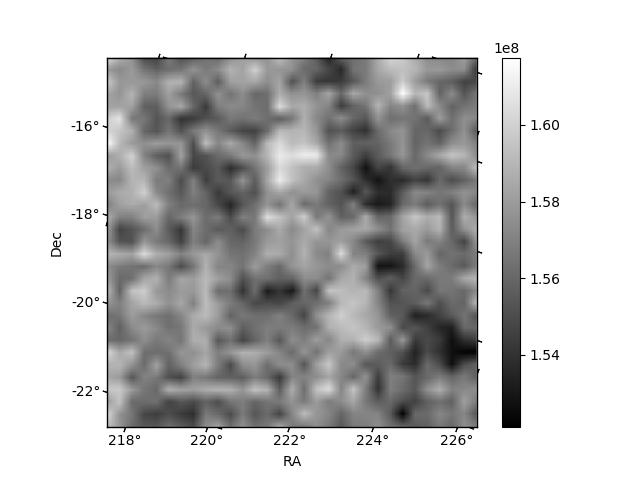
Quadrant B |
|---|---|---|---|
| Quadrant D | 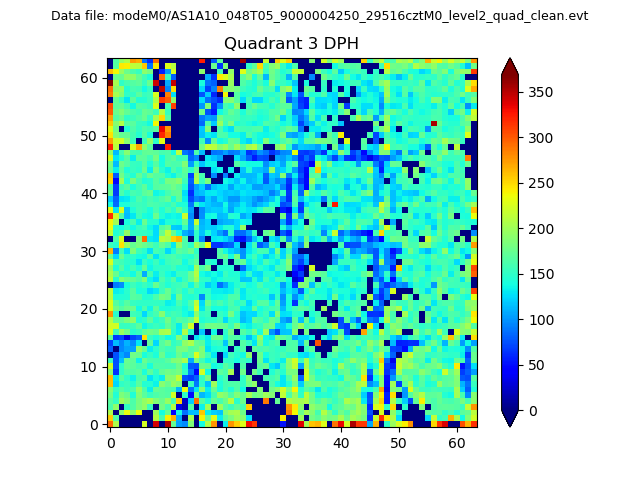 |
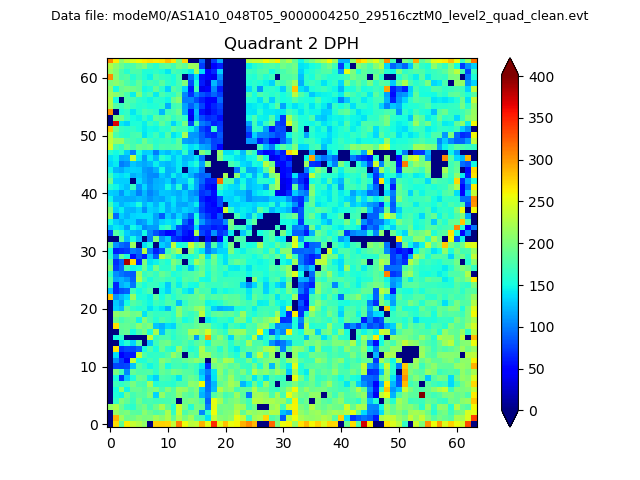 |
Quadrant C |
| Plot type | Count rate plots | Images |
|---|---|---|
| Comparison with Poisson distribution Blue bars denote a histogram of data divided into 1 sec bins. Red curve is a Poisson curve with rate = median count rate of data. |
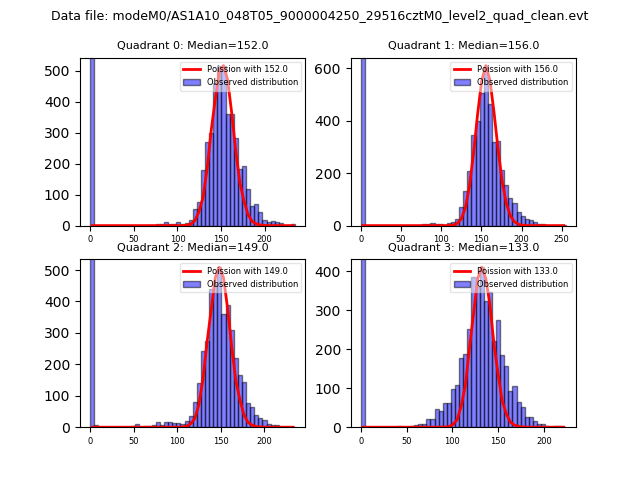 |
 |
| Quadrant-wise count rates Data is divided into 100 sec bins |
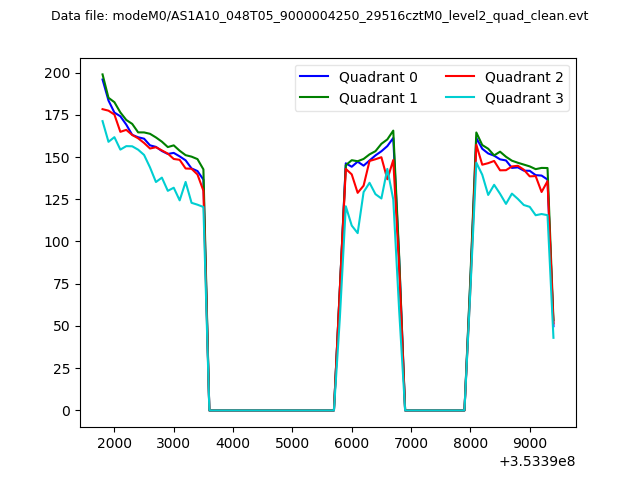 |
|
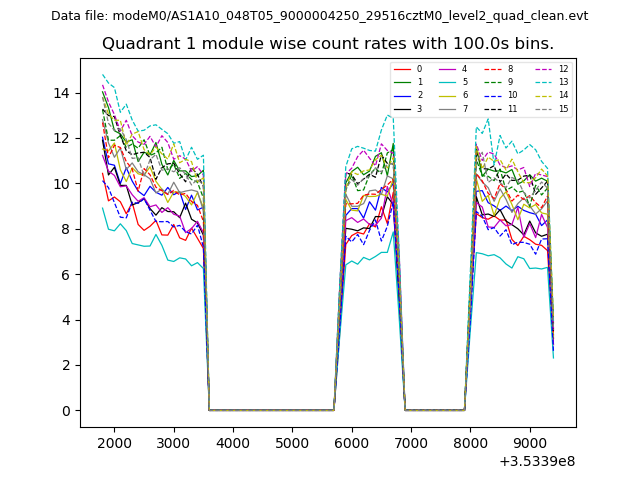
| Module-wise count rates for Quadrant A Data is divided into 100 sec bins |
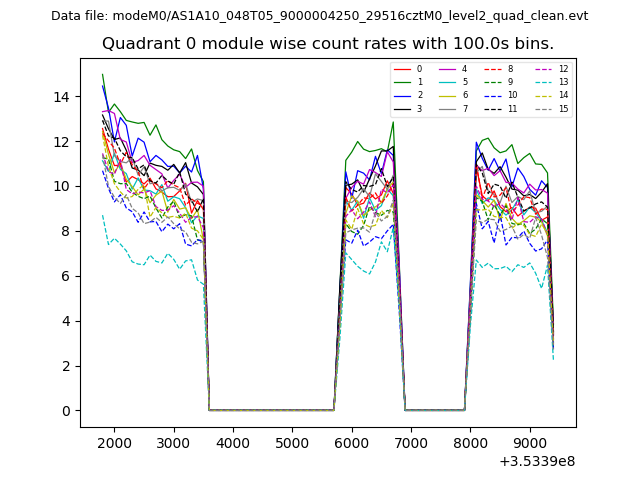 |
 |
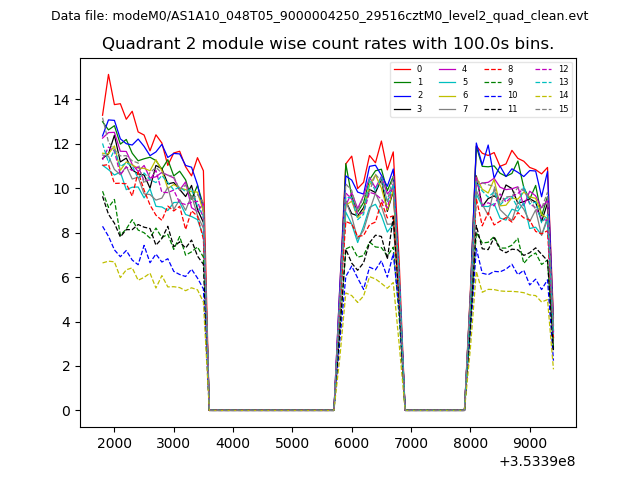
| Module-wise count rates for Quadrant B Data is divided into 100 sec bins |
 |
 |
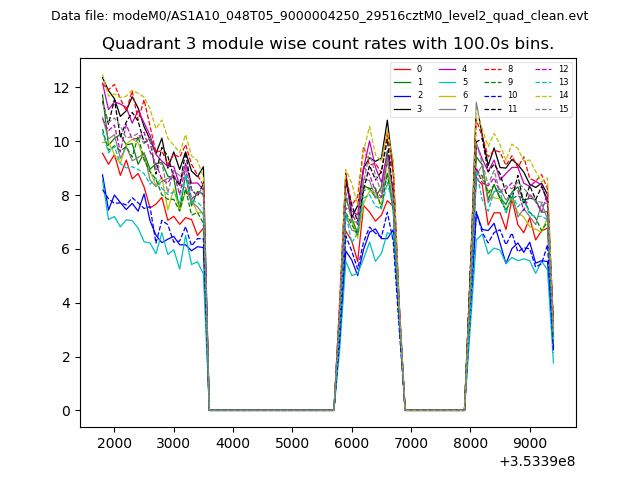
| Module-wise count rates for Quadrant C Data is divided into 100 sec bins |
 |
 |
| Module-wise count rates for Quadrant D Data is divided into 100 sec bins |
 |
 |
| Parameter | Plot |
|---|---|
| CZT HV Monitor | 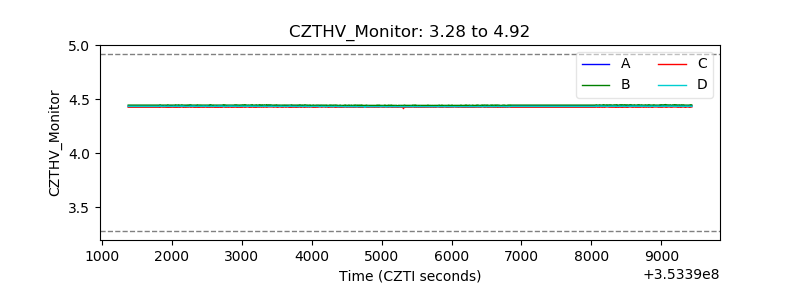 |
| D_VDD | 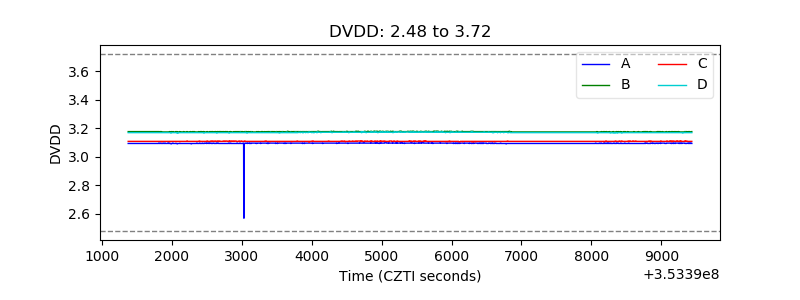 |
| Temperature 1 |  |
| Veto HV Monitor | 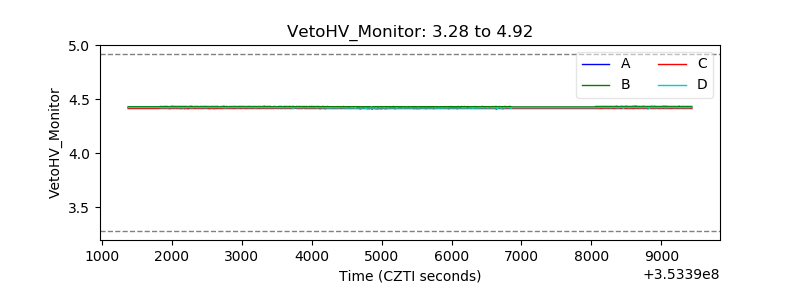 |
| Veto LLD | 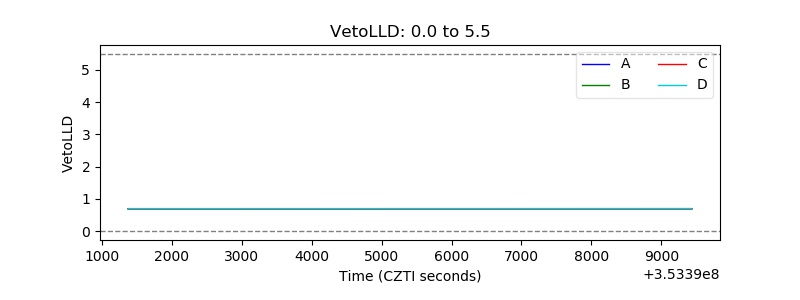 |
| Alpha Counter | 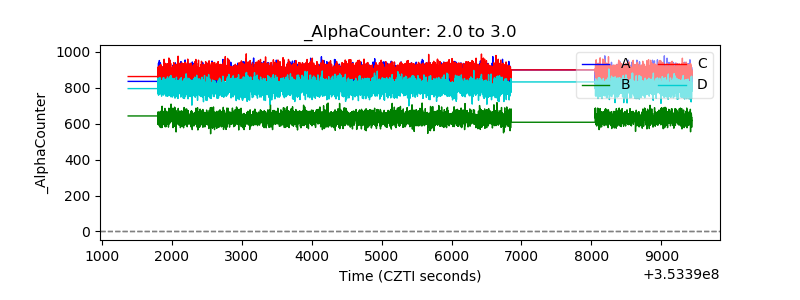 |
| _CPM_Rate | 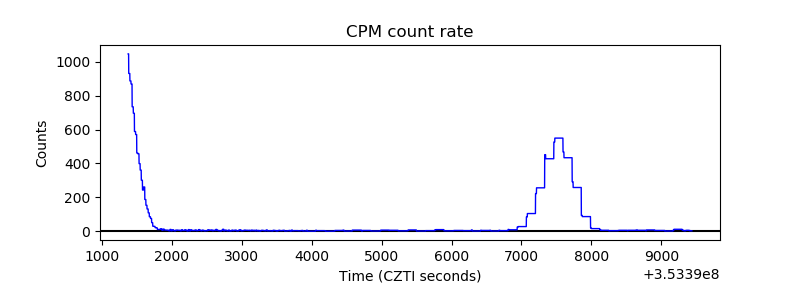 |
| CZT Counter | 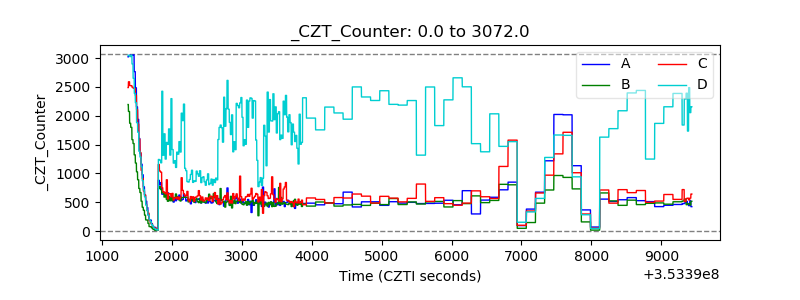 |
| +2.5 Volts monitor | 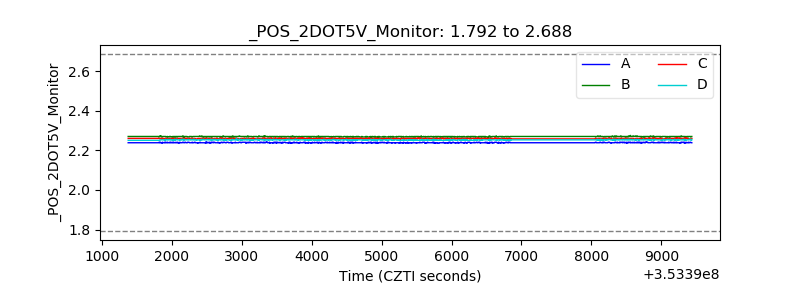 |
| +5 Volts monitor |  |
| _ROLL_ROT |  |
| _Roll_DEC | 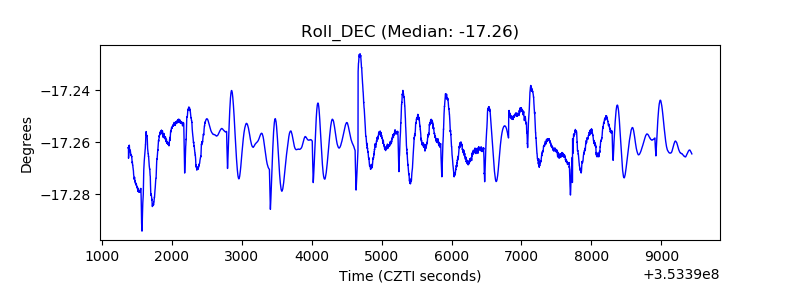 |
| _Roll_RA | 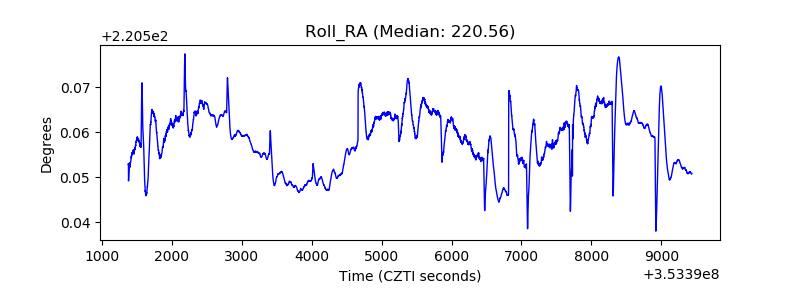 |
| Veto Counter | 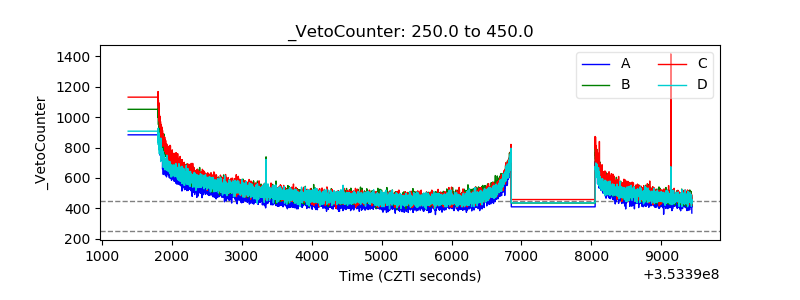 |