| Param | Original file | Final file |
|---|---|---|
| Filename | modeM0/AS1A10_048T05_9000004250_29517cztM0_level2.evt | modeM0/AS1A10_048T05_9000004250_29517cztM0_level2_quad_clean.evt |
| Size (bytes) | 800,928,000 | 90,406,080 |
| Size | 763.8 MB | 86.2 MB |
| Events in quadrant A | 3,387,483 | 587,468 |
| Events in quadrant B | 3,416,265 | 599,802 |
| Events in quadrant C | 4,624,691 | 573,609 |
| Events in quadrant D | 12,368,455 | 501,267 |
| Mode SS | |||
|---|---|---|---|
| Quadrant | BADHDUFLAG | Total packets | Discarded packets |
| A | 0 | 140 | 0 |
| B | 0 | 140 | 0 |
| C | 0 | 140 | 0 |
| D | 0 | 140 | 0 |
| Mode M9 | |||
|---|---|---|---|
| Quadrant | BADHDUFLAG | Total packets | Discarded packets |
| A | 0 | 9 | 0 |
| B | 0 | 9 | 0 |
| C | 0 | 9 | 0 |
| D | 0 | 9 | 0 |
| Mode M0 | |||
|---|---|---|---|
| Quadrant | BADHDUFLAG | Total packets | Discarded packets |
| A | 0 | 14064 | 2 |
| B | 0 | 14123 | 4 |
| C | 0 | 18301 | 2 |
| D | 0 | 41418 | 2 |
| Quadrant | Total seconds | Saturated seconds | Saturation percentage |
|---|---|---|---|
| A | 6817 | 110 | 1.613613% |
| B | 6816 | 115 | 1.687207% |
| C | 6817 | 257 | 3.769987% |
| D | 6817 | 2286 | 33.533813% |
Noise dominated data is calculated using 1-second bins in cleaned event files. If a bin has >2000 counts, and if more than 50% of those come from <1% of pixels, then it is considered to be noise-dominated and hence unusable.
| Quadrant | # 1 sec bins | Bins with >0 counts | Bins with >2000 counts | High rate bins dominated by noise | Noise dominated (total time) | Noise dominated (detector-on time) | Marked lightcurve |
|---|---|---|---|---|---|---|---|
| A | 7637 | 6819 | 0 | 0 | 0.00% | 0.00% | 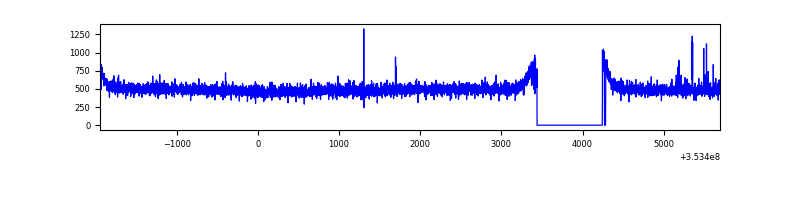 |
| B | 7636 | 6818 | 2 | 2 | 0.03% | 0.03% | 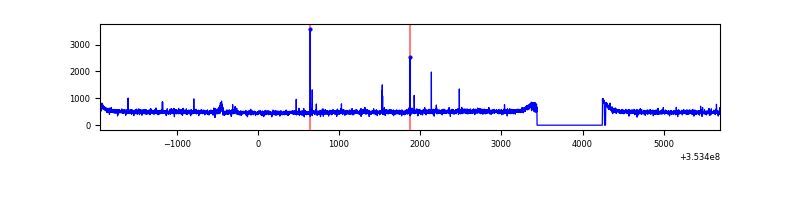 |
| C | 7637 | 6819 | 31 | 31 | 0.41% | 0.45% | 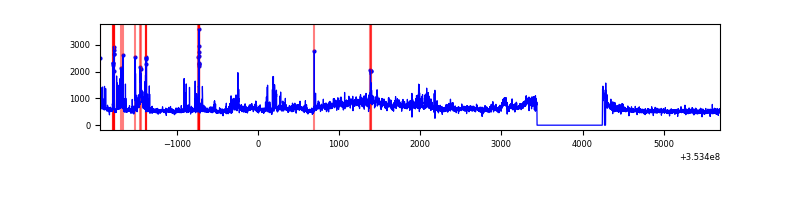 |
| D | 7637 | 6819 | 2542 | 2542 | 33.29% | 37.28% | 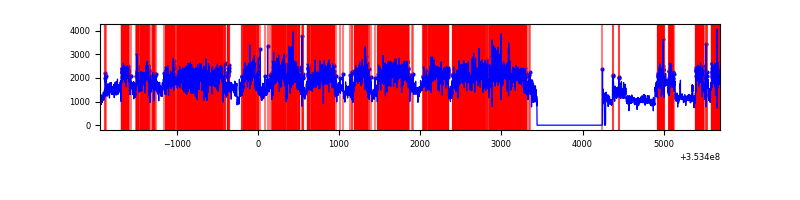 |
Top three noisy pixels from each quadrant. If the there are fewer than three noisy pixels in the level2.evt file, extra rows are filled as -1
| Pixel properties | Quadrant properties | ||||||
|---|---|---|---|---|---|---|---|
| Quadrant | DetID | PixID | Counts | Sigma | Mean | Median | Sigma |
| A | 0 | 13 | 16026 | 86.16 | 874 | 854 | 176.1 |
| A | 13 | 254 | 12282 | 64.9 | 874 | 854 | 176.1 |
| A | 3 | 137 | 8482 | 43.32 | 874 | 854 | 176.1 |
| B | 12 | 111 | 20120 | 116.22 | 861 | 839 | 165.9 |
| B | 11 | 111 | 18406 | 105.89 | 861 | 839 | 165.9 |
| B | 14 | 111 | 17265 | 99.01 | 861 | 839 | 165.9 |
| C | 3 | 233 | 815826 | 4137.34 | 841 | 849 | 197.0 |
| C | 7 | 247 | 351059 | 1777.89 | 841 | 849 | 197.0 |
| C | 14 | 238 | 139431 | 703.53 | 841 | 849 | 197.0 |
| D | 8 | 195 | 6831138 | 35913.88 | 800 | 779 | 190.2 |
| D | 7 | 80 | 1690817 | 8886.18 | 800 | 779 | 190.2 |
| D | 7 | 223 | 537982 | 2824.6 | 800 | 779 | 190.2 |
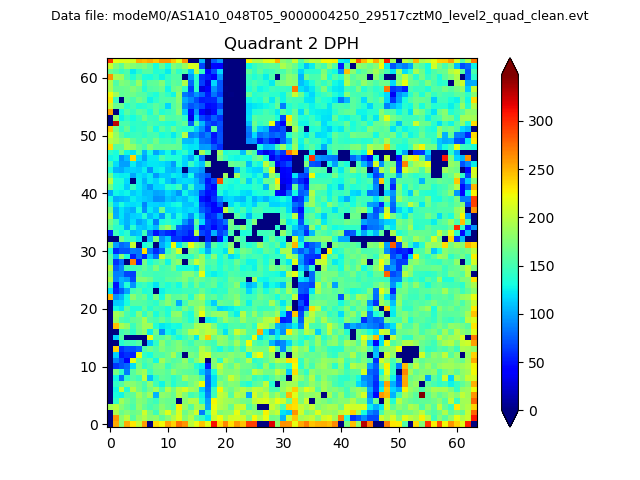
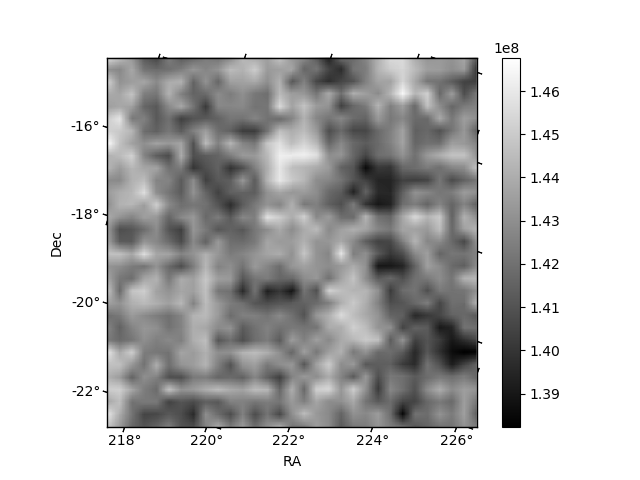
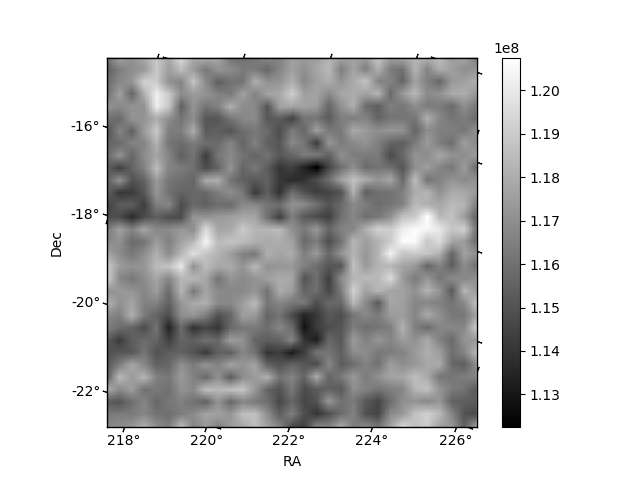
Histogram calculated using DETX and DETY for each event in the final _common_clean file
| Quadrant A | 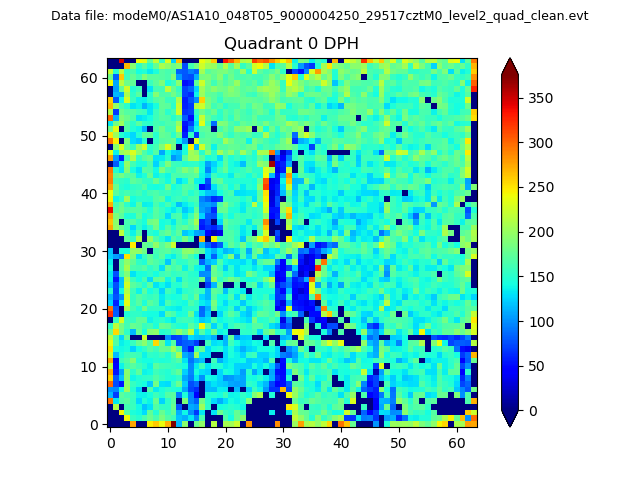 |
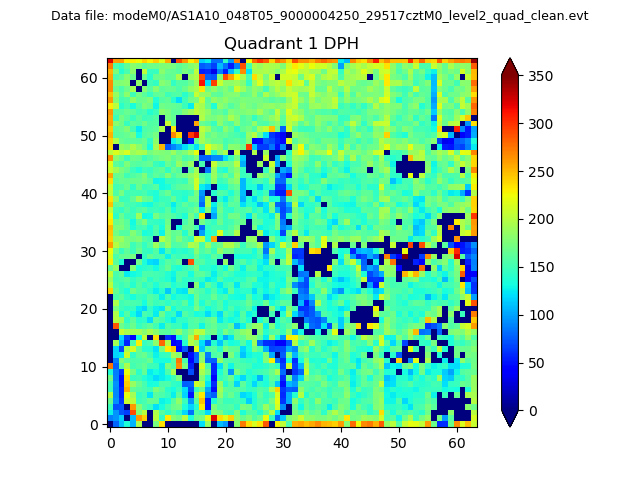 |
Quadrant B |
|---|---|---|---|
| Quadrant D | 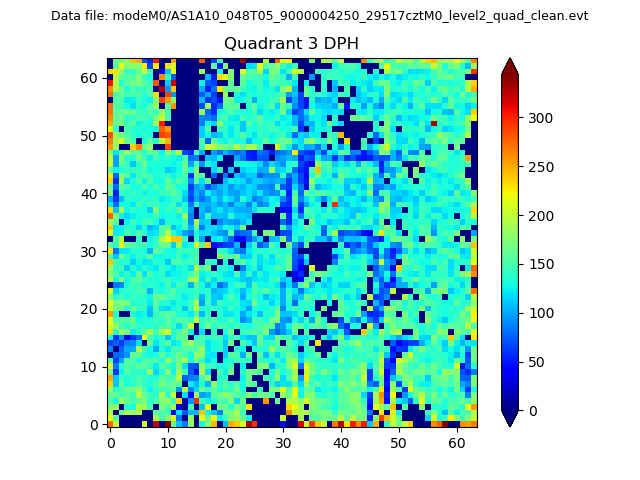 |
 |
Quadrant C |
| Plot type | Count rate plots | Images |
|---|---|---|
| Comparison with Poisson distribution Blue bars denote a histogram of data divided into 1 sec bins. Red curve is a Poisson curve with rate = median count rate of data. |
 |
 |
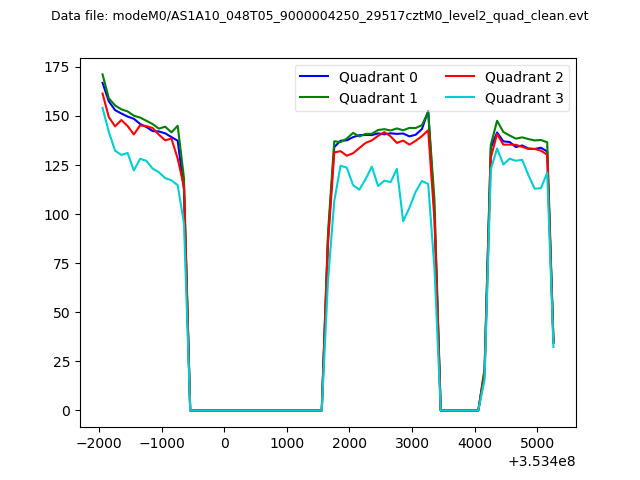
| Quadrant-wise count rates Data is divided into 100 sec bins |
 |
|
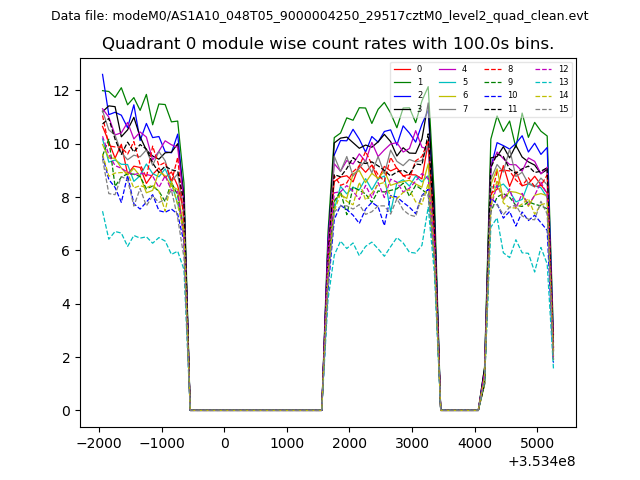
| Module-wise count rates for Quadrant A Data is divided into 100 sec bins |
 |
 |
| Module-wise count rates for Quadrant B Data is divided into 100 sec bins |
 |
 |
| Module-wise count rates for Quadrant C Data is divided into 100 sec bins |
 |
 |
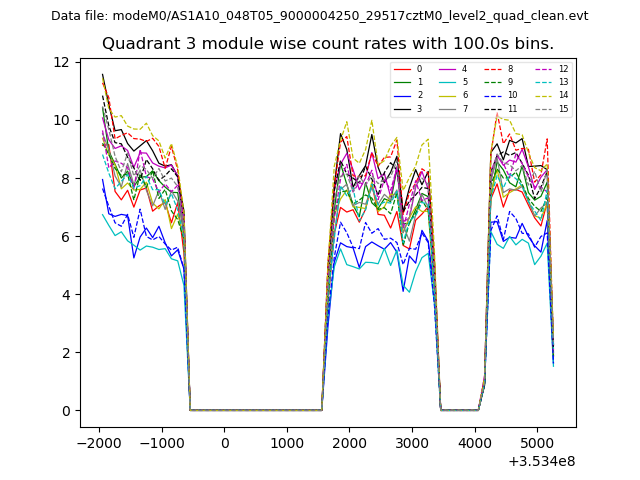
| Module-wise count rates for Quadrant D Data is divided into 100 sec bins |
 |
 |
| Parameter | Plot |
|---|---|
| CZT HV Monitor |  |
| D_VDD | 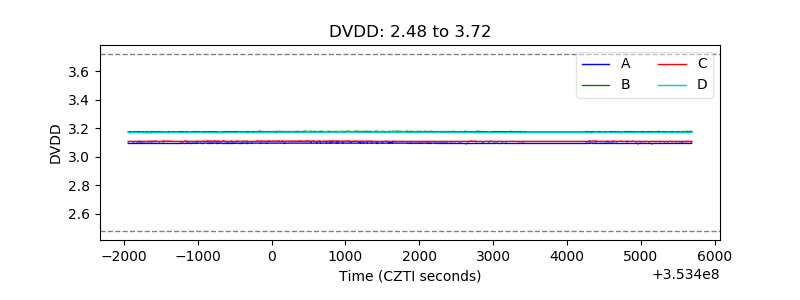 |
| Temperature 1 | 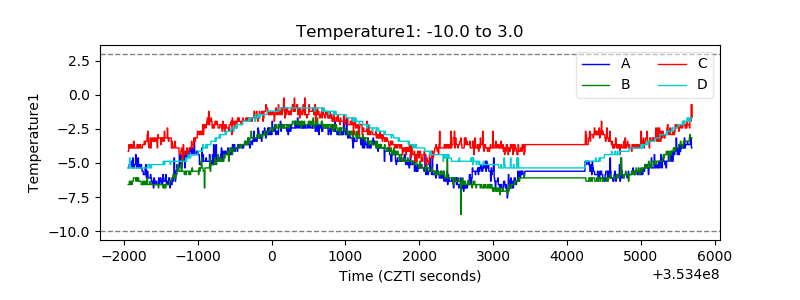 |
| Veto HV Monitor | 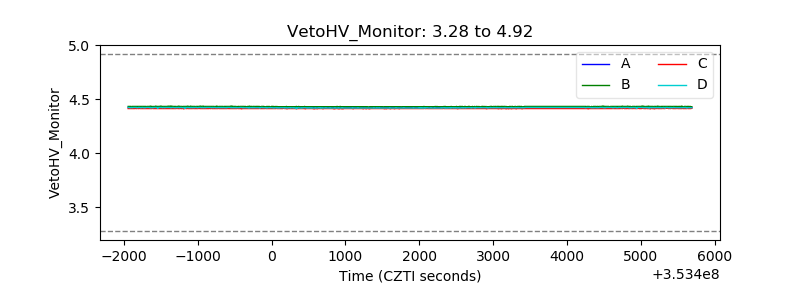 |
| Veto LLD | 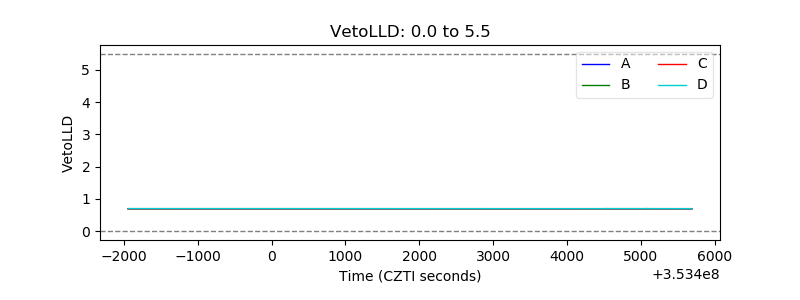 |
| Alpha Counter | 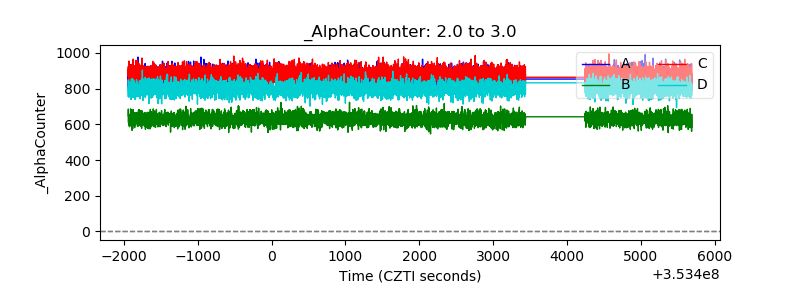 |
| _CPM_Rate | 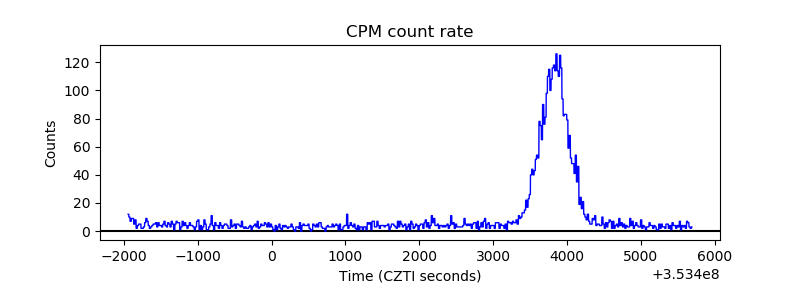 |
| CZT Counter | 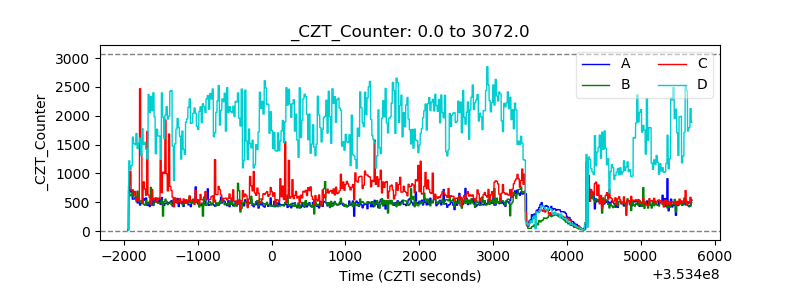 |
| +2.5 Volts monitor |  |
| +5 Volts monitor |  |
| _ROLL_ROT | 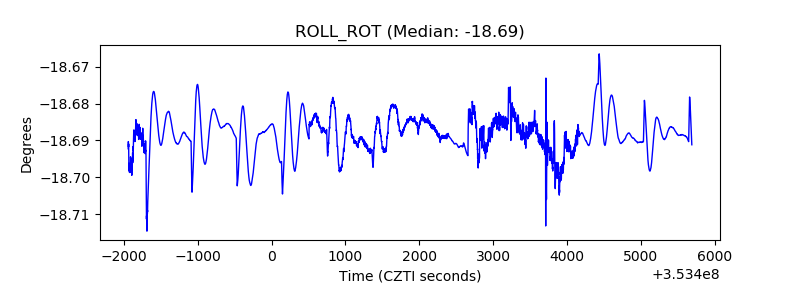 |
| _Roll_DEC | 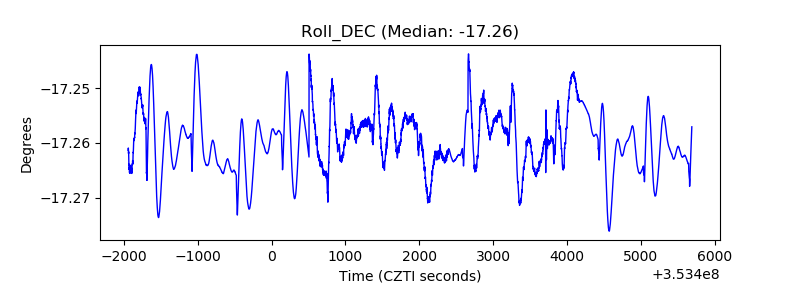 |
| _Roll_RA | 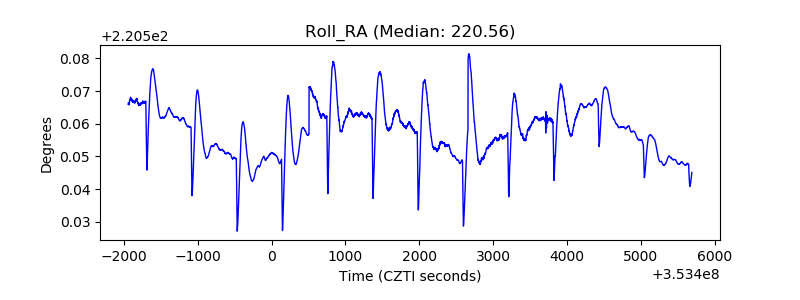 |
| Veto Counter | 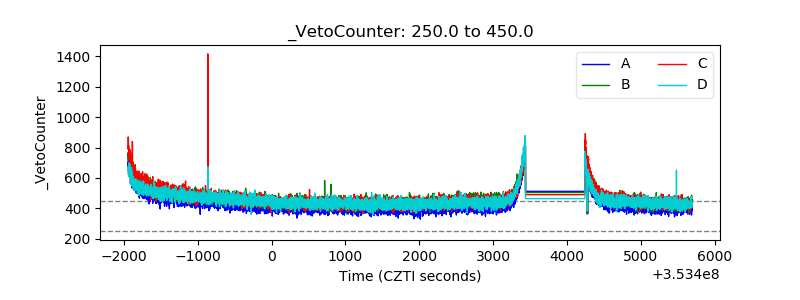 |