| Param | Original file | Final file |
|---|---|---|
| Filename | modeM0/AS1A10_048T05_9000004250_29518cztM0_level2.evt | modeM0/AS1A10_048T05_9000004250_29518cztM0_level2_quad_clean.evt |
| Size (bytes) | 826,888,320 | 83,554,560 |
| Size | 788.6 MB | 79.7 MB |
| Events in quadrant A | 3,535,051 | 535,128 |
| Events in quadrant B | 3,562,599 | 548,061 |
| Events in quadrant C | 3,825,060 | 531,352 |
| Events in quadrant D | 13,636,450 | 416,238 |
| Mode SS | |||
|---|---|---|---|
| Quadrant | BADHDUFLAG | Total packets | Discarded packets |
| A | 0 | 146 | 0 |
| B | 0 | 146 | 0 |
| C | 0 | 146 | 0 |
| D | 0 | 146 | 0 |
| Mode M9 | |||
|---|---|---|---|
| Quadrant | BADHDUFLAG | Total packets | Discarded packets |
| A | 0 | 2 | 0 |
| B | 0 | 2 | 0 |
| C | 0 | 2 | 0 |
| D | 0 | 2 | 0 |
| Mode M0 | |||
|---|---|---|---|
| Quadrant | BADHDUFLAG | Total packets | Discarded packets |
| A | 0 | 14942 | 2 |
| B | 0 | 14934 | 2 |
| C | 0 | 15366 | 2 |
| D | 0 | 45476 | 2 |
| Quadrant | Total seconds | Saturated seconds | Saturation percentage |
|---|---|---|---|
| A | 7153 | 210 | 2.935831% |
| B | 7154 | 219 | 3.061224% |
| C | 7154 | 282 | 3.941851% |
| D | 7153 | 3259 | 45.561303% |
Noise dominated data is calculated using 1-second bins in cleaned event files. If a bin has >2000 counts, and if more than 50% of those come from <1% of pixels, then it is considered to be noise-dominated and hence unusable.
| Quadrant | # 1 sec bins | Bins with >0 counts | Bins with >2000 counts | High rate bins dominated by noise | Noise dominated (total time) | Noise dominated (detector-on time) | Marked lightcurve |
|---|---|---|---|---|---|---|---|
| A | 7403 | 7155 | 0 | 0 | 0.00% | 0.00% |  |
| B | 7404 | 7156 | 1 | 1 | 0.01% | 0.01% |  |
| C | 7404 | 7156 | 0 | 0 | 0.00% | 0.00% |  |
| D | 7403 | 7154 | 3328 | 3328 | 44.95% | 46.52% | 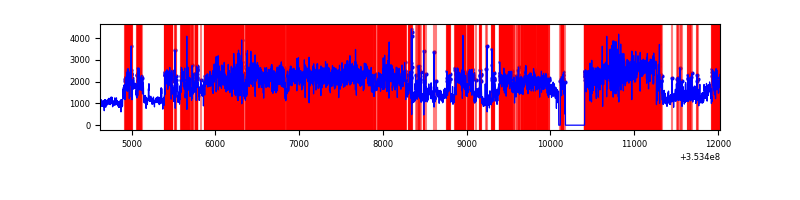 |
Top three noisy pixels from each quadrant. If the there are fewer than three noisy pixels in the level2.evt file, extra rows are filled as -1
| Pixel properties | Quadrant properties | ||||||
|---|---|---|---|---|---|---|---|
| Quadrant | DetID | PixID | Counts | Sigma | Mean | Median | Sigma |
| A | 0 | 13 | 20462 | 105.53 | 911 | 891 | 185.5 |
| A | 13 | 254 | 13145 | 66.08 | 911 | 891 | 185.5 |
| A | 3 | 137 | 9398 | 45.87 | 911 | 891 | 185.5 |
| B | 0 | 190 | 23021 | 124.82 | 897 | 873 | 177.4 |
| B | 12 | 111 | 21548 | 116.52 | 897 | 873 | 177.4 |
| B | 11 | 111 | 19843 | 106.91 | 897 | 873 | 177.4 |
| C | 3 | 233 | 214955 | 1028.79 | 878 | 884 | 208.1 |
| C | 14 | 238 | 150192 | 717.55 | 878 | 884 | 208.1 |
| C | 2 | 114 | 17194 | 78.38 | 878 | 884 | 208.1 |
| D | 8 | 195 | 7789653 | 42153.82 | 765 | 742 | 184.8 |
| D | 7 | 238 | 1692383 | 9155.21 | 765 | 742 | 184.8 |
| D | 7 | 223 | 676698 | 3658.29 | 765 | 742 | 184.8 |
Histogram calculated using DETX and DETY for each event in the final _common_clean file
| Quadrant A |  |
 |
Quadrant B |
|---|---|---|---|
| Quadrant D |  |
 |
Quadrant C |
| Plot type | Count rate plots | Images |
|---|---|---|
| Comparison with Poisson distribution Blue bars denote a histogram of data divided into 1 sec bins. Red curve is a Poisson curve with rate = median count rate of data. |
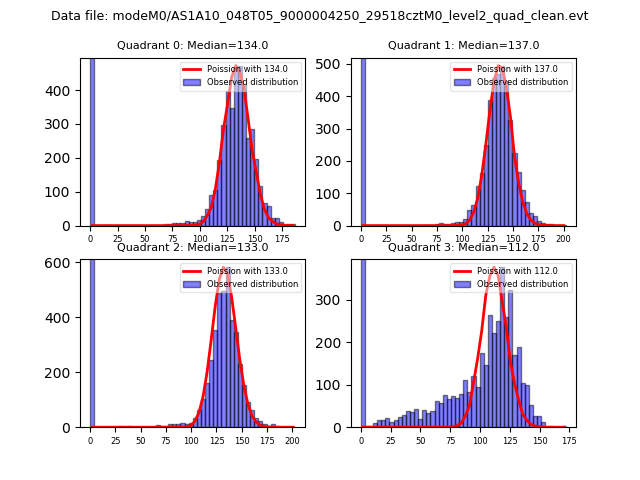 |
 |
| Quadrant-wise count rates Data is divided into 100 sec bins |
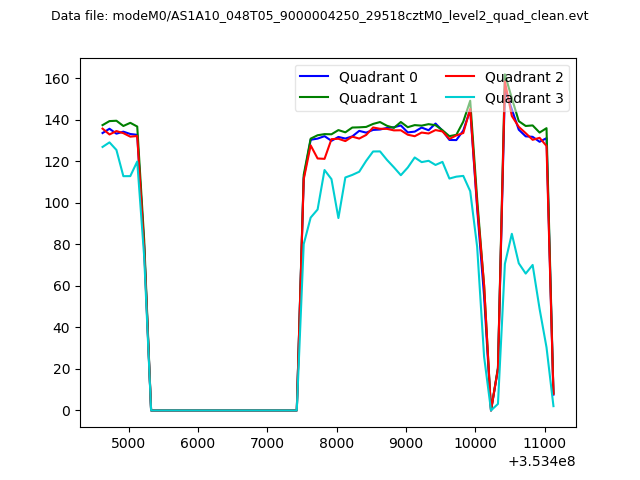 |
|
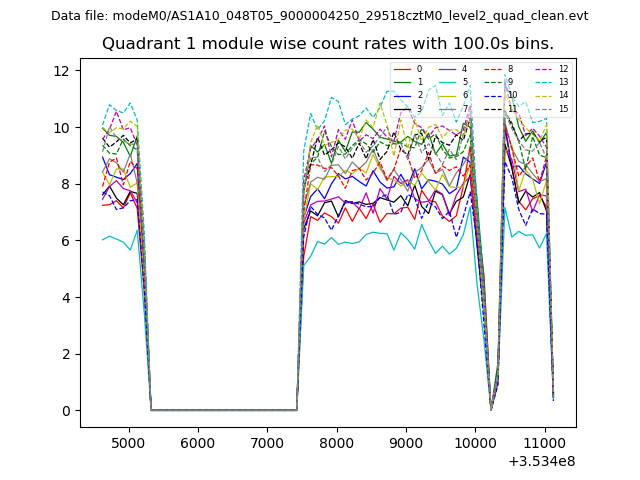
| Module-wise count rates for Quadrant A Data is divided into 100 sec bins |
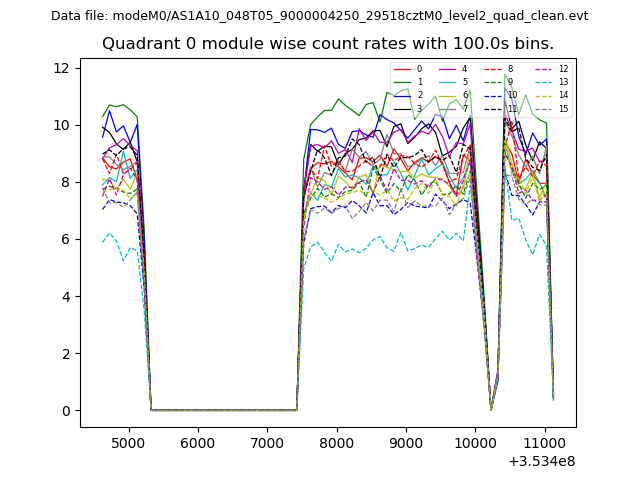 |
 |
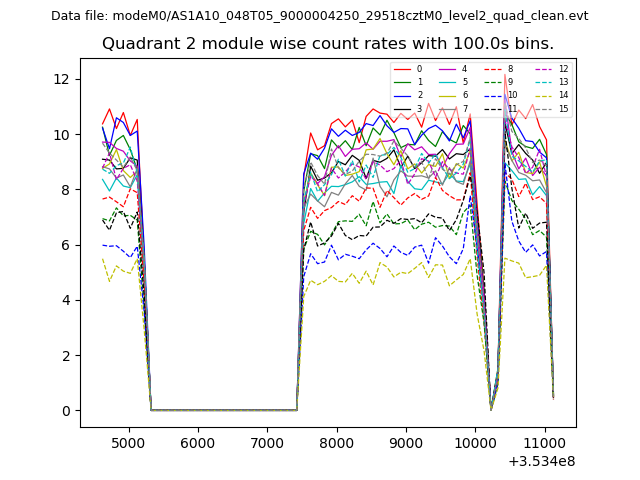
| Module-wise count rates for Quadrant B Data is divided into 100 sec bins |
 |
 |
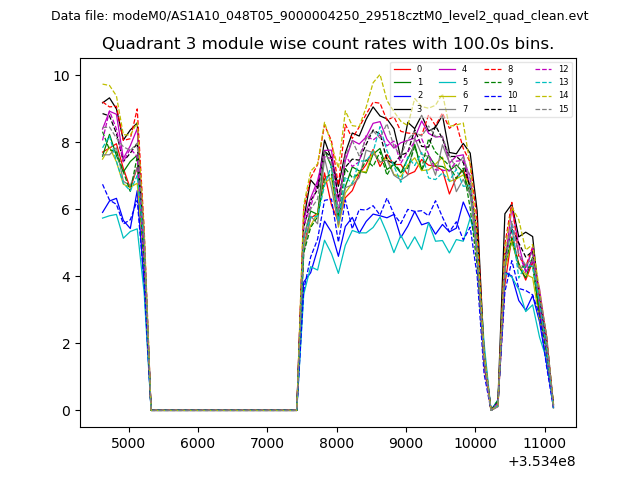
| Module-wise count rates for Quadrant C Data is divided into 100 sec bins |
 |
 |
| Module-wise count rates for Quadrant D Data is divided into 100 sec bins |
 |
 |
| Parameter | Plot |
|---|---|
| CZT HV Monitor | 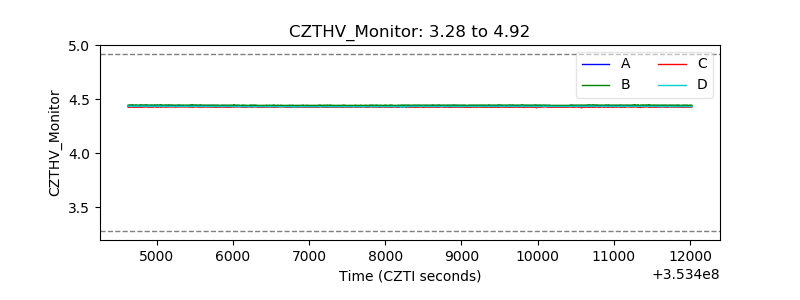 |
| D_VDD |  |
| Temperature 1 |  |
| Veto HV Monitor |  |
| Veto LLD |  |
| Alpha Counter | 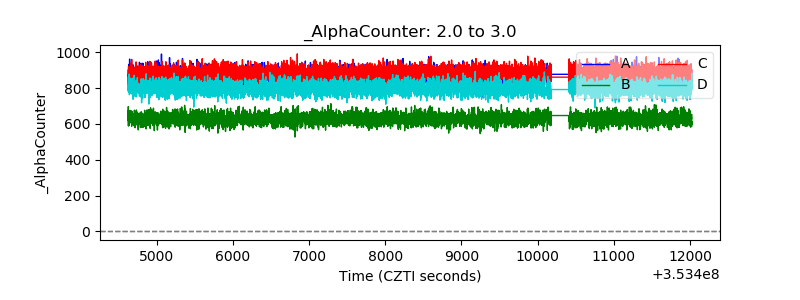 |
| _CPM_Rate | 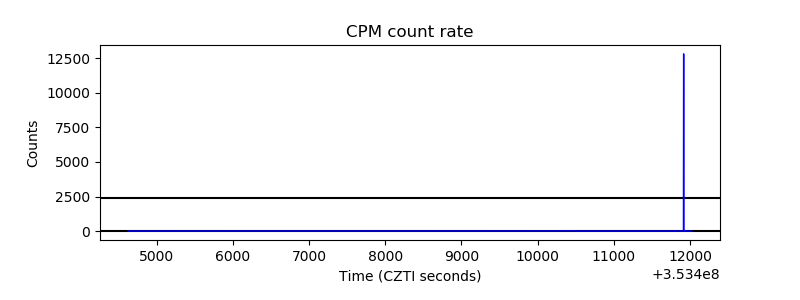 |
| CZT Counter |  |
| +2.5 Volts monitor |  |
| +5 Volts monitor |  |
| _ROLL_ROT | 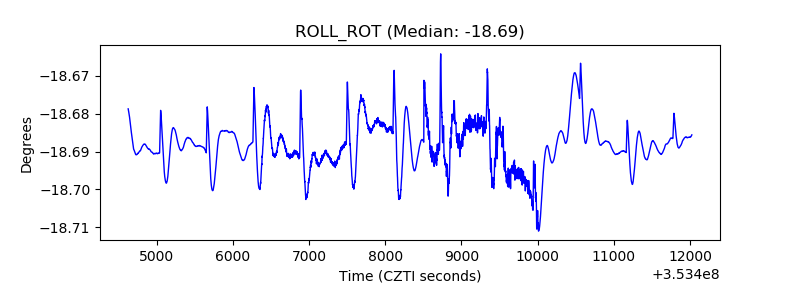 |
| _Roll_DEC |  |
| _Roll_RA |  |
| Veto Counter | 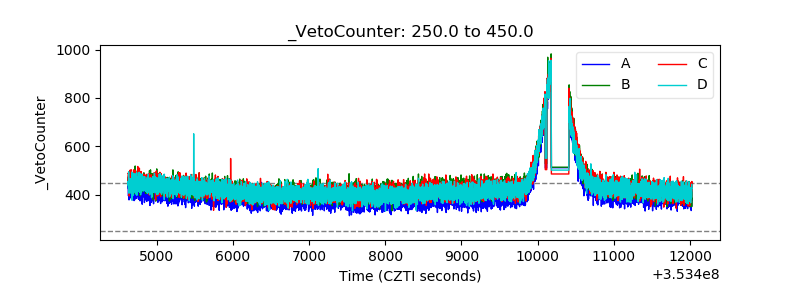 |