| Param | Original file | Final file |
|---|---|---|
| Filename | modeM0/AS1A10_094T06_9000004248cztM0_level2.fits | modeM0/AS1A10_094T06_9000004248cztM0_level2_quad_clean.evt |
| Size (bytes) | 161,507,520 | 81,803,520 |
| Size | 154.0 MB | 78.0 MB |
| Events in quadrant A | 1,068,204 | 448,193 |
| Events in quadrant B | 1,018,960 | 445,508 |
| Events in quadrant C | 1,053,560 | 434,225 |
| Events in quadrant D | 728,450 | 128,211 |
| Mode M0 | |||
|---|---|---|---|
| Quadrant | BADHDUFLAG | Total packets | Discarded packets |
| A | 0 | 31257 | 0 |
| B | 0 | 34222 | 0 |
| C | 0 | 35238 | 0 |
| D | 0 | 96445 | 0 |
| Mode M9 | |||
|---|---|---|---|
| Quadrant | BADHDUFLAG | Total packets | Discarded packets |
| A | 0 | 39 | 0 |
| B | 0 | 39 | 0 |
| C | 0 | 39 | 0 |
| D | 0 | 39 | 0 |
| Mode SS | |||
|---|---|---|---|
| Quadrant | BADHDUFLAG | Total packets | Discarded packets |
| A | 0 | 302 | 0 |
| B | 0 | 302 | 0 |
| C | 0 | 302 | 0 |
| D | 0 | 302 | 0 |
| Quadrant | Total seconds | Saturated seconds | Saturation percentage |
|---|---|---|---|
| A | 14755 | 126 | 0.853948% |
| B | 14755 | 264 | 1.789224% |
| C | 14755 | 416 | 2.819383% |
| D | 14755 | 7386 | 50.057608% |
Noise dominated data is calculated using 1-second bins in cleaned event files. If a bin has >2000 counts, and if more than 50% of those come from <1% of pixels, then it is considered to be noise-dominated and hence unusable.
| Quadrant | # 1 sec bins | Bins with >0 counts | Bins with >2000 counts | High rate bins dominated by noise | Noise dominated (total time) | Noise dominated (detector-on time) | Marked lightcurve |
|---|---|---|---|---|---|---|---|
| A | 18790 | 14755 | 0 | 0 | 0.00% | 0.00% |  |
| B | 18790 | 14755 | 0 | 0 | 0.00% | 0.00% |  |
| C | 18790 | 14754 | 0 | 0 | 0.00% | 0.00% |  |
| D | 18790 | 14724 | 0 | 0 | 0.00% | 0.00% | 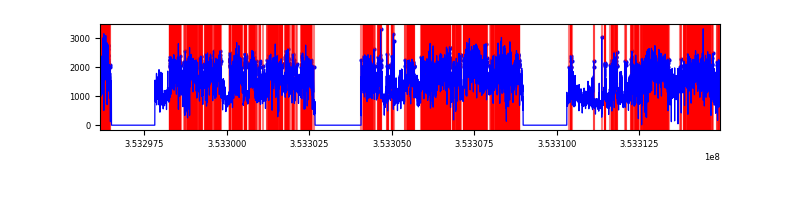 |
Top three noisy pixels from each quadrant. If the there are fewer than three noisy pixels in the level2.evt file, extra rows are filled as -1
| Pixel properties | Quadrant properties | ||||||
|---|---|---|---|---|---|---|---|
| Quadrant | DetID | PixID | Counts | Sigma | Mean | Median | Sigma |
| A | 0 | 29 | 882 | 9.16 | 278 | 266 | 67.3 |
| A | 7 | 110 | 853 | 8.73 | 278 | 266 | 67.3 |
| A | 0 | 30 | 794 | 7.85 | 278 | 266 | 67.3 |
| B | 2 | 9 | 810 | 10.28 | 270 | 262 | 53.3 |
| B | 3 | 80 | 713 | 8.46 | 270 | 262 | 53.3 |
| B | 5 | 128 | 697 | 8.16 | 270 | 262 | 53.3 |
| C | 1 | 81 | 834 | 7.99 | 279 | 266 | 71.1 |
| C | 1 | 80 | 823 | 7.84 | 279 | 266 | 71.1 |
| C | 3 | 187 | 729 | 6.51 | 279 | 266 | 71.1 |
| D | 15 | 46 | 575 | 6.84 | 208 | 192 | 56.0 |
| D | 6 | 38 | 520 | 5.86 | 208 | 192 | 56.0 |
| D | 10 | 189 | 512 | 5.71 | 208 | 192 | 56.0 |
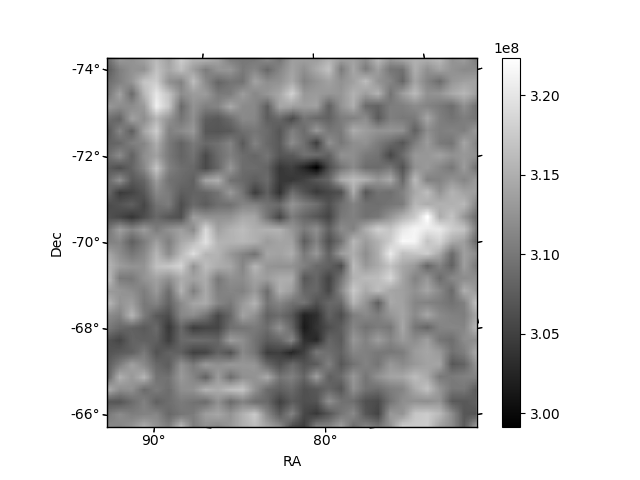
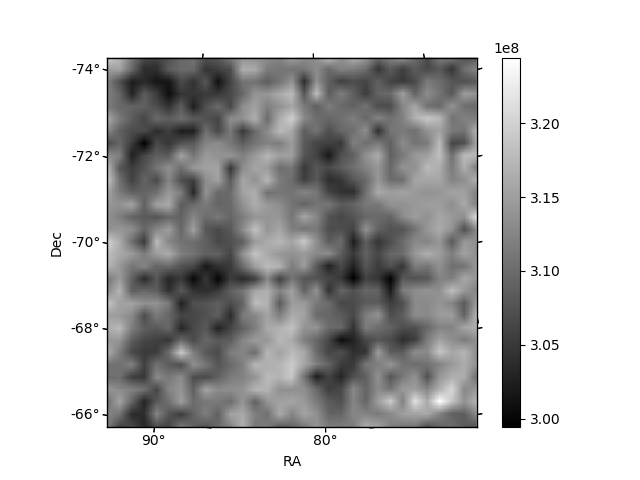
Histogram calculated using DETX and DETY for each event in the final _common_clean file
| Quadrant A | 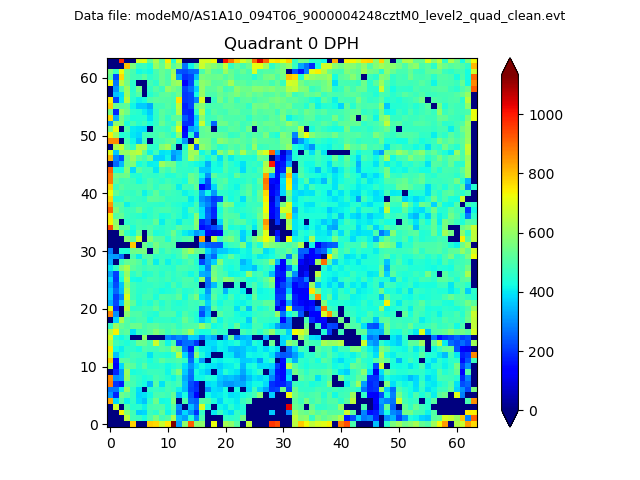 |
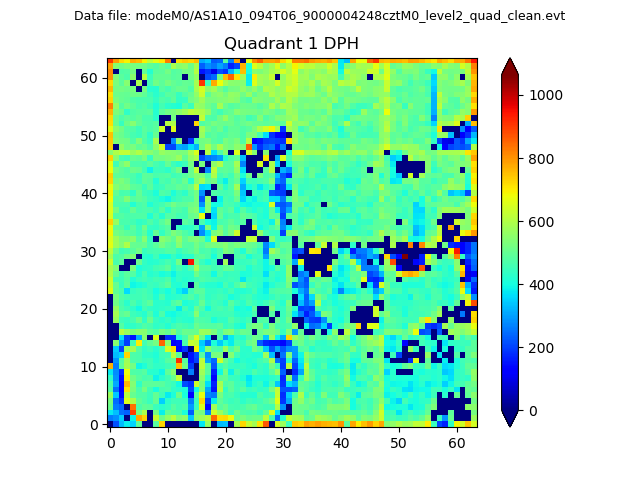 |
Quadrant B |
|---|---|---|---|
| Quadrant D |  |
 |
Quadrant C |
| Plot type | Count rate plots | Images |
|---|---|---|
| Comparison with Poisson distribution Blue bars denote a histogram of data divided into 1 sec bins. Red curve is a Poisson curve with rate = median count rate of data. |
 |
 |
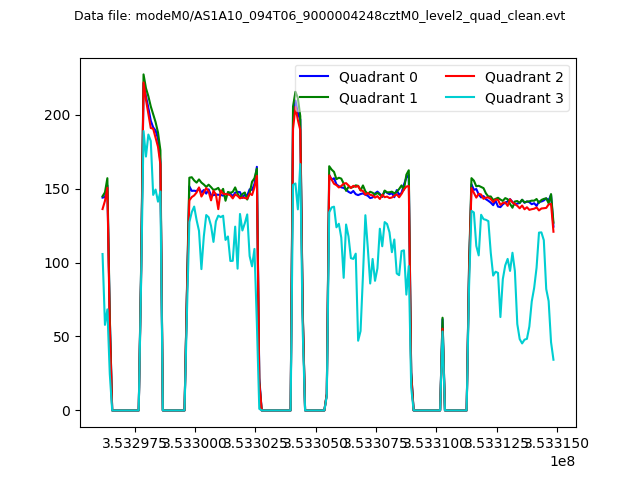
| Quadrant-wise count rates Data is divided into 100 sec bins |
 |
|
| Module-wise count rates for Quadrant A Data is divided into 100 sec bins |
 |
 |
| Module-wise count rates for Quadrant B Data is divided into 100 sec bins |
 |
 |
| Module-wise count rates for Quadrant C Data is divided into 100 sec bins |
 |
 |
| Module-wise count rates for Quadrant D Data is divided into 100 sec bins |
 |
 |
| Parameter | Plot |
|---|---|
| CZT HV Monitor | 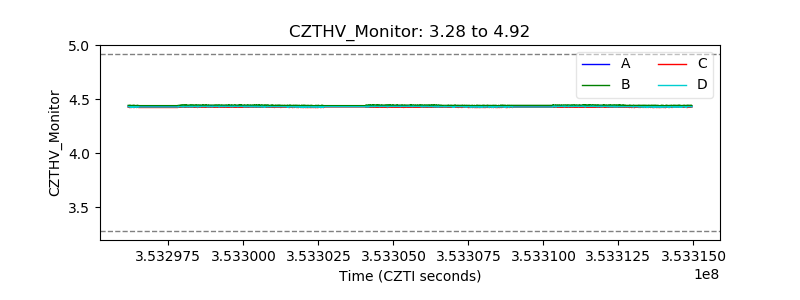 |
| D_VDD | 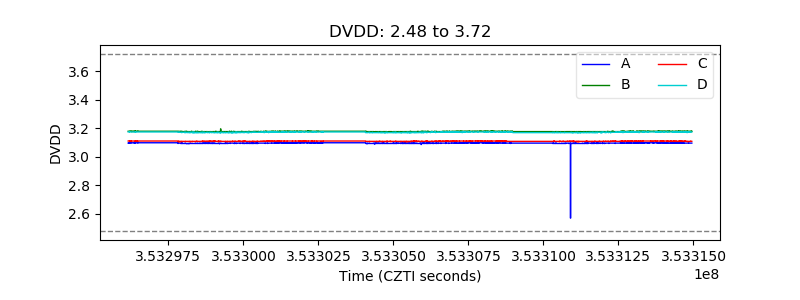 |
| Temperature 1 |  |
| Veto HV Monitor |  |
| Veto LLD | 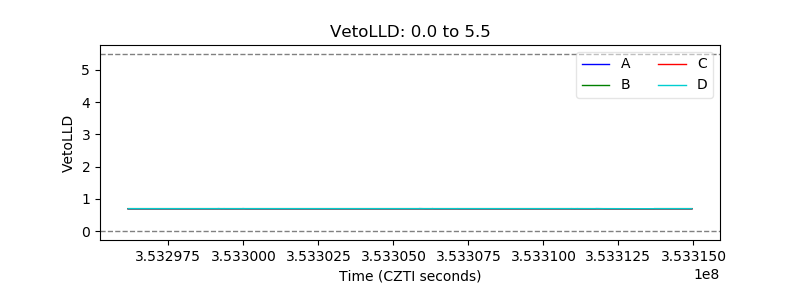 |
| Alpha Counter |  |
| _CPM_Rate |  |
| CZT Counter | 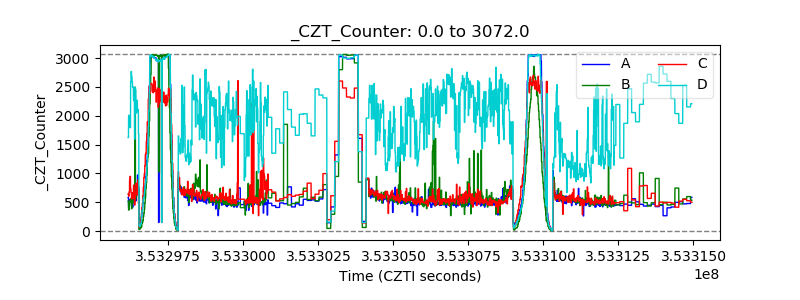 |
| +2.5 Volts monitor |  |
| +5 Volts monitor |  |
| _ROLL_ROT | 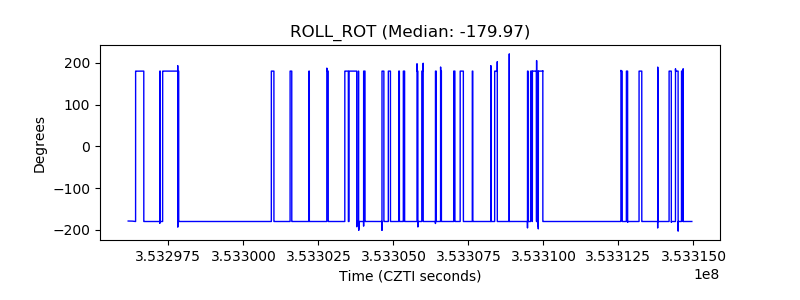 |
| _Roll_DEC |  |
| _Roll_RA |  |
| Veto Counter |  |