| Param | Original file | Final file |
|---|---|---|
| Filename | modeM0/AS1A10_094T06_9000004248_29499cztM0_level2.evt | modeM0/AS1A10_094T06_9000004248_29499cztM0_level2_quad_clean.evt |
| Size (bytes) | 240,776,640 | 31,642,560 |
| Size | 229.6 MB | 30.2 MB |
| Events in quadrant A | 1,084,115 | 217,294 |
| Events in quadrant B | 1,191,789 | 224,542 |
| Events in quadrant C | 1,233,158 | 211,943 |
| Events in quadrant D | 3,653,842 | 166,723 |
| Mode M0 | |||
|---|---|---|---|
| Quadrant | BADHDUFLAG | Total packets | Discarded packets |
| A | 0 | 4399 | 1 |
| B | 0 | 4833 | 1 |
| C | 0 | 5087 | 1 |
| D | 0 | 12132 | 1 |
| Mode M9 | |||
|---|---|---|---|
| Quadrant | BADHDUFLAG | Total packets | Discarded packets |
| A | 0 | 13 | 0 |
| B | 0 | 13 | 0 |
| C | 0 | 13 | 0 |
| D | 0 | 13 | 0 |
| Mode SS | |||
|---|---|---|---|
| Quadrant | BADHDUFLAG | Total packets | Discarded packets |
| A | 0 | 40 | 0 |
| B | 0 | 40 | 0 |
| C | 0 | 40 | 0 |
| D | 0 | 40 | 0 |
| Quadrant | Total seconds | Saturated seconds | Saturation percentage |
|---|---|---|---|
| A | 1876 | 37 | 1.972281% |
| B | 1876 | 54 | 2.878465% |
| C | 1876 | 109 | 5.810235% |
| D | 1876 | 844 | 44.989339% |
Noise dominated data is calculated using 1-second bins in cleaned event files. If a bin has >2000 counts, and if more than 50% of those come from <1% of pixels, then it is considered to be noise-dominated and hence unusable.
| Quadrant | # 1 sec bins | Bins with >0 counts | Bins with >2000 counts | High rate bins dominated by noise | Noise dominated (total time) | Noise dominated (detector-on time) | Marked lightcurve |
|---|---|---|---|---|---|---|---|
| A | 3191 | 1877 | 0 | 0 | 0.00% | 0.00% | 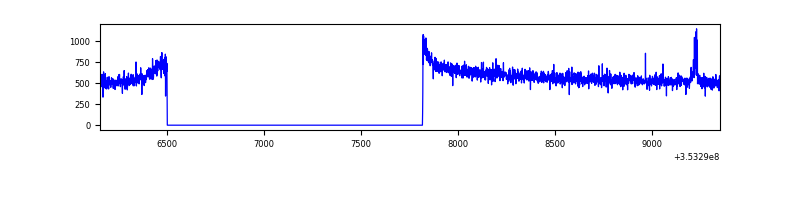 |
| B | 3191 | 1877 | 1 | 1 | 0.03% | 0.05% | 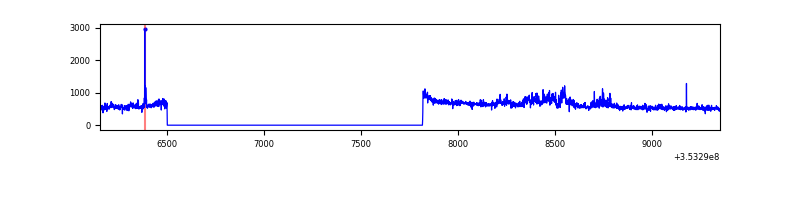 |
| C | 3191 | 1876 | 0 | 0 | 0.00% | 0.00% | 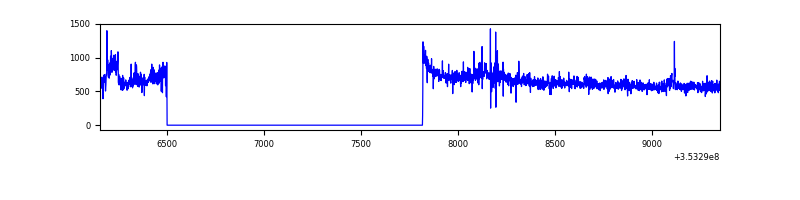 |
| D | 3191 | 1877 | 881 | 881 | 27.61% | 46.94% | 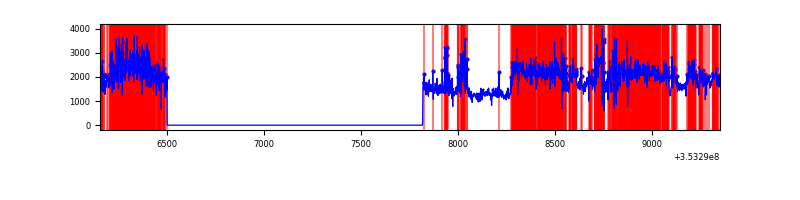 |
Top three noisy pixels from each quadrant. If the there are fewer than three noisy pixels in the level2.evt file, extra rows are filled as -1
| Pixel properties | Quadrant properties | ||||||
|---|---|---|---|---|---|---|---|
| Quadrant | DetID | PixID | Counts | Sigma | Mean | Median | Sigma |
| A | 0 | 13 | 8073 | 138.37 | 278 | 274 | 56.4 |
| A | 13 | 254 | 3721 | 61.16 | 278 | 274 | 56.4 |
| A | 0 | 226 | 2324 | 36.37 | 278 | 274 | 56.4 |
| B | 5 | 255 | 76680 | 1448.82 | 281 | 276 | 52.7 |
| B | 0 | 190 | 9493 | 174.78 | 281 | 276 | 52.7 |
| B | 12 | 111 | 5586 | 100.69 | 281 | 276 | 52.7 |
| C | 3 | 233 | 67643 | 1058.23 | 274 | 276 | 63.7 |
| C | 14 | 238 | 64392 | 1007.16 | 274 | 276 | 63.7 |
| C | 14 | 254 | 25641 | 398.45 | 274 | 276 | 63.7 |
| D | 8 | 195 | 2114065 | 37548.43 | 234 | 228 | 56.3 |
| D | 7 | 238 | 291863 | 5180.36 | 234 | 228 | 56.3 |
| D | 13 | 153 | 134879 | 2391.83 | 234 | 228 | 56.3 |
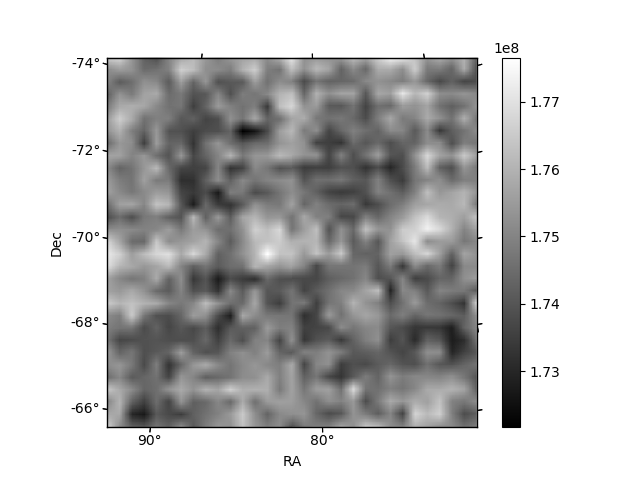
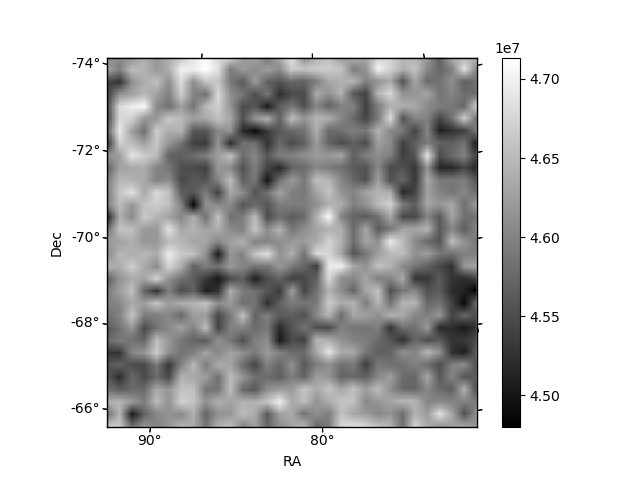
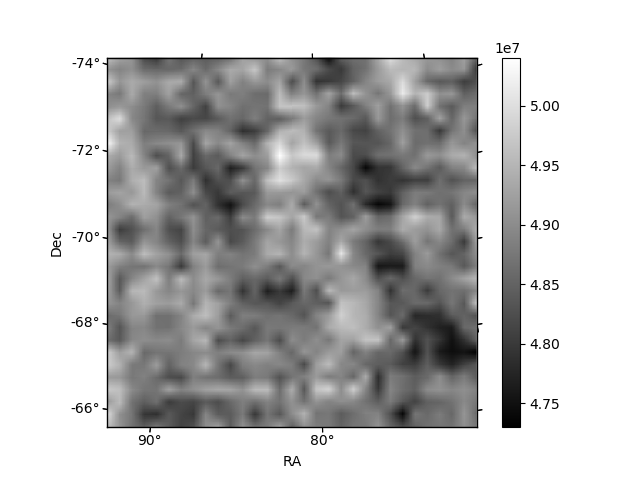
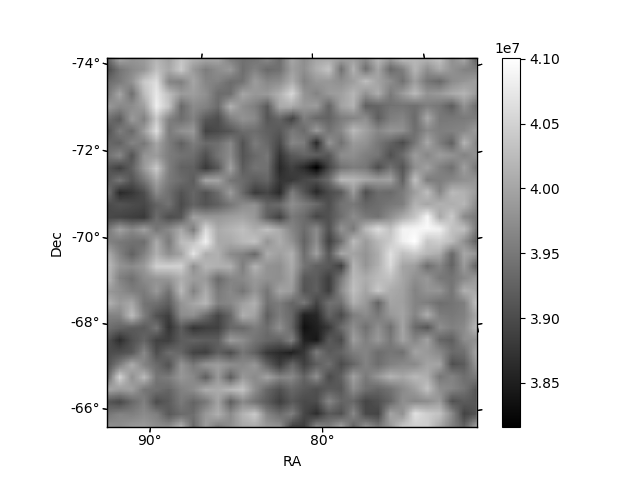
Histogram calculated using DETX and DETY for each event in the final _common_clean file
| Quadrant A | 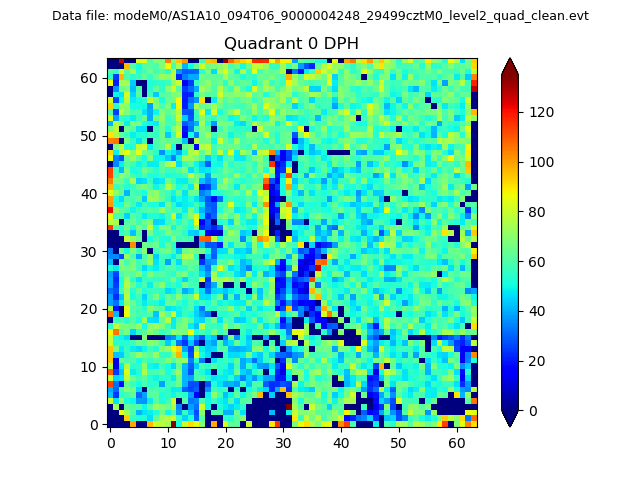 |
 |
Quadrant B |
|---|---|---|---|
| Quadrant D | 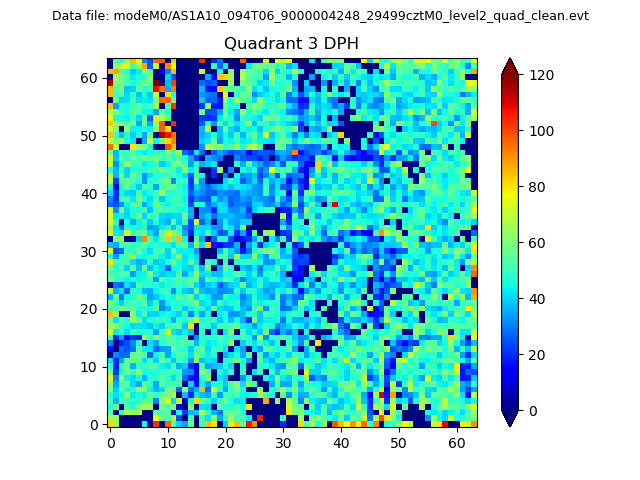 |
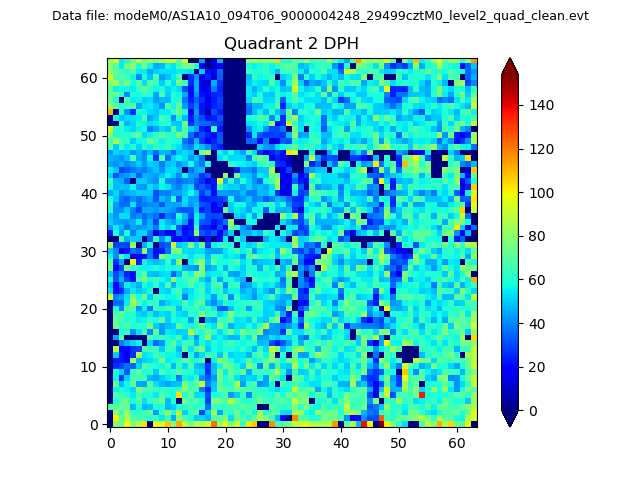 |
Quadrant C |
| Plot type | Count rate plots | Images |
|---|---|---|
| Comparison with Poisson distribution Blue bars denote a histogram of data divided into 1 sec bins. Red curve is a Poisson curve with rate = median count rate of data. |
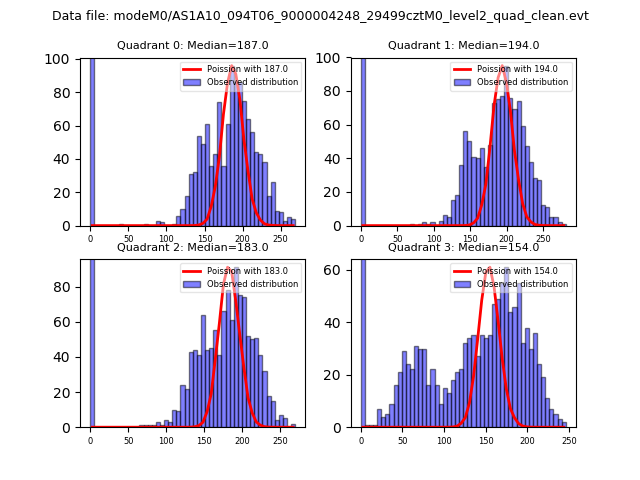 |
 |
| Quadrant-wise count rates Data is divided into 100 sec bins |
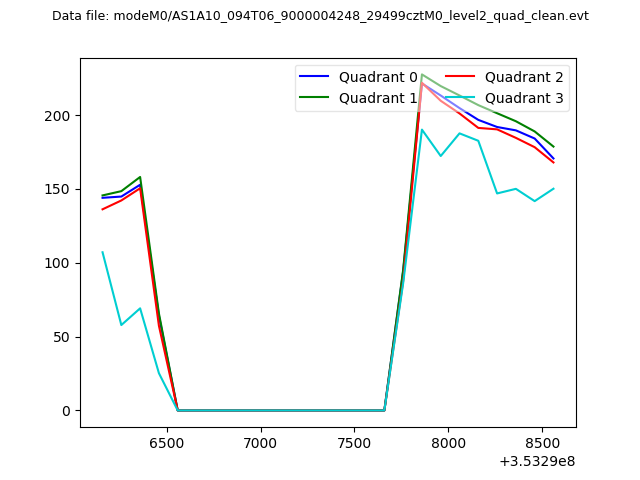 |
|
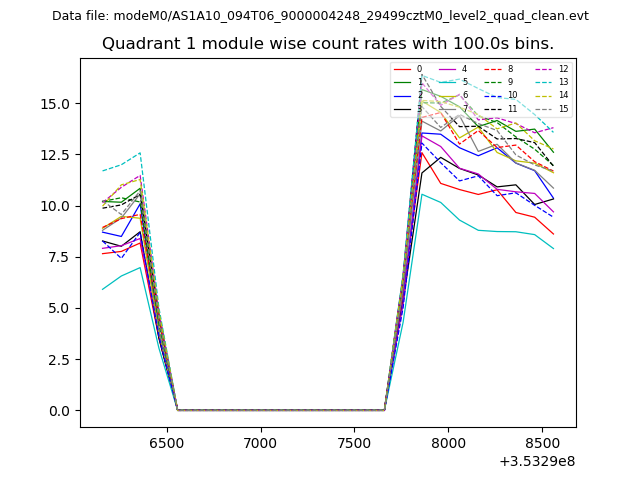
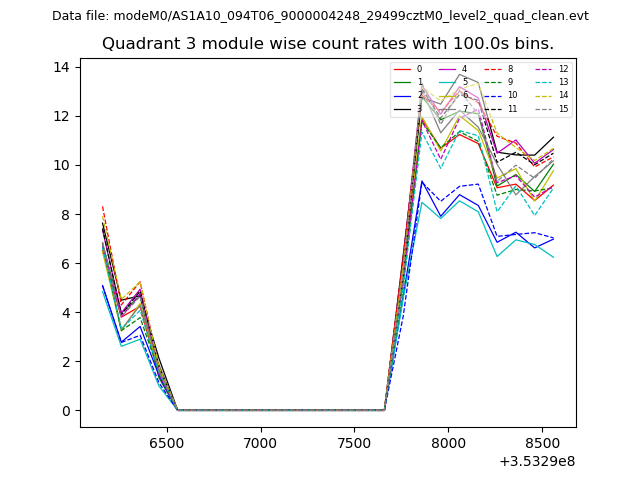
| Module-wise count rates for Quadrant A Data is divided into 100 sec bins |
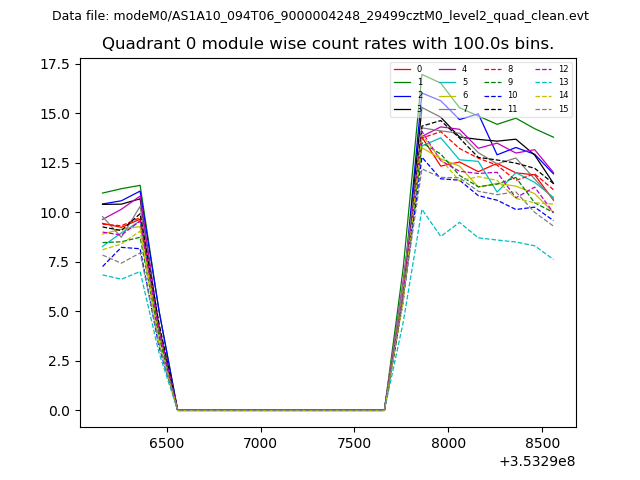 |
 |
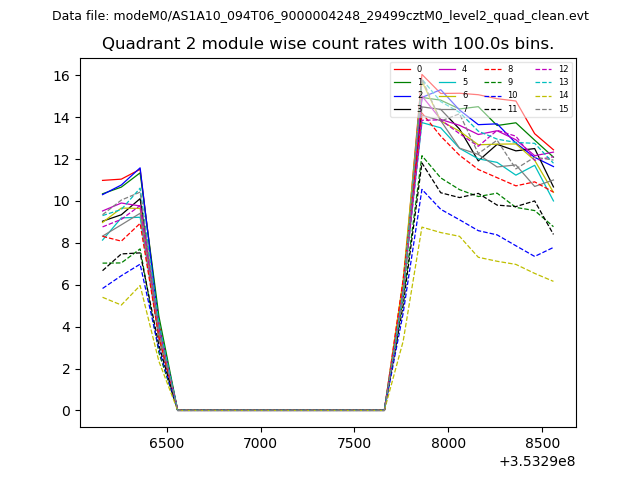
| Module-wise count rates for Quadrant B Data is divided into 100 sec bins |
 |
 |
| Module-wise count rates for Quadrant C Data is divided into 100 sec bins |
 |
 |
| Module-wise count rates for Quadrant D Data is divided into 100 sec bins |
 |
 |
| Parameter | Plot |
|---|---|
| CZT HV Monitor |  |
| D_VDD | 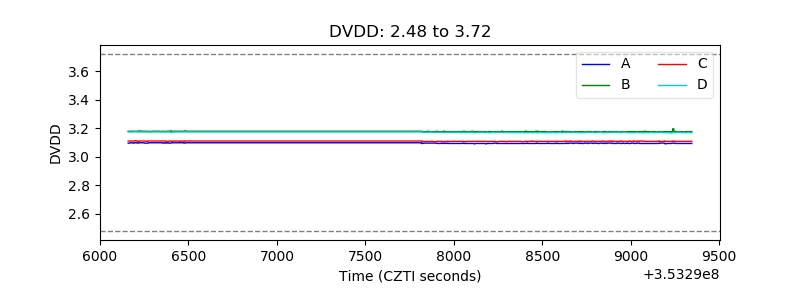 |
| Temperature 1 | 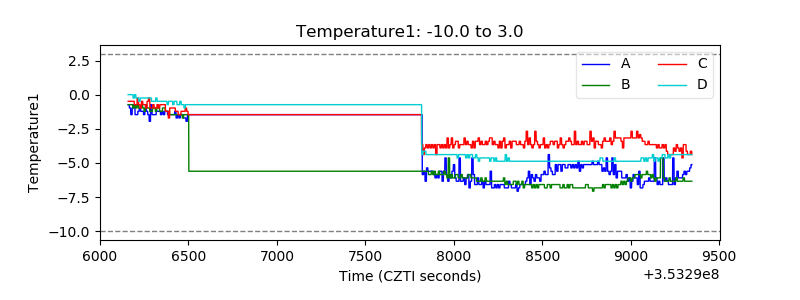 |
| Veto HV Monitor | 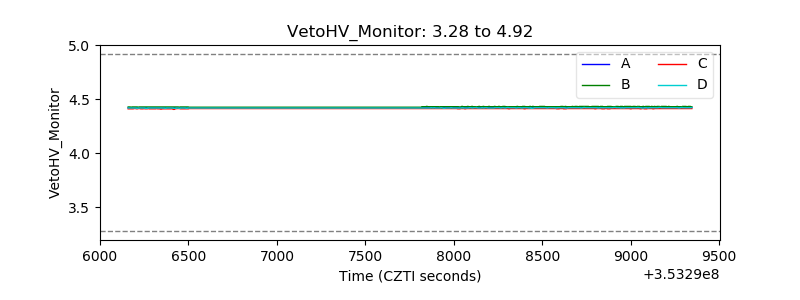 |
| Veto LLD | 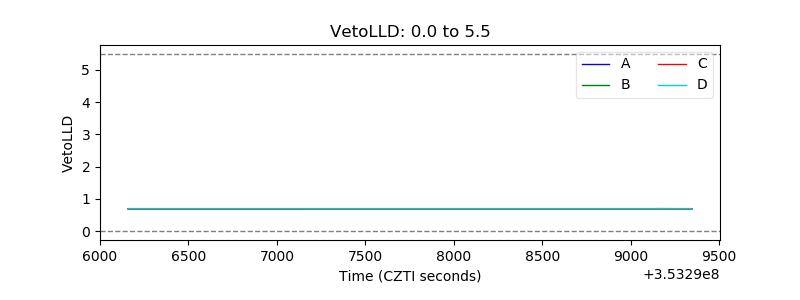 |
| Alpha Counter | 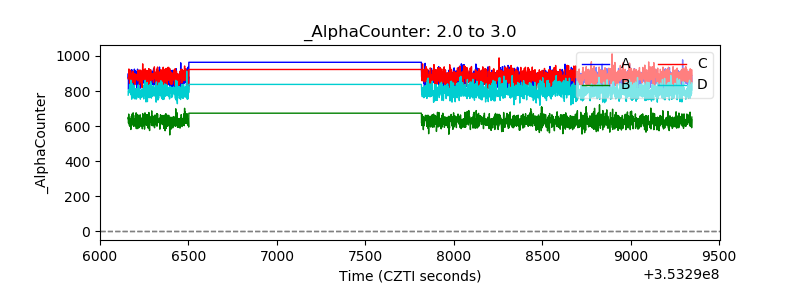 |
| _CPM_Rate | 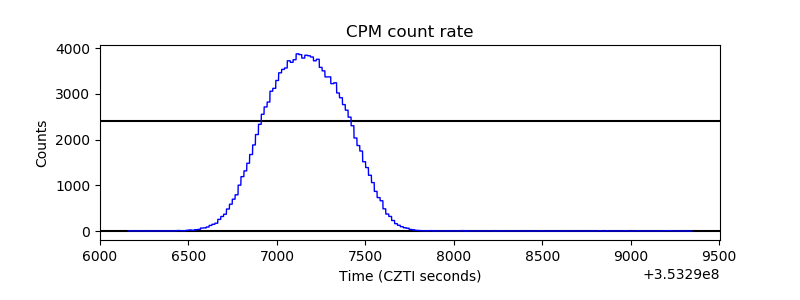 |
| CZT Counter | 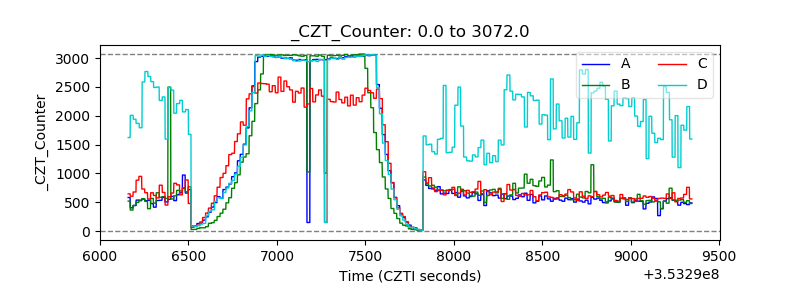 |
| +2.5 Volts monitor |  |
| +5 Volts monitor | 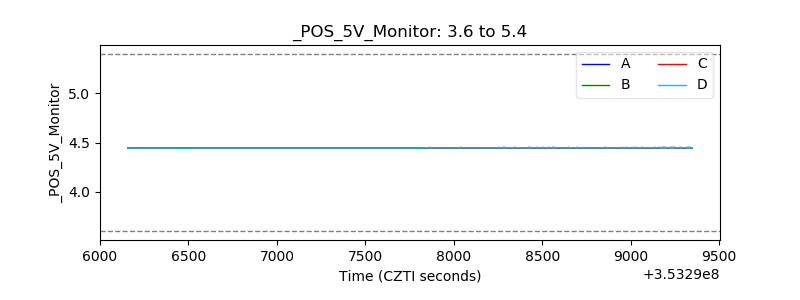 |
| _ROLL_ROT | 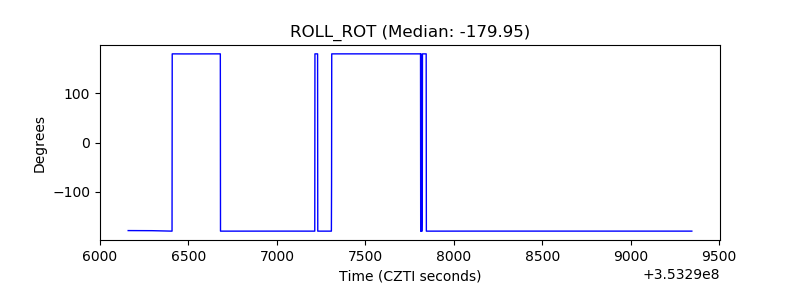 |
| _Roll_DEC | 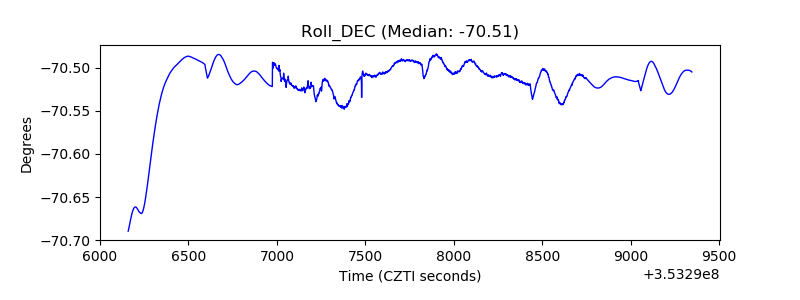 |
| _Roll_RA | 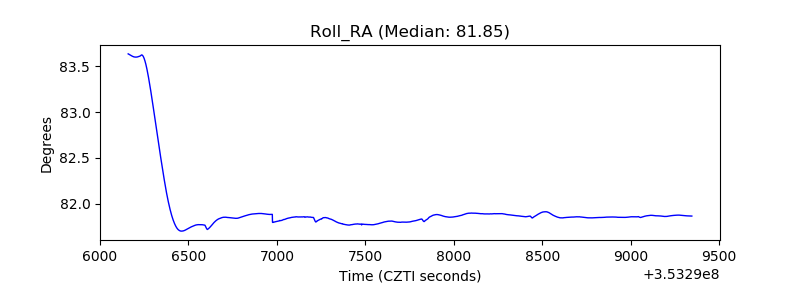 |
| Veto Counter | 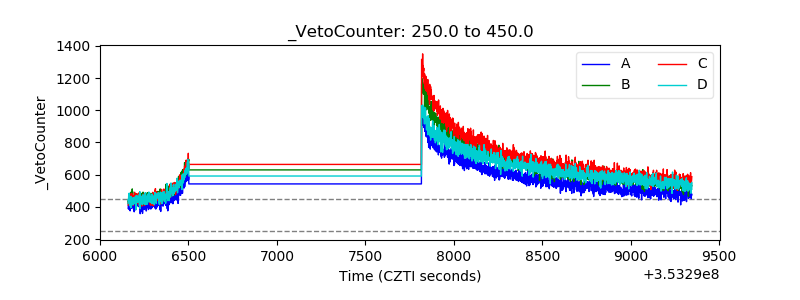 |