| Param | Original file | Final file |
|---|---|---|
| Filename | modeM0/AS1A10_094T06_9000004248_29500cztM0_level2.evt | modeM0/AS1A10_094T06_9000004248_29500cztM0_level2_quad_clean.evt |
| Size (bytes) | 758,992,320 | 96,471,360 |
| Size | 723.8 MB | 92.0 MB |
| Events in quadrant A | 3,297,772 | 653,341 |
| Events in quadrant B | 3,667,629 | 671,502 |
| Events in quadrant C | 3,968,968 | 643,647 |
| Events in quadrant D | 11,635,806 | 521,199 |
| Mode M0 | |||
|---|---|---|---|
| Quadrant | BADHDUFLAG | Total packets | Discarded packets |
| A | 0 | 13329 | 1 |
| B | 0 | 14687 | 1 |
| C | 0 | 16071 | 2 |
| D | 0 | 38792 | 1 |
| Mode M9 | |||
|---|---|---|---|
| Quadrant | BADHDUFLAG | Total packets | Discarded packets |
| A | 0 | 13 | 0 |
| B | 0 | 13 | 0 |
| C | 0 | 13 | 0 |
| D | 0 | 13 | 0 |
| Mode SS | |||
|---|---|---|---|
| Quadrant | BADHDUFLAG | Total packets | Discarded packets |
| A | 0 | 124 | 0 |
| B | 0 | 124 | 0 |
| C | 0 | 124 | 0 |
| D | 0 | 124 | 0 |
| Quadrant | Total seconds | Saturated seconds | Saturation percentage |
|---|---|---|---|
| A | 6172 | 27 | 0.437459% |
| B | 6173 | 83 | 1.344565% |
| C | 6172 | 206 | 3.337654% |
| D | 6172 | 2403 | 38.933895% |
Noise dominated data is calculated using 1-second bins in cleaned event files. If a bin has >2000 counts, and if more than 50% of those come from <1% of pixels, then it is considered to be noise-dominated and hence unusable.
| Quadrant | # 1 sec bins | Bins with >0 counts | Bins with >2000 counts | High rate bins dominated by noise | Noise dominated (total time) | Noise dominated (detector-on time) | Marked lightcurve |
|---|---|---|---|---|---|---|---|
| A | 7567 | 6173 | 0 | 0 | 0.00% | 0.00% | 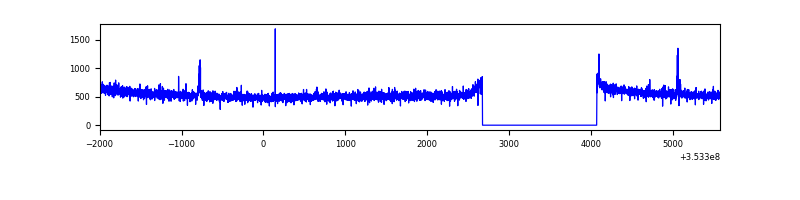 |
| B | 7568 | 6174 | 19 | 19 | 0.25% | 0.31% | 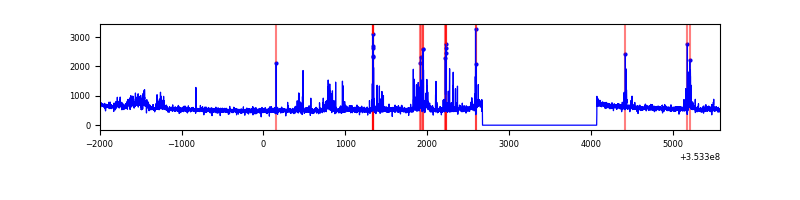 |
| C | 7567 | 6173 | 22 | 22 | 0.29% | 0.36% | 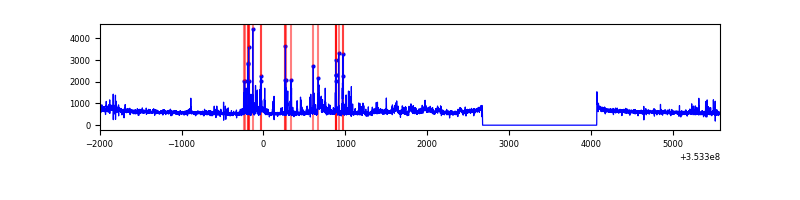 |
| D | 7567 | 6172 | 2604 | 2604 | 34.41% | 42.19% | 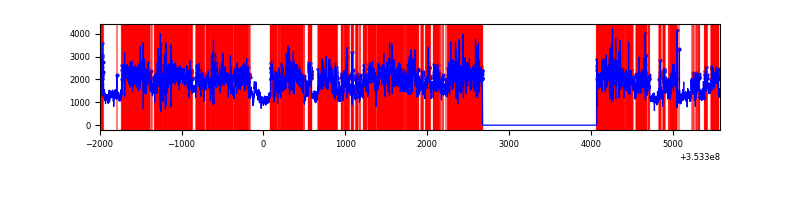 |
Top three noisy pixels from each quadrant. If the there are fewer than three noisy pixels in the level2.evt file, extra rows are filled as -1
| Pixel properties | Quadrant properties | ||||||
|---|---|---|---|---|---|---|---|
| Quadrant | DetID | PixID | Counts | Sigma | Mean | Median | Sigma |
| A | 13 | 254 | 12050 | 66.94 | 849 | 837 | 167.5 |
| A | 0 | 13 | 9263 | 50.3 | 849 | 837 | 167.5 |
| A | 12 | 96 | 8361 | 44.92 | 849 | 837 | 167.5 |
| B | 5 | 255 | 147819 | 958.04 | 850 | 831 | 153.4 |
| B | 0 | 190 | 117124 | 757.97 | 850 | 831 | 153.4 |
| B | 5 | 172 | 22668 | 142.33 | 850 | 831 | 153.4 |
| C | 7 | 247 | 272591 | 1448.0 | 829 | 836 | 187.7 |
| C | 3 | 233 | 231038 | 1226.59 | 829 | 836 | 187.7 |
| C | 14 | 238 | 173296 | 918.92 | 829 | 836 | 187.7 |
| D | 8 | 195 | 7330911 | 41820.1 | 753 | 737 | 175.3 |
| D | 7 | 238 | 429813 | 2447.96 | 753 | 737 | 175.3 |
| D | 12 | 33 | 421241 | 2399.06 | 753 | 737 | 175.3 |
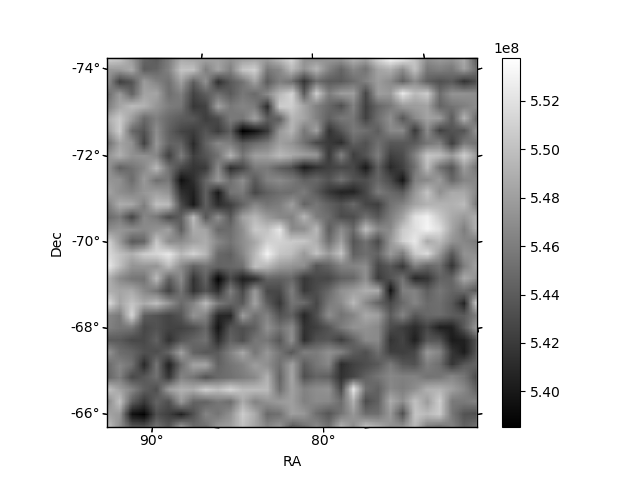
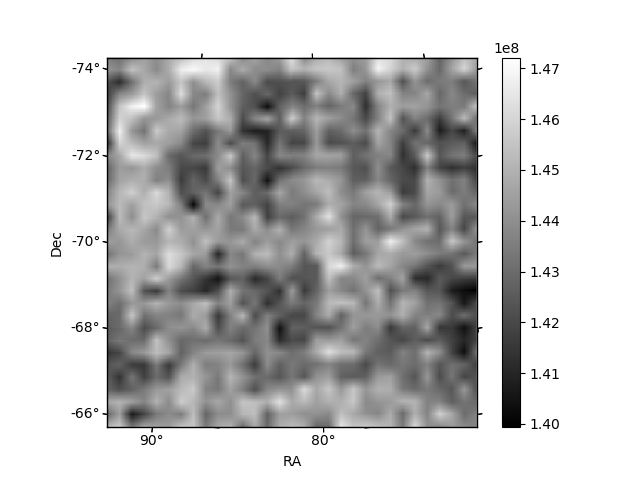
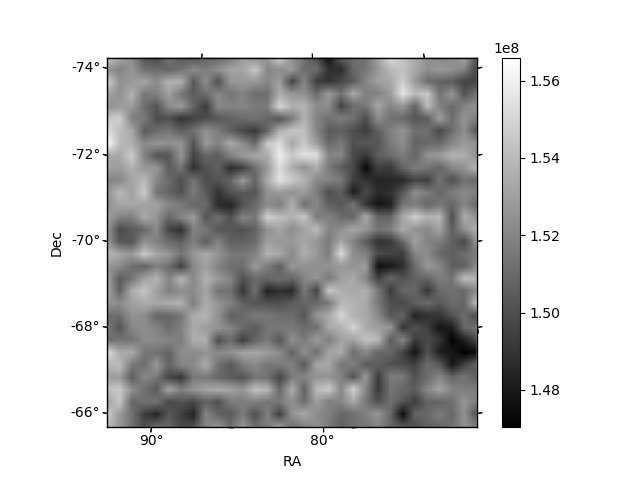
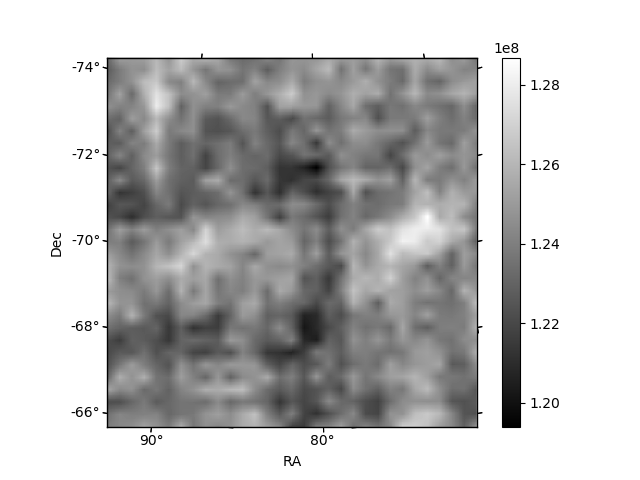
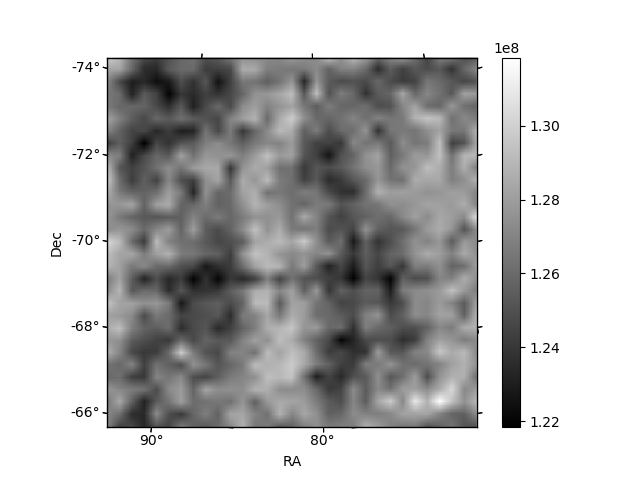
Histogram calculated using DETX and DETY for each event in the final _common_clean file
| Quadrant A |  |
 |
Quadrant B |
|---|---|---|---|
| Quadrant D |  |
 |
Quadrant C |
| Plot type | Count rate plots | Images |
|---|---|---|
| Comparison with Poisson distribution Blue bars denote a histogram of data divided into 1 sec bins. Red curve is a Poisson curve with rate = median count rate of data. |
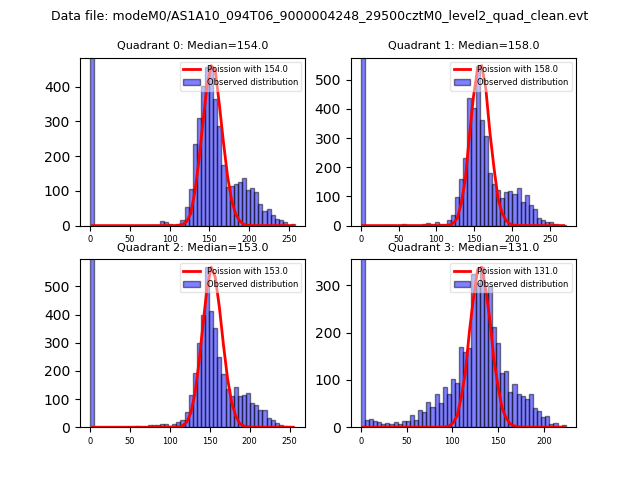 |
 |
| Quadrant-wise count rates Data is divided into 100 sec bins |
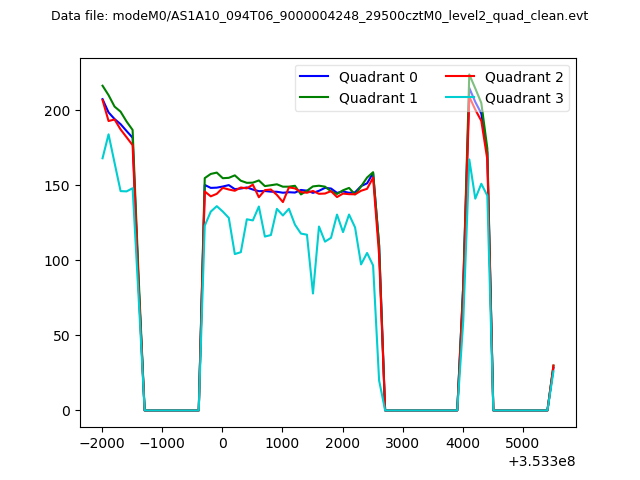 |
|
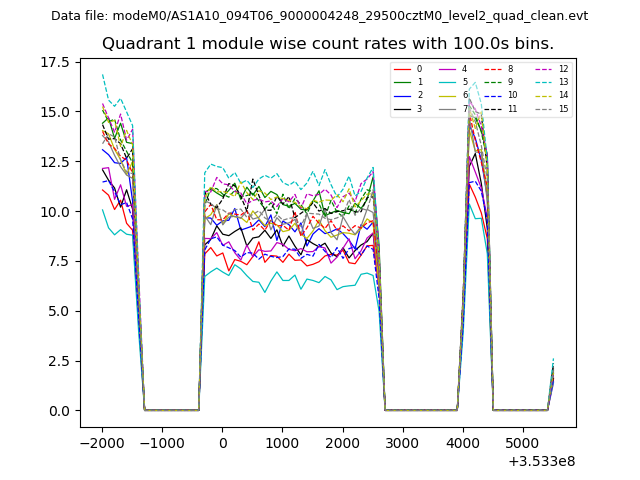
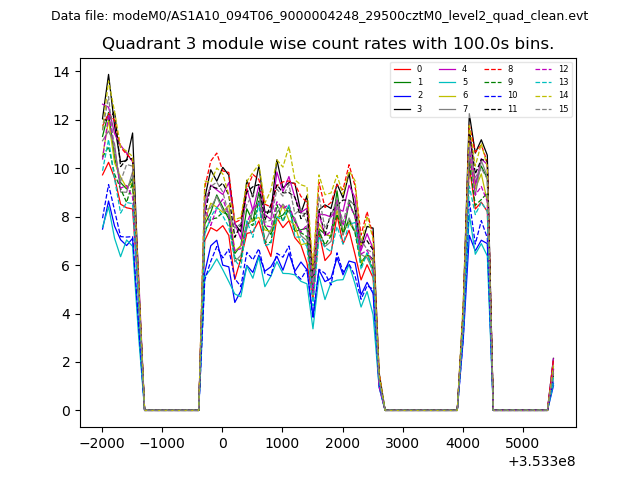
| Module-wise count rates for Quadrant A Data is divided into 100 sec bins |
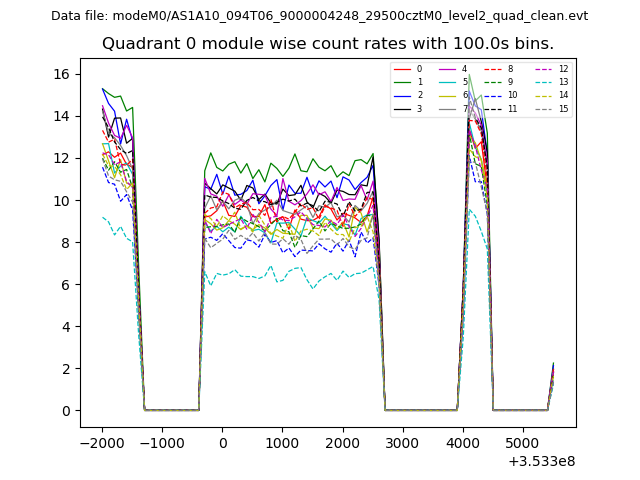 |
 |
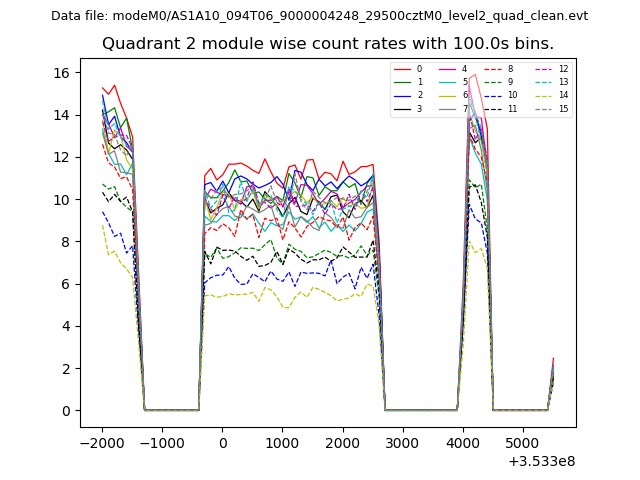
| Module-wise count rates for Quadrant B Data is divided into 100 sec bins |
 |
 |
| Module-wise count rates for Quadrant C Data is divided into 100 sec bins |
 |
 |
| Module-wise count rates for Quadrant D Data is divided into 100 sec bins |
 |
 |
| Parameter | Plot |
|---|---|
| CZT HV Monitor |  |
| D_VDD | 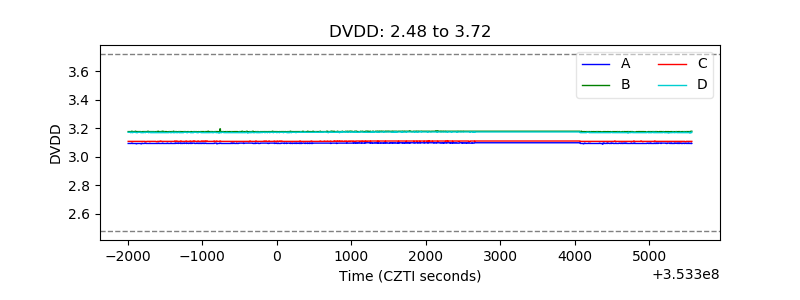 |
| Temperature 1 | 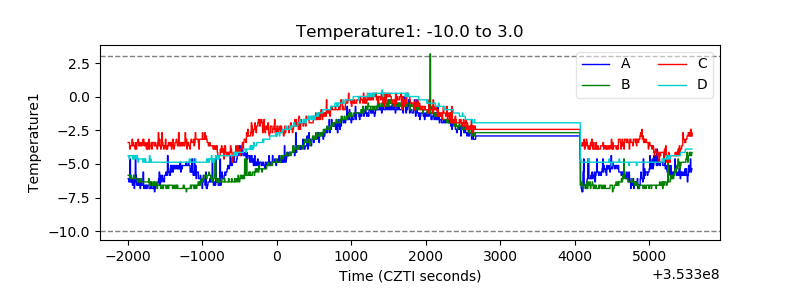 |
| Veto HV Monitor | 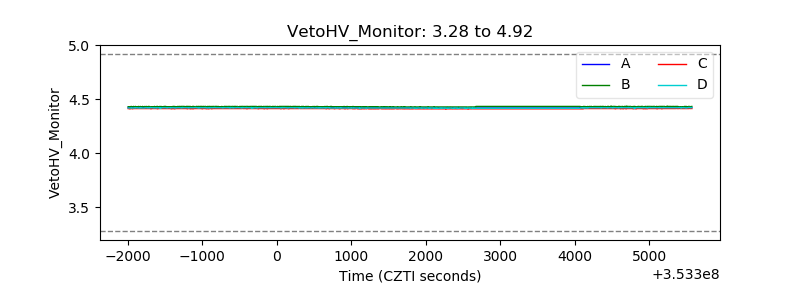 |
| Veto LLD | 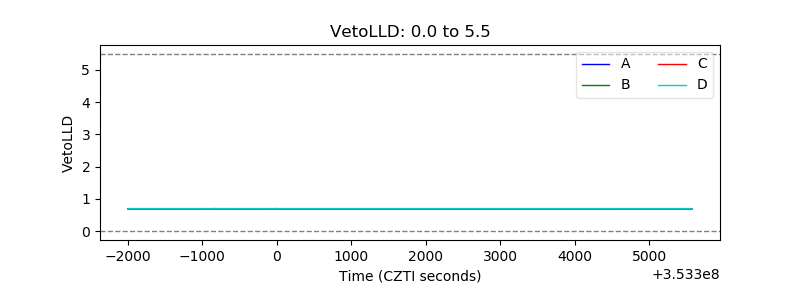 |
| Alpha Counter | 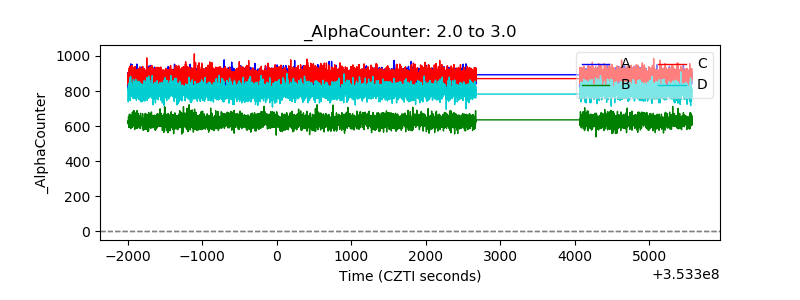 |
| _CPM_Rate | 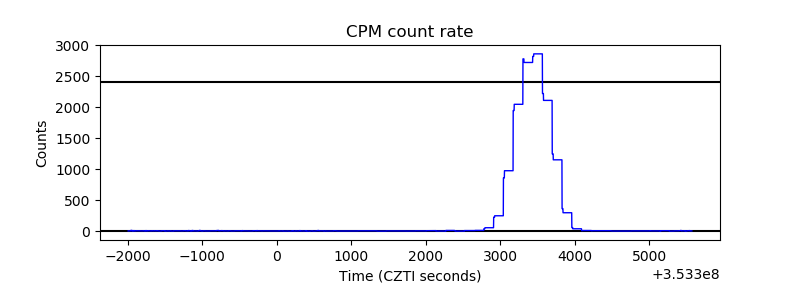 |
| CZT Counter | 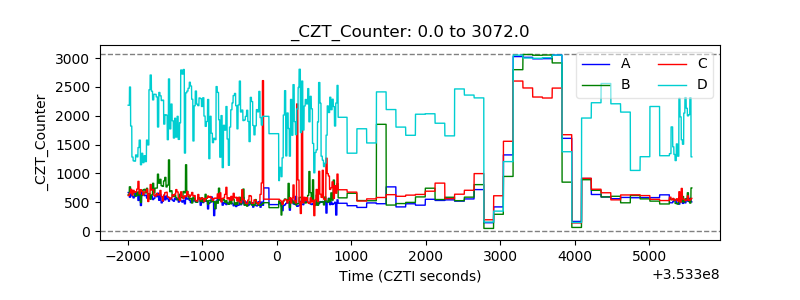 |
| +2.5 Volts monitor |  |
| +5 Volts monitor |  |
| _ROLL_ROT | 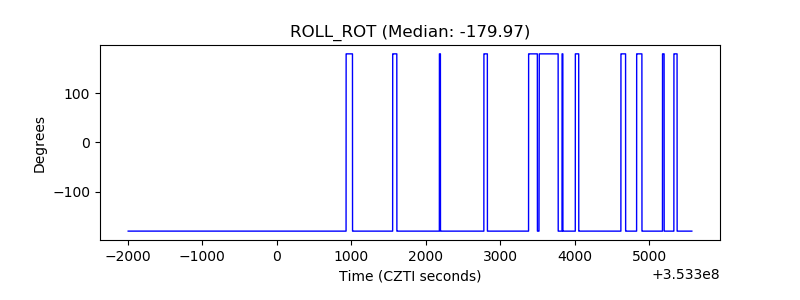 |
| _Roll_DEC | 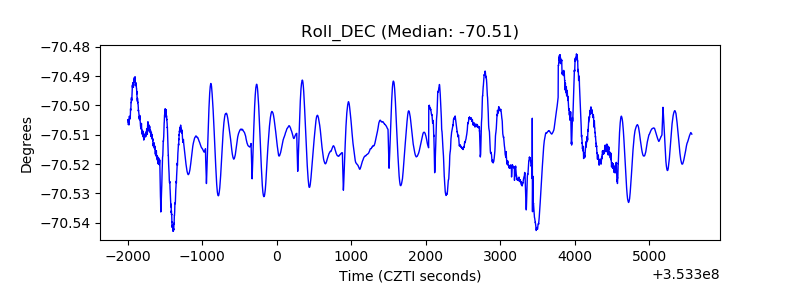 |
| _Roll_RA | 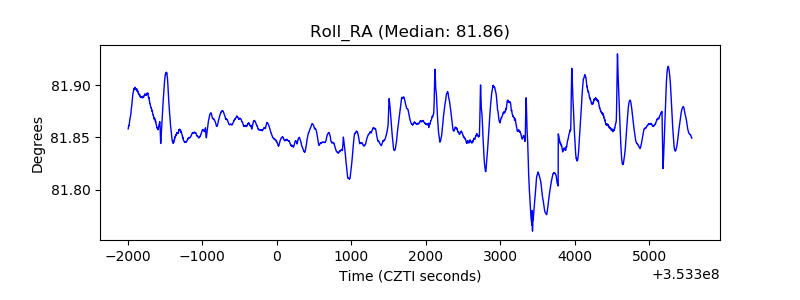 |
| Veto Counter | 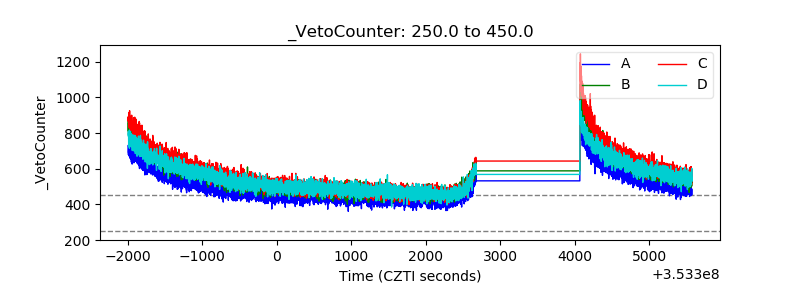 |