| Param | Original file | Final file |
|---|---|---|
| Filename | modeM0/AS1A10_094T06_9000004248_29501cztM0_level2.evt | modeM0/AS1A10_094T06_9000004248_29501cztM0_level2_quad_clean.evt |
| Size (bytes) | 658,543,680 | 81,596,160 |
| Size | 628.0 MB | 77.8 MB |
| Events in quadrant A | 2,895,248 | 555,199 |
| Events in quadrant B | 3,285,890 | 566,712 |
| Events in quadrant C | 3,083,856 | 552,957 |
| Events in quadrant D | 10,303,781 | 406,653 |
| Mode M0 | |||
|---|---|---|---|
| Quadrant | BADHDUFLAG | Total packets | Discarded packets |
| A | 0 | 11630 | 1 |
| B | 0 | 12941 | 1 |
| C | 0 | 12297 | 1 |
| D | 0 | 34461 | 4 |
| Mode M9 | |||
|---|---|---|---|
| Quadrant | BADHDUFLAG | Total packets | Discarded packets |
| A | 0 | 13 | 0 |
| B | 0 | 13 | 0 |
| C | 0 | 13 | 0 |
| D | 0 | 13 | 0 |
| Mode SS | |||
|---|---|---|---|
| Quadrant | BADHDUFLAG | Total packets | Discarded packets |
| A | 0 | 112 | 0 |
| B | 0 | 112 | 0 |
| C | 0 | 112 | 0 |
| D | 0 | 112 | 0 |
| Quadrant | Total seconds | Saturated seconds | Saturation percentage |
|---|---|---|---|
| A | 5555 | 62 | 1.116112% |
| B | 5555 | 121 | 2.178218% |
| C | 5556 | 143 | 2.573794% |
| D | 5555 | 2413 | 43.438344% |
Noise dominated data is calculated using 1-second bins in cleaned event files. If a bin has >2000 counts, and if more than 50% of those come from <1% of pixels, then it is considered to be noise-dominated and hence unusable.
| Quadrant | # 1 sec bins | Bins with >0 counts | Bins with >2000 counts | High rate bins dominated by noise | Noise dominated (total time) | Noise dominated (detector-on time) | Marked lightcurve |
|---|---|---|---|---|---|---|---|
| A | 6880 | 5556 | 5 | 5 | 0.07% | 0.09% | 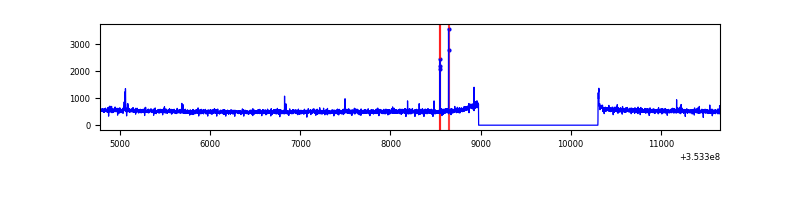 |
| B | 6880 | 5556 | 26 | 26 | 0.38% | 0.47% |  |
| C | 6881 | 5557 | 0 | 0 | 0.00% | 0.00% | 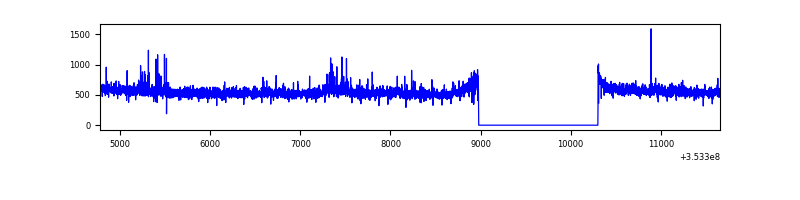 |
| D | 6880 | 5556 | 2341 | 2341 | 34.03% | 42.13% | 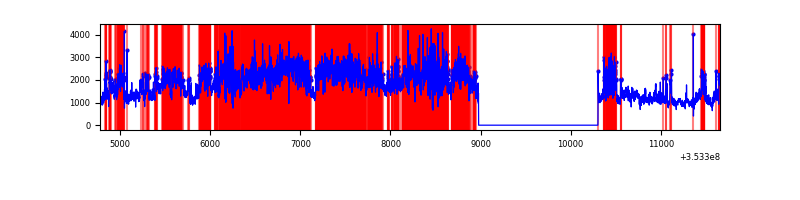 |
Top three noisy pixels from each quadrant. If the there are fewer than three noisy pixels in the level2.evt file, extra rows are filled as -1
| Pixel properties | Quadrant properties | ||||||
|---|---|---|---|---|---|---|---|
| Quadrant | DetID | PixID | Counts | Sigma | Mean | Median | Sigma |
| A | 12 | 96 | 24555 | 162.01 | 741 | 728 | 147.1 |
| A | 13 | 254 | 10824 | 68.65 | 741 | 728 | 147.1 |
| A | 3 | 137 | 6433 | 38.79 | 741 | 728 | 147.1 |
| B | 0 | 190 | 152740 | 1135.35 | 737 | 721 | 133.9 |
| B | 5 | 255 | 97695 | 724.25 | 737 | 721 | 133.9 |
| B | 15 | 33 | 90723 | 672.18 | 737 | 721 | 133.9 |
| C | 14 | 238 | 129481 | 784.88 | 721 | 727 | 164.0 |
| C | 3 | 233 | 98122 | 593.71 | 721 | 727 | 164.0 |
| C | 7 | 247 | 20309 | 119.37 | 721 | 727 | 164.0 |
| D | 8 | 195 | 6131522 | 41486.95 | 637 | 620 | 147.8 |
| D | 12 | 33 | 1327364 | 8977.89 | 637 | 620 | 147.8 |
| D | 7 | 238 | 147448 | 993.56 | 637 | 620 | 147.8 |
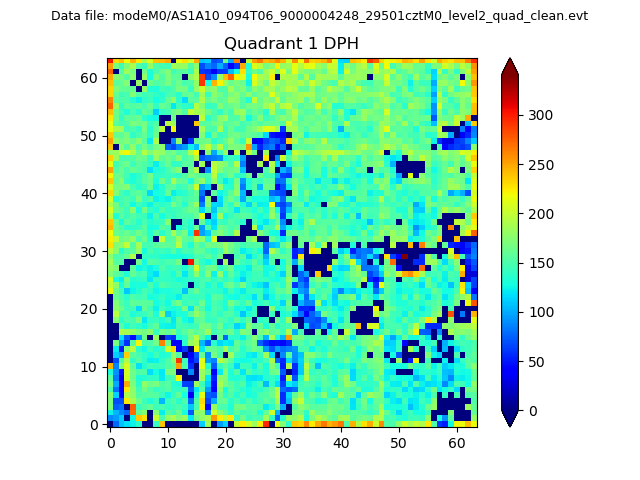
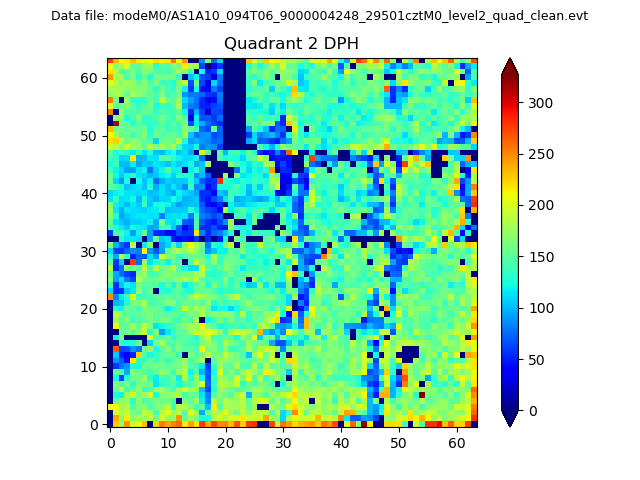
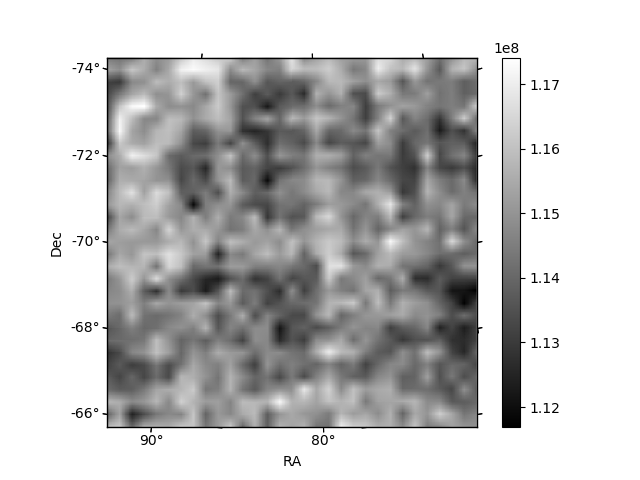
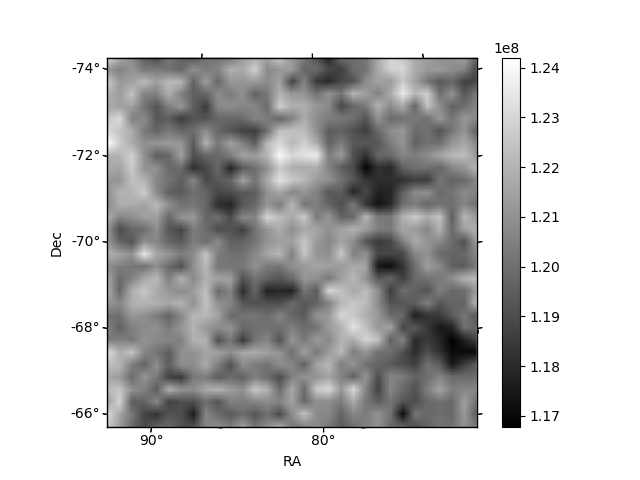
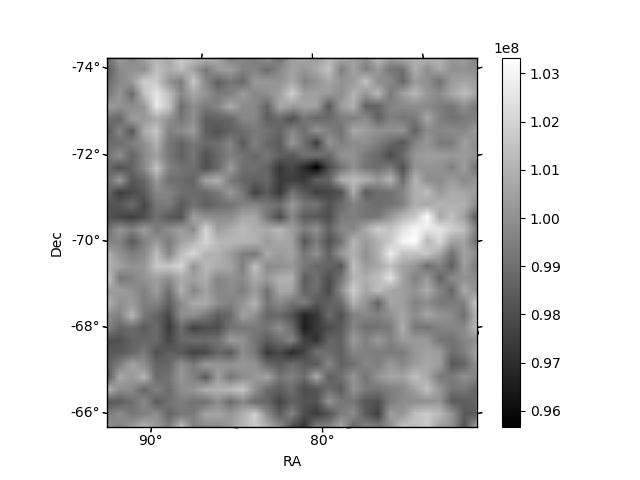
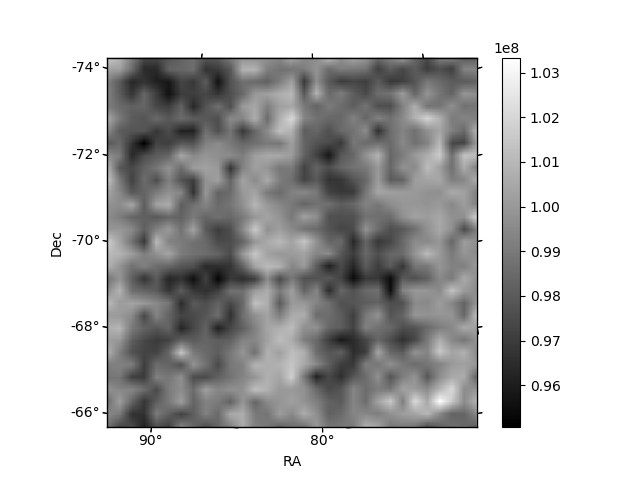
Histogram calculated using DETX and DETY for each event in the final _common_clean file
| Quadrant A | 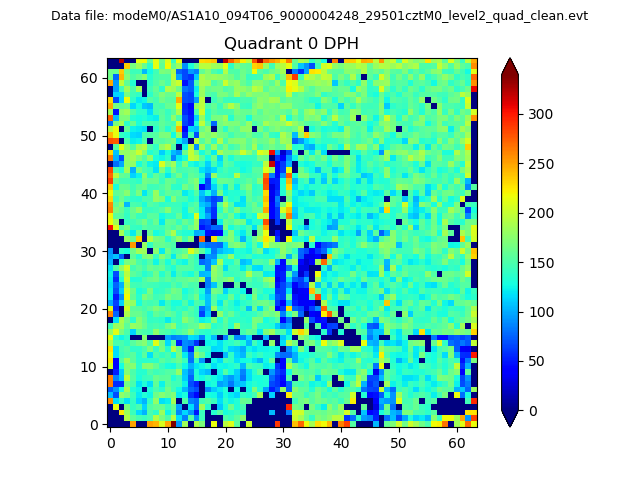 |
 |
Quadrant B |
|---|---|---|---|
| Quadrant D | 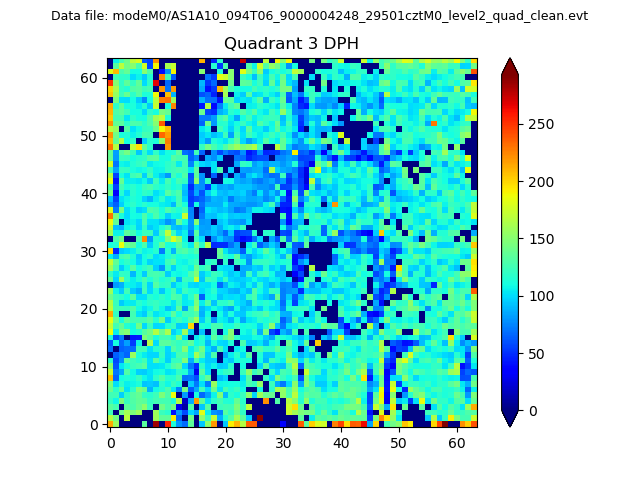 |
 |
Quadrant C |
| Plot type | Count rate plots | Images |
|---|---|---|
| Comparison with Poisson distribution Blue bars denote a histogram of data divided into 1 sec bins. Red curve is a Poisson curve with rate = median count rate of data. |
 |
 |
| Quadrant-wise count rates Data is divided into 100 sec bins |
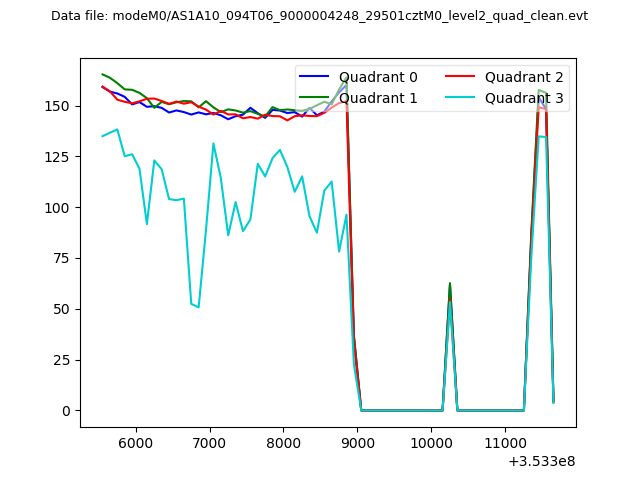 |
|
| Module-wise count rates for Quadrant A Data is divided into 100 sec bins |
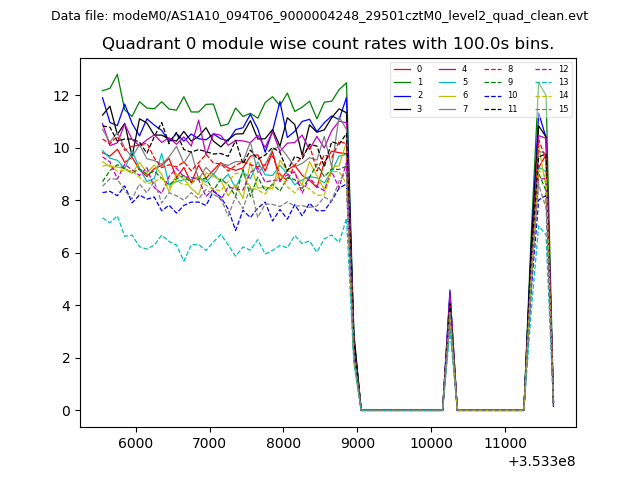 |
 |
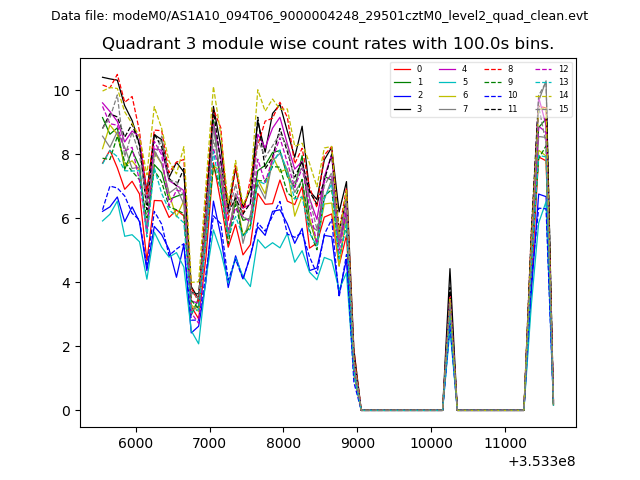
| Module-wise count rates for Quadrant B Data is divided into 100 sec bins |
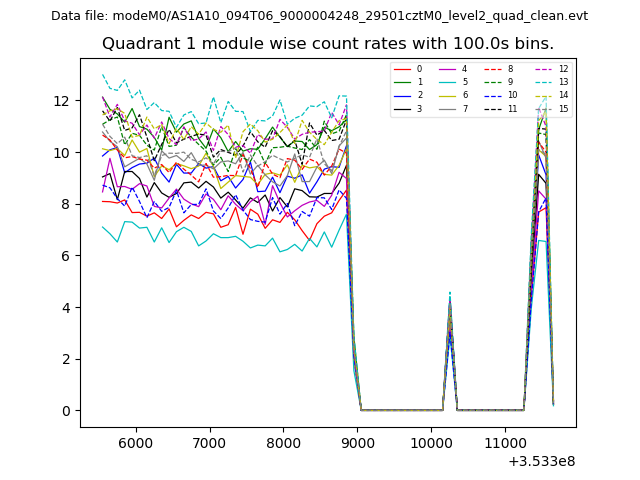 |
 |
| Module-wise count rates for Quadrant C Data is divided into 100 sec bins |
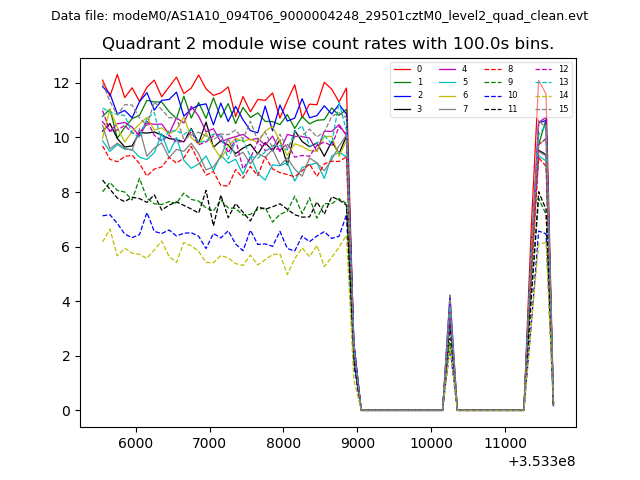 |
 |
| Module-wise count rates for Quadrant D Data is divided into 100 sec bins |
 |
 |
| Parameter | Plot |
|---|---|
| CZT HV Monitor | 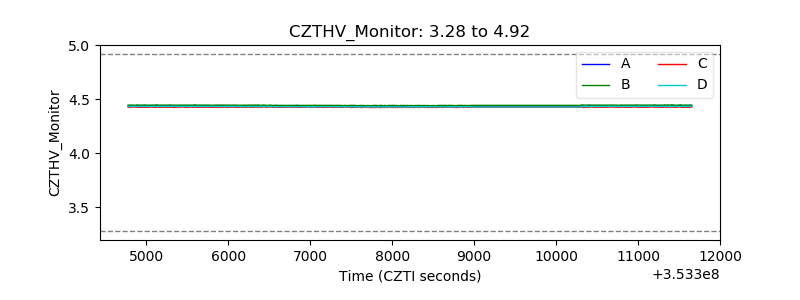 |
| D_VDD | 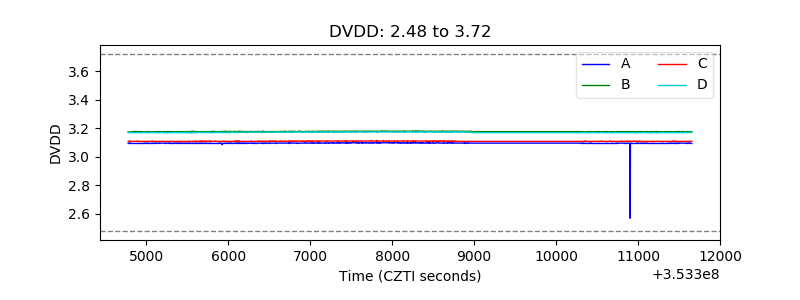 |
| Temperature 1 | 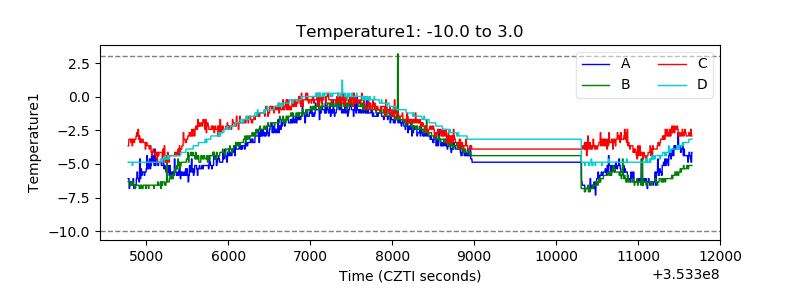 |
| Veto HV Monitor | 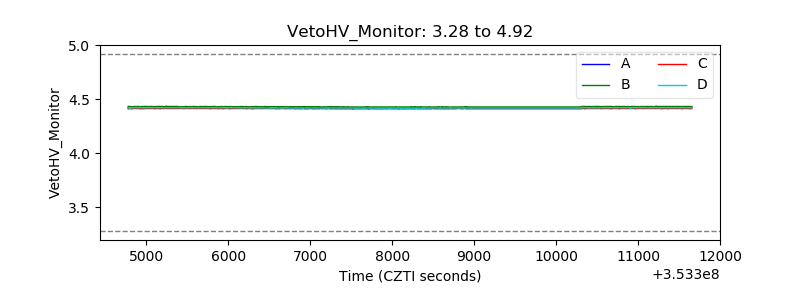 |
| Veto LLD | 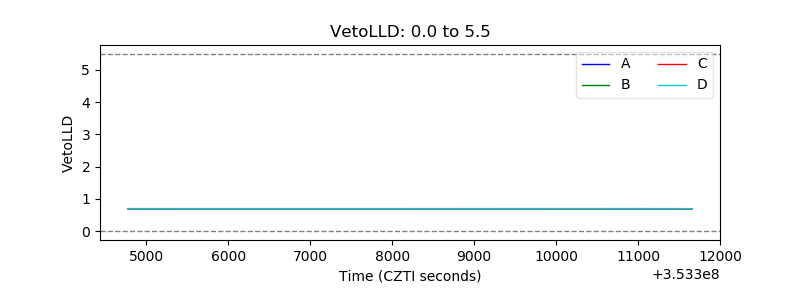 |
| Alpha Counter | 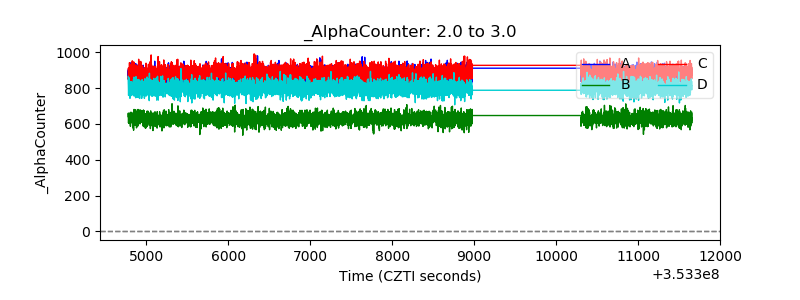 |
| _CPM_Rate | 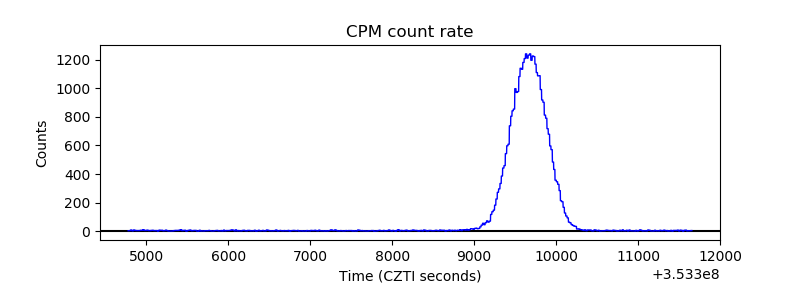 |
| CZT Counter | 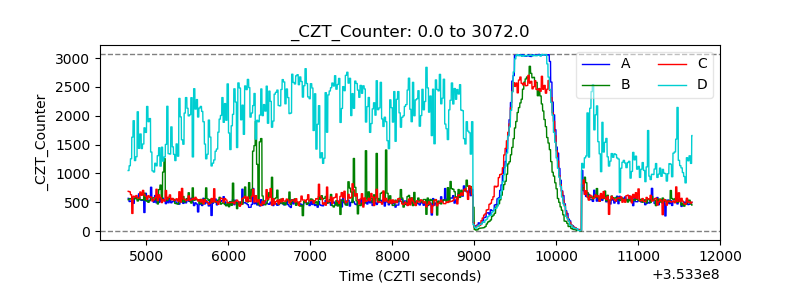 |
| +2.5 Volts monitor | 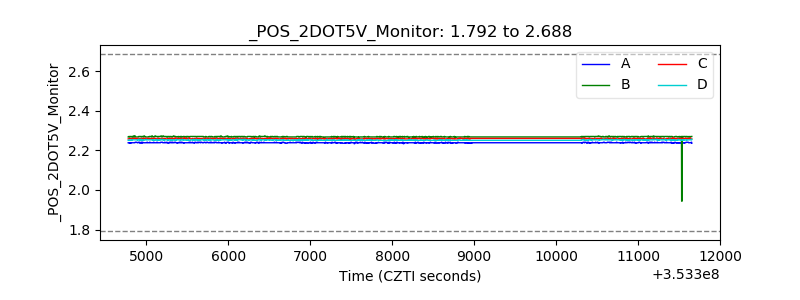 |
| +5 Volts monitor |  |
| _ROLL_ROT | 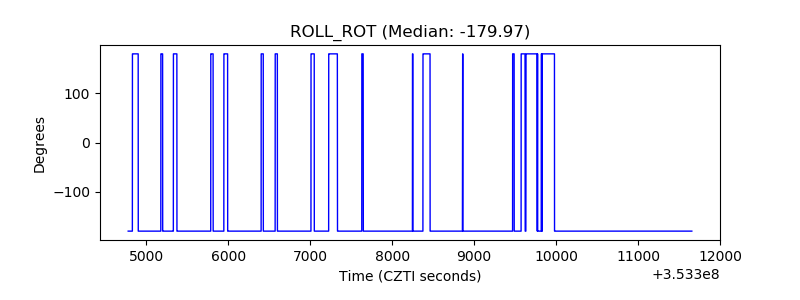 |
| _Roll_DEC |  |
| _Roll_RA | 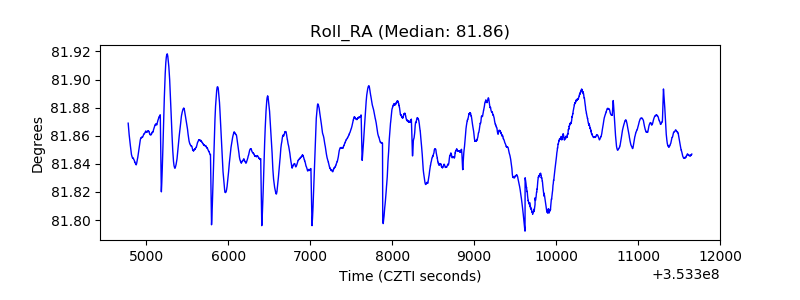 |
| Veto Counter | 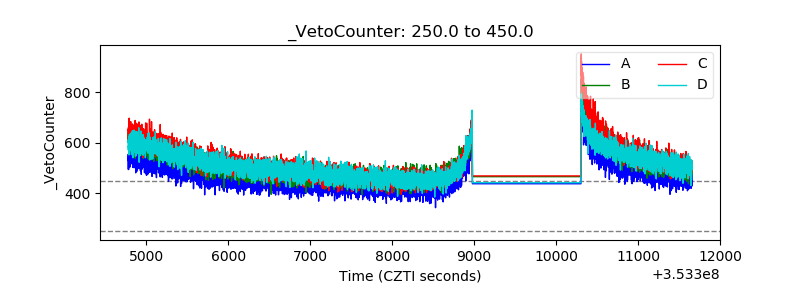 |