| Param | Original file | Final file |
|---|---|---|
| Filename | modeM0/AS1A10_094T06_9000004248_29502cztM0_level2.evt | modeM0/AS1A10_094T06_9000004248_29502cztM0_level2_quad_clean.evt |
| Size (bytes) | 505,808,640 | 70,827,840 |
| Size | 482.4 MB | 67.5 MB |
| Events in quadrant A | 2,057,654 | 506,185 |
| Events in quadrant B | 2,209,533 | 512,678 |
| Events in quadrant C | 2,302,950 | 497,926 |
| Events in quadrant D | 8,459,986 | 327,740 |
| Mode M0 | |||
|---|---|---|---|
| Quadrant | BADHDUFLAG | Total packets | Discarded packets |
| A | 0 | 8572 | 0 |
| B | 0 | 8986 | 0 |
| C | 0 | 9264 | 0 |
| D | 0 | 28063 | 0 |
| Mode SS | |||
|---|---|---|---|
| Quadrant | BADHDUFLAG | Total packets | Discarded packets |
| A | 0 | 84 | 0 |
| B | 0 | 84 | 0 |
| C | 0 | 84 | 0 |
| D | 0 | 84 | 0 |
| Quadrant | Total seconds | Saturated seconds | Saturation percentage |
|---|---|---|---|
| A | 4249 | 2 | 0.047070% |
| B | 4250 | 14 | 0.329412% |
| C | 4250 | 29 | 0.682353% |
| D | 4250 | 2369 | 55.741176% |
Noise dominated data is calculated using 1-second bins in cleaned event files. If a bin has >2000 counts, and if more than 50% of those come from <1% of pixels, then it is considered to be noise-dominated and hence unusable.
| Quadrant | # 1 sec bins | Bins with >0 counts | Bins with >2000 counts | High rate bins dominated by noise | Noise dominated (total time) | Noise dominated (detector-on time) | Marked lightcurve |
|---|---|---|---|---|---|---|---|
| A | 4249 | 4249 | 0 | 0 | 0.00% | 0.00% |  |
| B | 4250 | 4250 | 4 | 4 | 0.09% | 0.09% |  |
| C | 4250 | 4250 | 2 | 2 | 0.05% | 0.05% |  |
| D | 4250 | 4250 | 2311 | 2311 | 54.38% | 54.38% | 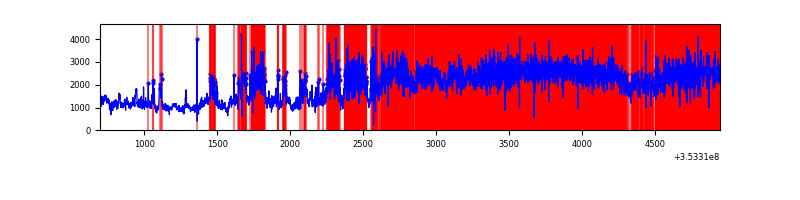 |
Top three noisy pixels from each quadrant. If the there are fewer than three noisy pixels in the level2.evt file, extra rows are filled as -1
| Pixel properties | Quadrant properties | ||||||
|---|---|---|---|---|---|---|---|
| Quadrant | DetID | PixID | Counts | Sigma | Mean | Median | Sigma |
| A | 13 | 254 | 8191 | 71.59 | 532 | 522 | 107.1 |
| A | 3 | 137 | 4616 | 38.22 | 532 | 522 | 107.1 |
| A | 0 | 226 | 4469 | 36.85 | 532 | 522 | 107.1 |
| B | 0 | 155 | 32683 | 330.36 | 527 | 515 | 97.4 |
| B | 0 | 190 | 32288 | 326.3 | 527 | 515 | 97.4 |
| B | 5 | 255 | 31120 | 314.31 | 527 | 515 | 97.4 |
| C | 3 | 233 | 154483 | 1316.7 | 511 | 517 | 116.9 |
| C | 14 | 238 | 86463 | 735.0 | 511 | 517 | 116.9 |
| C | 7 | 247 | 53651 | 454.4 | 511 | 517 | 116.9 |
| D | 8 | 195 | 3541640 | 37262.39 | 406 | 397 | 95.0 |
| D | 12 | 33 | 3168392 | 33334.93 | 406 | 397 | 95.0 |
| D | 7 | 80 | 88483 | 926.88 | 406 | 397 | 95.0 |
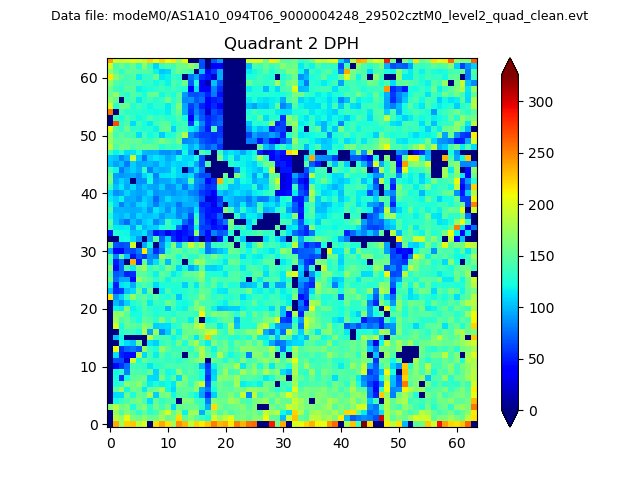
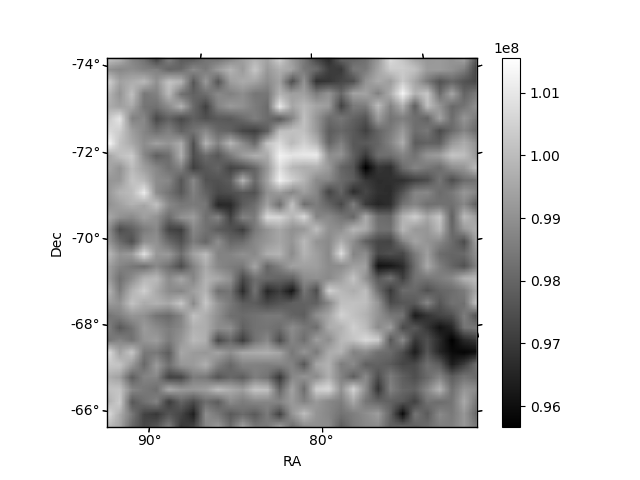
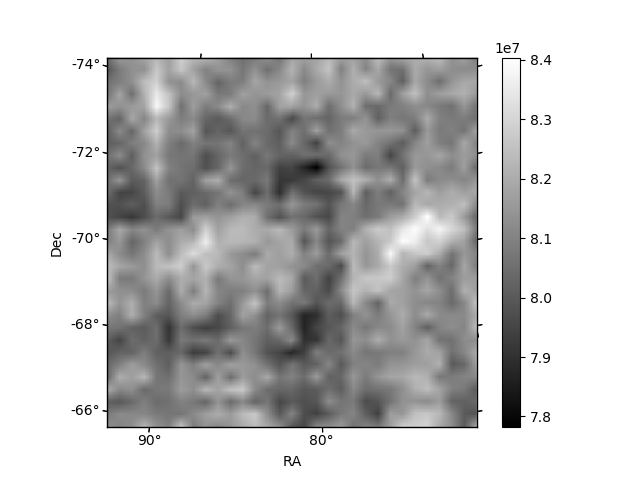
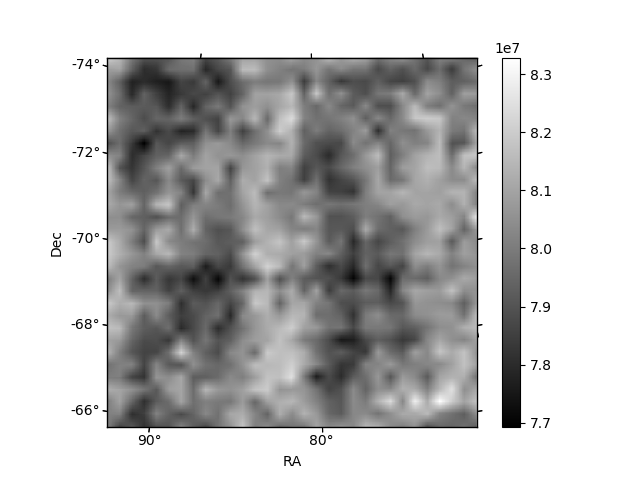
Histogram calculated using DETX and DETY for each event in the final _common_clean file
| Quadrant A | 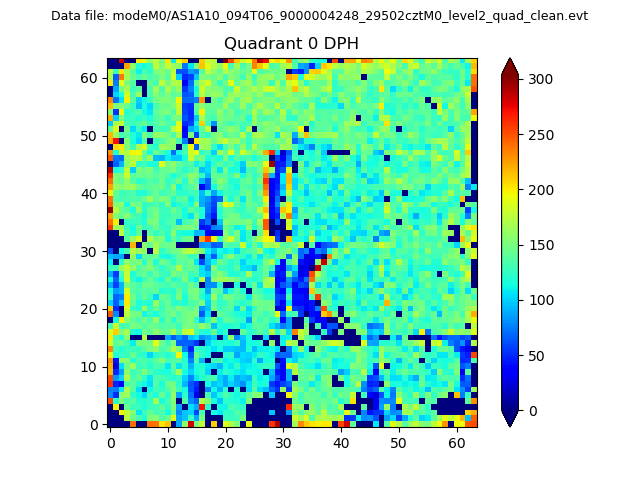 |
 |
Quadrant B |
|---|---|---|---|
| Quadrant D |  |
 |
Quadrant C |
| Plot type | Count rate plots | Images |
|---|---|---|
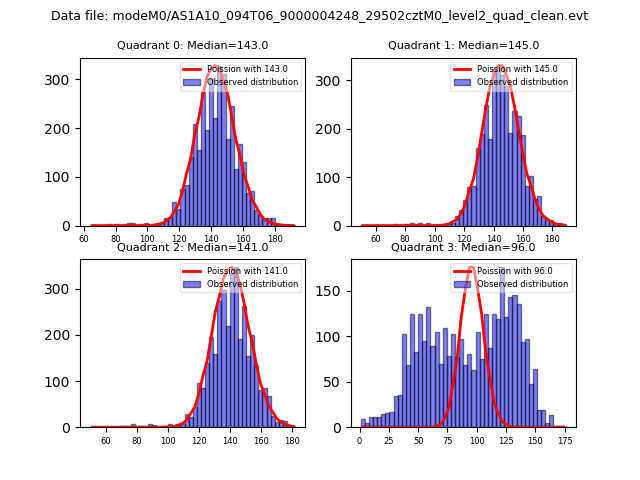
| Comparison with Poisson distribution Blue bars denote a histogram of data divided into 1 sec bins. Red curve is a Poisson curve with rate = median count rate of data. |
 |
 |
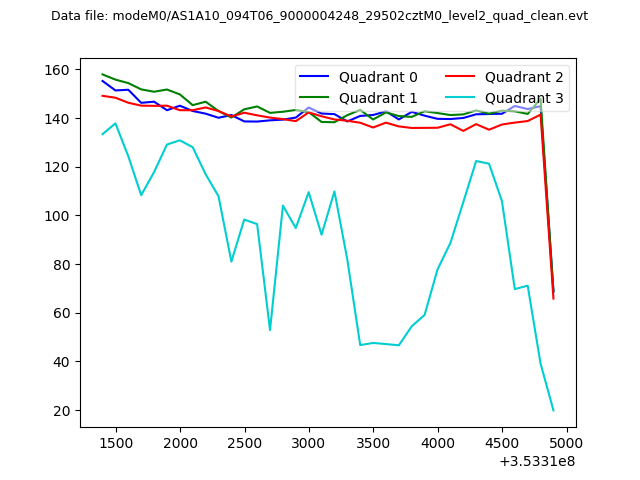
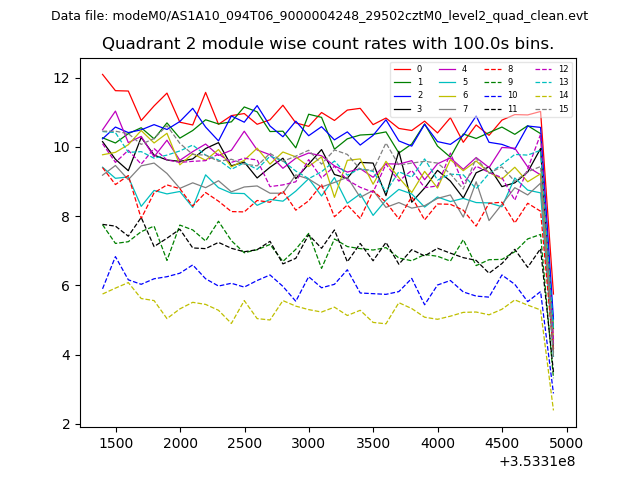
| Quadrant-wise count rates Data is divided into 100 sec bins |
 |
|
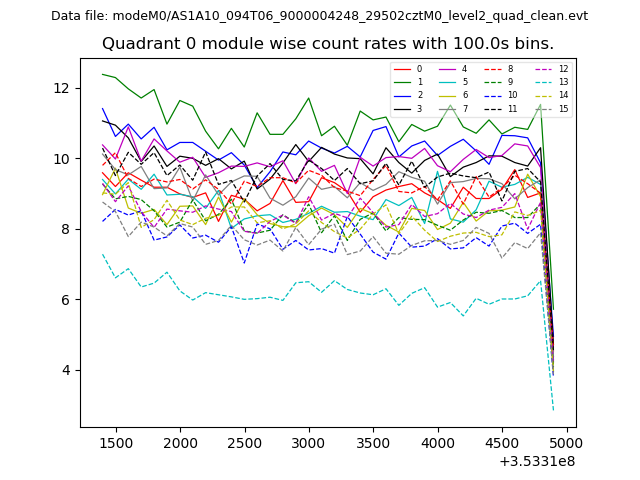
| Module-wise count rates for Quadrant A Data is divided into 100 sec bins |
 |
 |
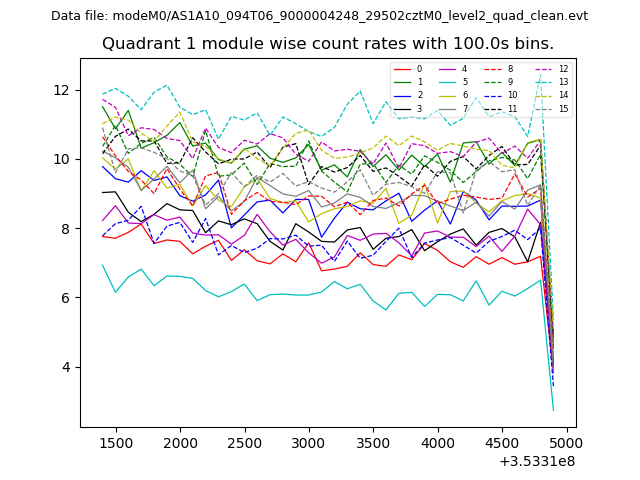
| Module-wise count rates for Quadrant B Data is divided into 100 sec bins |
 |
 |
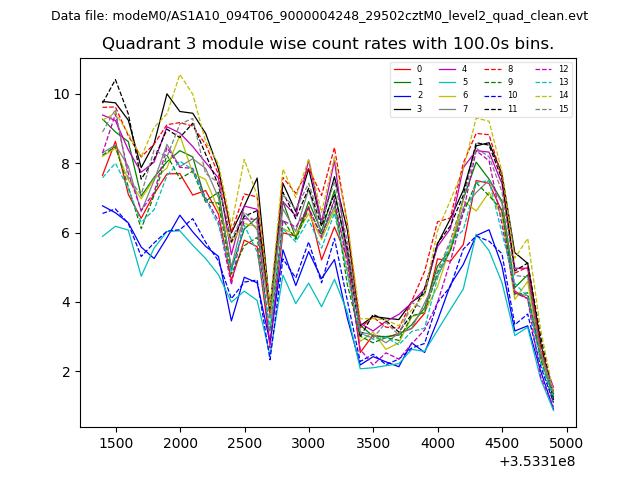
| Module-wise count rates for Quadrant C Data is divided into 100 sec bins |
 |
 |
| Module-wise count rates for Quadrant D Data is divided into 100 sec bins |
 |
 |
| Parameter | Plot |
|---|---|
| CZT HV Monitor |  |
| D_VDD | 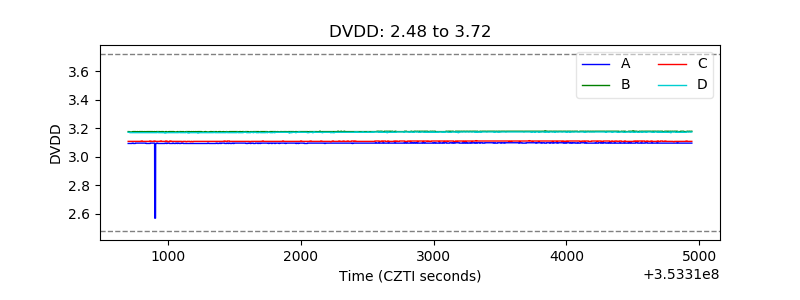 |
| Temperature 1 | 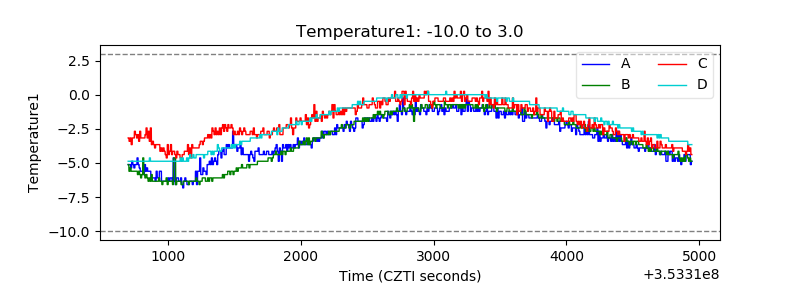 |
| Veto HV Monitor | 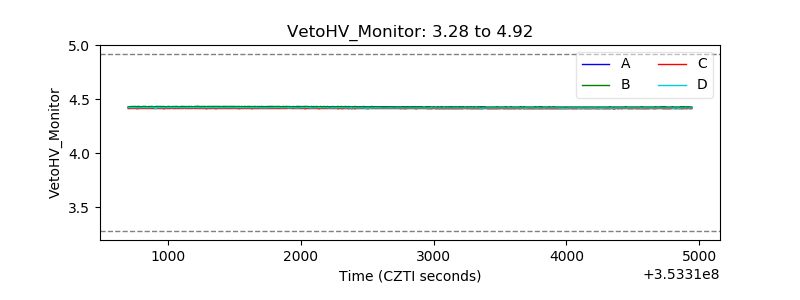 |
| Veto LLD | 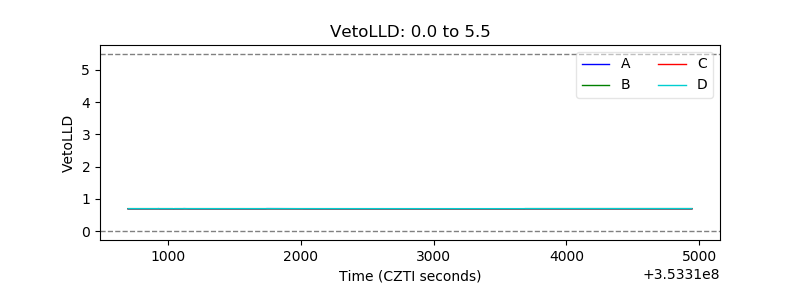 |
| Alpha Counter | 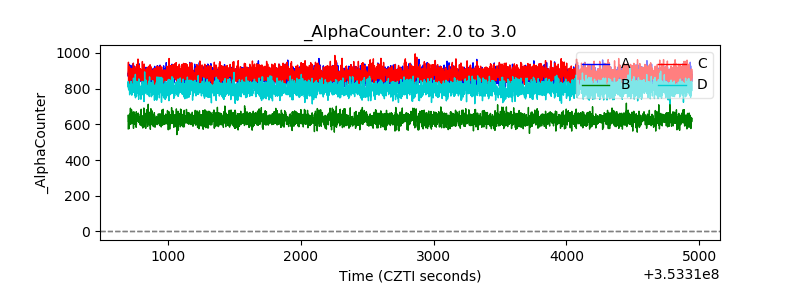 |
| _CPM_Rate | 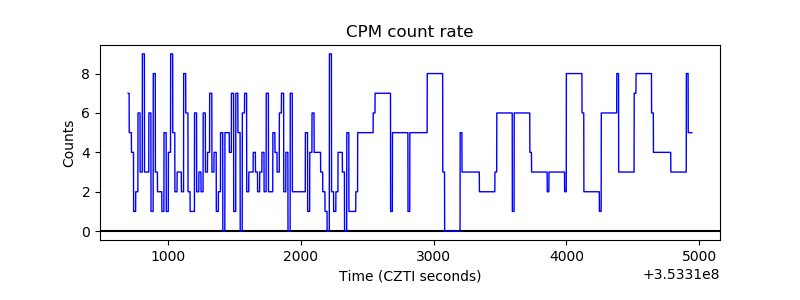 |
| CZT Counter | 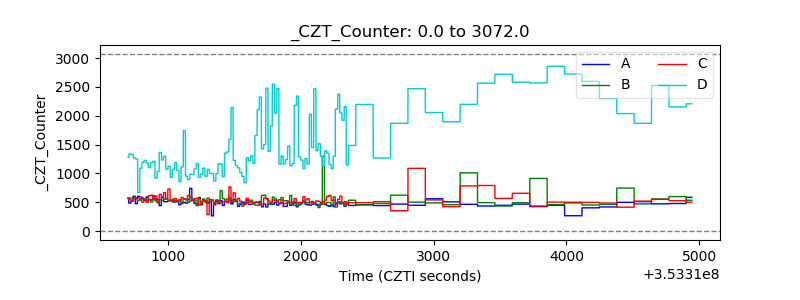 |
| +2.5 Volts monitor |  |
| +5 Volts monitor |  |
| _ROLL_ROT | 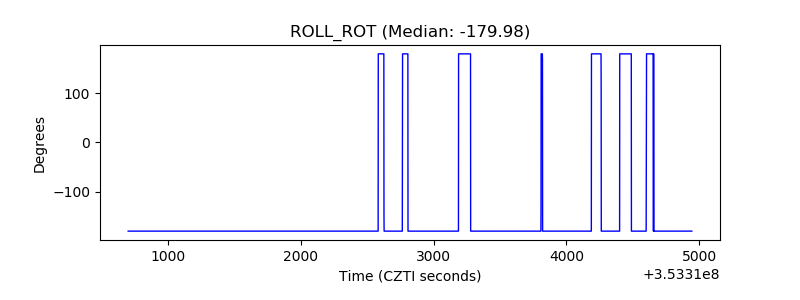 |
| _Roll_DEC | 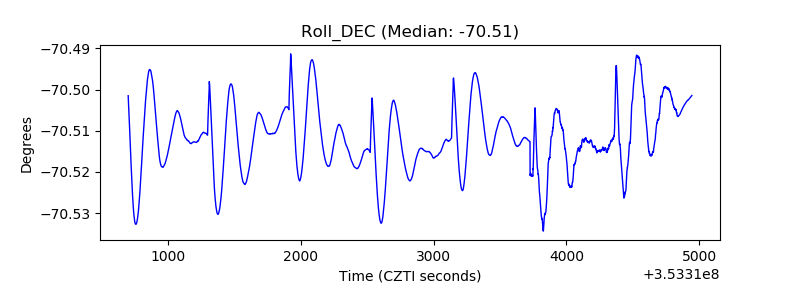 |
| _Roll_RA | 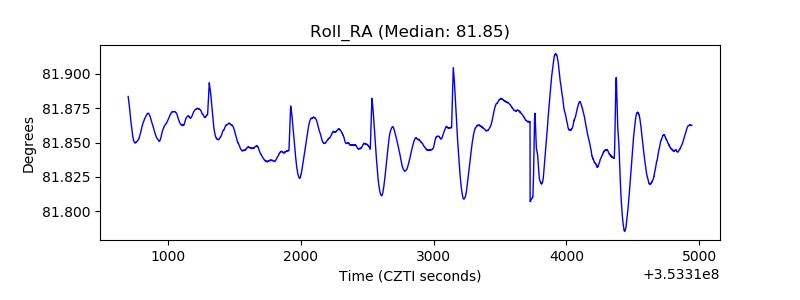 |
| Veto Counter | 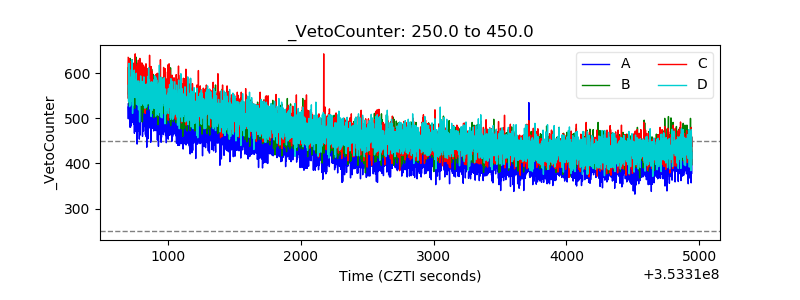 |