| Param | Original file | Final file |
|---|---|---|
| Filename | modeM0/AS1A10_073T07_9000004254cztM0_level2.fits | modeM0/AS1A10_073T07_9000004254cztM0_level2_quad_clean.evt |
| Size (bytes) | 759,070,080 | 521,997,120 |
| Size | 723.9 MB | 497.8 MB |
| Events in quadrant A | 6,080,765 | 3,206,862 |
| Events in quadrant B | 5,796,670 | 3,478,030 |
| Events in quadrant C | 2,889,372 | 1,917,788 |
| Events in quadrant D | 3,478,774 | 2,470,680 |
| Mode SS | |||
|---|---|---|---|
| Quadrant | BADHDUFLAG | Total packets | Discarded packets |
| A | 0 | 1998 | 0 |
| B | 0 | 2496 | 0 |
| C | 0 | 2490 | 0 |
| D | 0 | 2496 | 0 |
| Mode M9 | |||
|---|---|---|---|
| Quadrant | BADHDUFLAG | Total packets | Discarded packets |
| A | 0 | 202 | 0 |
| B | 0 | 194 | 0 |
| C | 0 | 203 | 0 |
| D | 0 | 194 | 0 |
| Mode M0 | |||
|---|---|---|---|
| Quadrant | BADHDUFLAG | Total packets | Discarded packets |
| A | 0 | 152956 | 0 |
| B | 0 | 156566 | 0 |
| C | 0 | 158508 | 0 |
| D | 0 | 403956 | 0 |
| Quadrant | Total seconds | Saturated seconds | Saturation percentage |
|---|---|---|---|
| A | 72548 | 702 | 0.967635% |
| B | 72464 | 1016 | 1.402076% |
| C | 72476 | 2055 | 2.835421% |
| D | 71111 | 17662 | 24.837226% |
Noise dominated data is calculated using 1-second bins in cleaned event files. If a bin has >2000 counts, and if more than 50% of those come from <1% of pixels, then it is considered to be noise-dominated and hence unusable.
| Quadrant | # 1 sec bins | Bins with >0 counts | Bins with >2000 counts | High rate bins dominated by noise | Noise dominated (total time) | Noise dominated (detector-on time) | Marked lightcurve |
|---|---|---|---|---|---|---|---|
| A | 133943 | 75288 | 0 | 0 | 0.00% | 0.00% |  |
| B | 133583 | 75164 | 0 | 0 | 0.00% | 0.00% |  |
| C | 64805 | 46757 | 0 | 0 | 0.00% | 0.00% |  |
| D | 133583 | 71287 | 0 | 0 | 0.00% | 0.00% |  |
Top three noisy pixels from each quadrant. If the there are fewer than three noisy pixels in the level2.evt file, extra rows are filled as -1
| Pixel properties | Quadrant properties | ||||||
|---|---|---|---|---|---|---|---|
| Quadrant | DetID | PixID | Counts | Sigma | Mean | Median | Sigma |
| A | 0 | 29 | 3833 | 6.67 | 1596 | 1532 | 344.9 |
| A | 7 | 110 | 3752 | 6.43 | 1596 | 1532 | 344.9 |
| A | 12 | 254 | 3668 | 6.19 | 1596 | 1532 | 344.9 |
| B | 2 | 9 | 3721 | 8.3 | 1544 | 1486 | 269.4 |
| B | 5 | 232 | 3393 | 7.08 | 1544 | 1486 | 269.4 |
| B | 5 | 225 | 3166 | 6.24 | 1544 | 1486 | 269.4 |
| C | 1 | 81 | 2332 | 8.22 | 762 | 714 | 196.7 |
| C | 1 | 80 | 2252 | 7.82 | 762 | 714 | 196.7 |
| C | 3 | 126 | 2005 | 6.56 | 762 | 714 | 196.7 |
| D | 15 | 46 | 2647 | 6.61 | 993 | 907 | 263.3 |
| D | 6 | 67 | 2490 | 6.01 | 993 | 907 | 263.3 |
| D | 7 | 3 | 2473 | 5.95 | 993 | 907 | 263.3 |
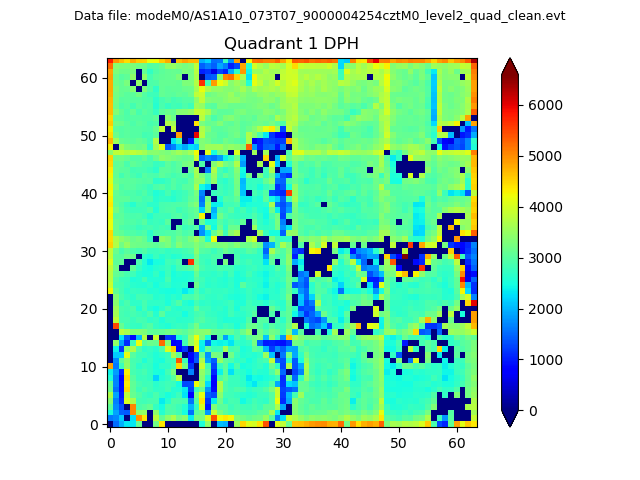
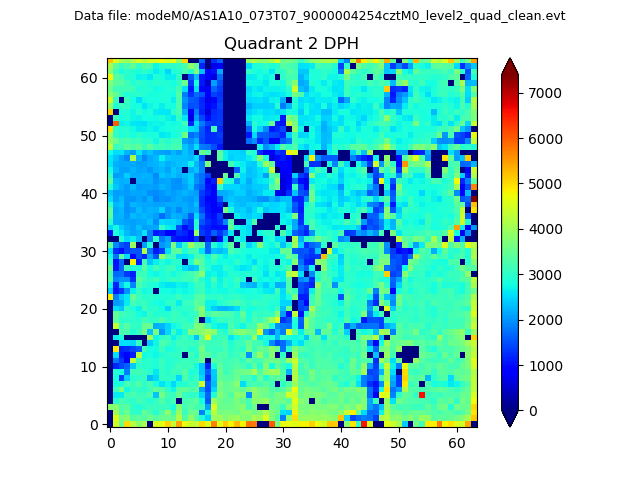
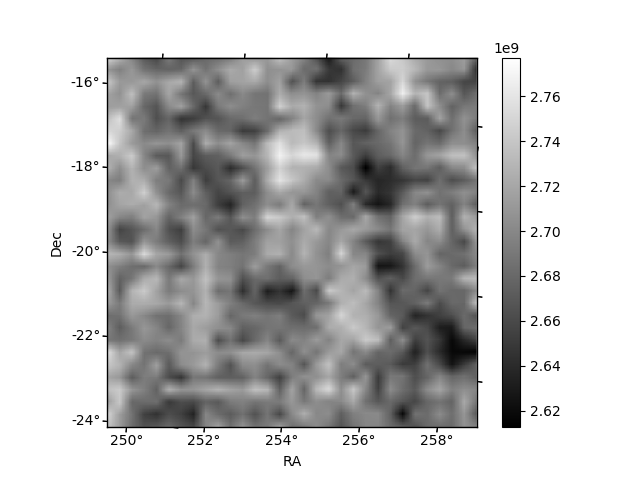
Histogram calculated using DETX and DETY for each event in the final _common_clean file
| Quadrant A |  |
 |
Quadrant B |
|---|---|---|---|
| Quadrant D | 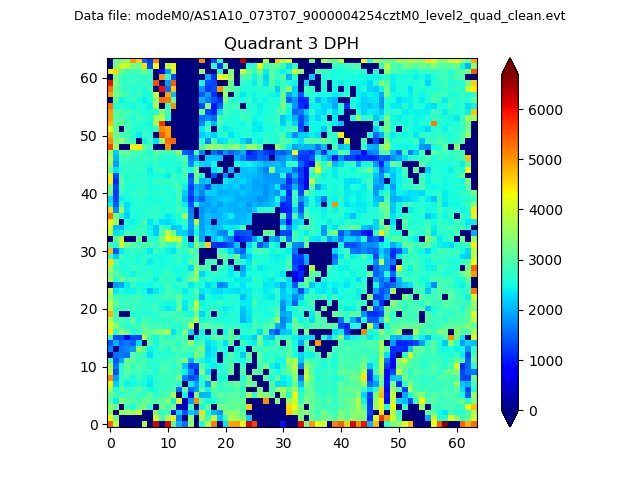 |
 |
Quadrant C |
| Plot type | Count rate plots | Images |
|---|---|---|
| Comparison with Poisson distribution Blue bars denote a histogram of data divided into 1 sec bins. Red curve is a Poisson curve with rate = median count rate of data. |
 |
 |
| Quadrant-wise count rates Data is divided into 100 sec bins |
 |
|
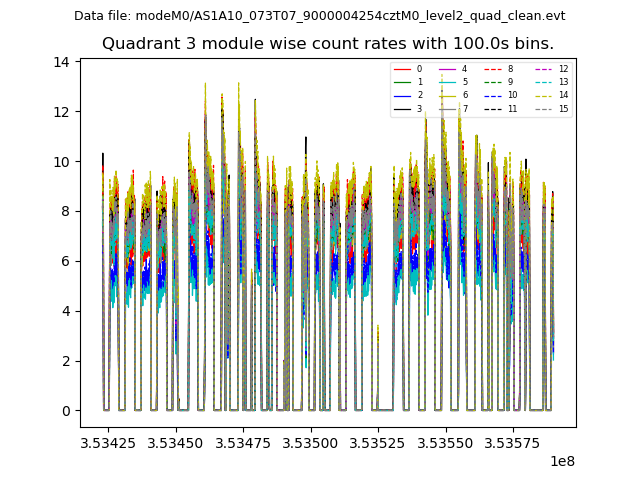
| Module-wise count rates for Quadrant A Data is divided into 100 sec bins |
 |
 |
| Module-wise count rates for Quadrant B Data is divided into 100 sec bins |
 |
 |
| Module-wise count rates for Quadrant C Data is divided into 100 sec bins |
 |
 |
| Module-wise count rates for Quadrant D Data is divided into 100 sec bins |
 |
 |
| Parameter | Plot |
|---|---|
| CZT HV Monitor |  |
| D_VDD |  |
| Temperature 1 |  |
| Veto HV Monitor |  |
| Veto LLD |  |
| Alpha Counter |  |
| _CPM_Rate |  |
| CZT Counter |  |
| +2.5 Volts monitor |  |
| +5 Volts monitor |  |
| _ROLL_ROT |  |
| _Roll_DEC |  |
| _Roll_RA |  |
| Veto Counter | 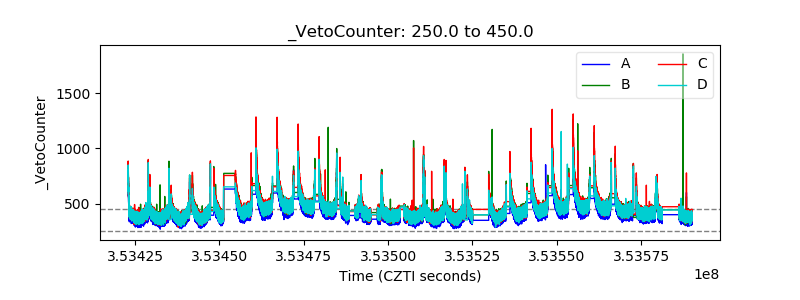 |