| Param | Original file | Final file |
|---|---|---|
| Filename | modeM0/AS1A10_073T07_9000004254_29522cztM0_level2.evt | modeM0/AS1A10_073T07_9000004254_29522cztM0_level2_quad_clean.evt |
| Size (bytes) | 1,159,692,480 | 131,518,080 |
| Size | 1.1 GB | 125.4 MB |
| Events in quadrant A | 5,094,570 | 828,893 |
| Events in quadrant B | 5,239,399 | 845,104 |
| Events in quadrant C | 5,314,351 | 821,415 |
| Events in quadrant D | 18,745,213 | 738,135 |
| Mode SS | |||
|---|---|---|---|
| Quadrant | BADHDUFLAG | Total packets | Discarded packets |
| A | 0 | 216 | 0 |
| B | 0 | 216 | 0 |
| C | 0 | 216 | 0 |
| D | 0 | 216 | 0 |
| Mode M9 | |||
|---|---|---|---|
| Quadrant | BADHDUFLAG | Total packets | Discarded packets |
| A | 0 | 5 | 0 |
| B | 0 | 5 | 0 |
| C | 0 | 5 | 0 |
| D | 0 | 5 | 0 |
| Mode M0 | |||
|---|---|---|---|
| Quadrant | BADHDUFLAG | Total packets | Discarded packets |
| A | 0 | 22248 | 1 |
| B | 0 | 22489 | 1 |
| C | 0 | 22506 | 1 |
| D | 0 | 63178 | 1 |
| Quadrant | Total seconds | Saturated seconds | Saturation percentage |
|---|---|---|---|
| A | 10822 | 137 | 1.265940% |
| B | 10823 | 172 | 1.589208% |
| C | 10823 | 310 | 2.864271% |
| D | 10823 | 2637 | 24.364779% |
Noise dominated data is calculated using 1-second bins in cleaned event files. If a bin has >2000 counts, and if more than 50% of those come from <1% of pixels, then it is considered to be noise-dominated and hence unusable.
| Quadrant | # 1 sec bins | Bins with >0 counts | Bins with >2000 counts | High rate bins dominated by noise | Noise dominated (total time) | Noise dominated (detector-on time) | Marked lightcurve |
|---|---|---|---|---|---|---|---|
| A | 11273 | 10824 | 0 | 0 | 0.00% | 0.00% |  |
| B | 11274 | 10825 | 14 | 14 | 0.12% | 0.13% | 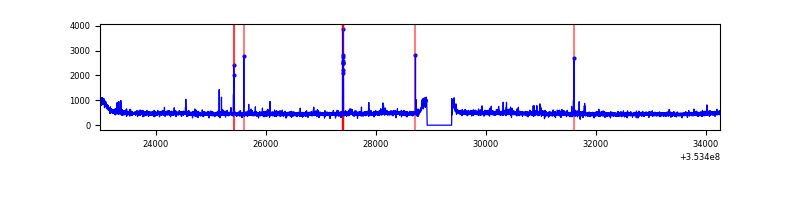 |
| C | 11274 | 10824 | 1 | 1 | 0.01% | 0.01% | 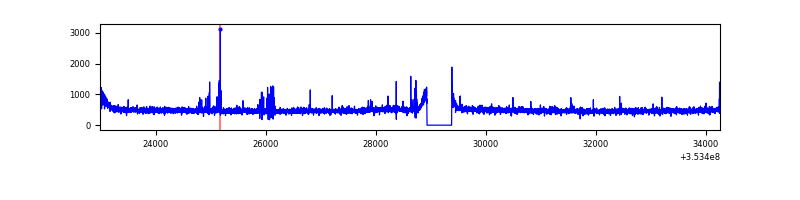 |
| D | 11274 | 10825 | 3077 | 3077 | 27.29% | 28.42% | 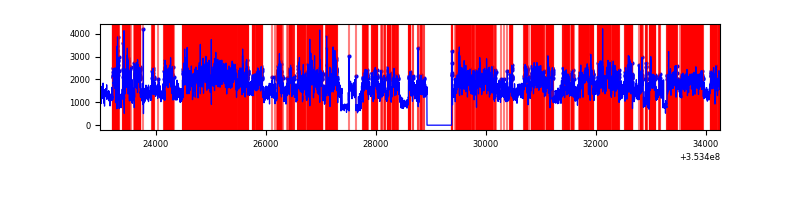 |
Top three noisy pixels from each quadrant. If the there are fewer than three noisy pixels in the level2.evt file, extra rows are filled as -1
| Pixel properties | Quadrant properties | ||||||
|---|---|---|---|---|---|---|---|
| Quadrant | DetID | PixID | Counts | Sigma | Mean | Median | Sigma |
| A | 0 | 13 | 30244 | 107.83 | 1311 | 1280 | 268.6 |
| A | 13 | 254 | 21735 | 76.15 | 1311 | 1280 | 268.6 |
| A | 3 | 137 | 12934 | 43.39 | 1311 | 1280 | 268.6 |
| B | 0 | 190 | 38521 | 146.44 | 1304 | 1267 | 254.4 |
| B | 15 | 33 | 36357 | 137.94 | 1304 | 1267 | 254.4 |
| B | 12 | 111 | 31509 | 118.88 | 1304 | 1267 | 254.4 |
| C | 14 | 238 | 236592 | 789.28 | 1261 | 1274 | 298.1 |
| C | 3 | 233 | 56822 | 186.31 | 1261 | 1274 | 298.1 |
| C | 14 | 254 | 56667 | 185.79 | 1261 | 1274 | 298.1 |
| D | 8 | 195 | 12752631 | 43436.89 | 1218 | 1188 | 293.6 |
| D | 7 | 223 | 559505 | 1901.87 | 1218 | 1188 | 293.6 |
| D | 13 | 153 | 343848 | 1167.25 | 1218 | 1188 | 293.6 |
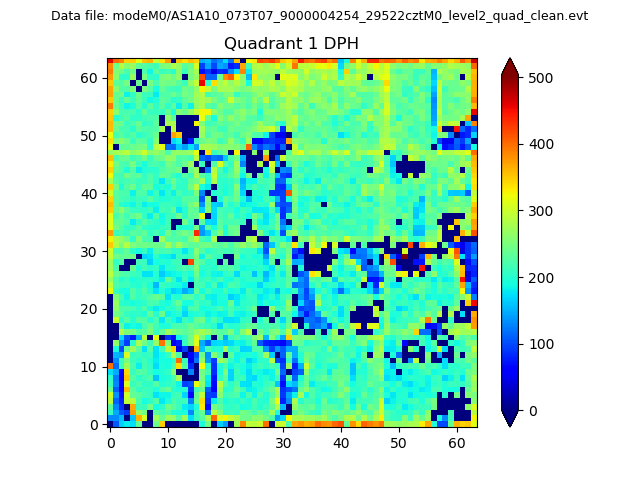
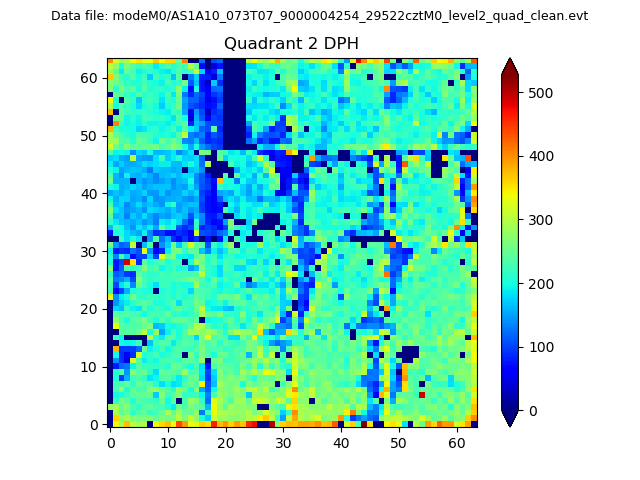
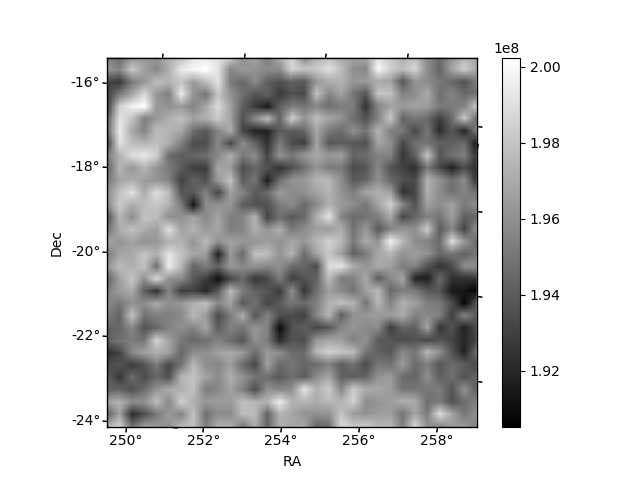
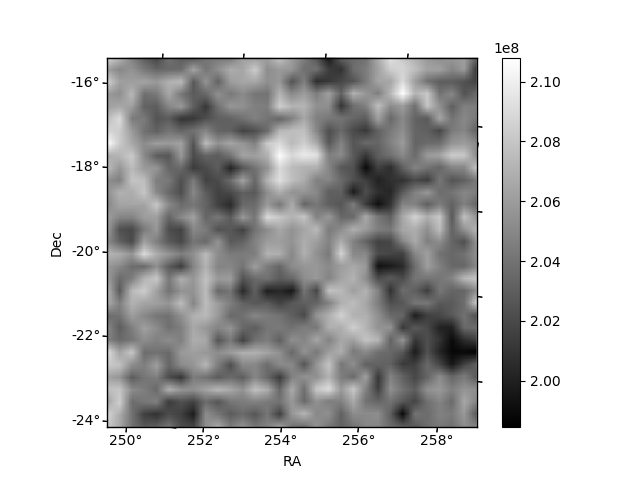
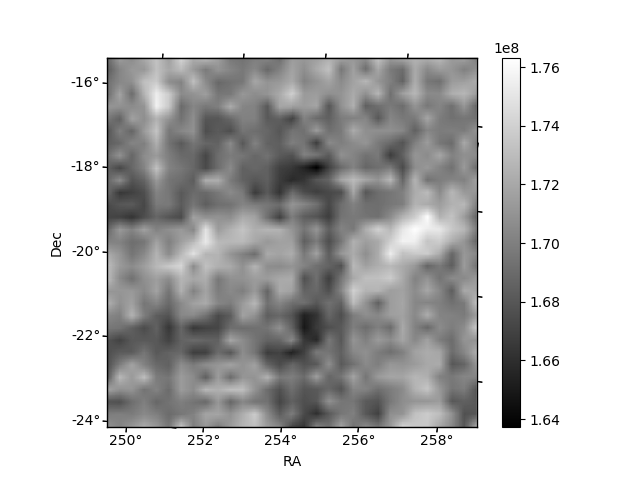
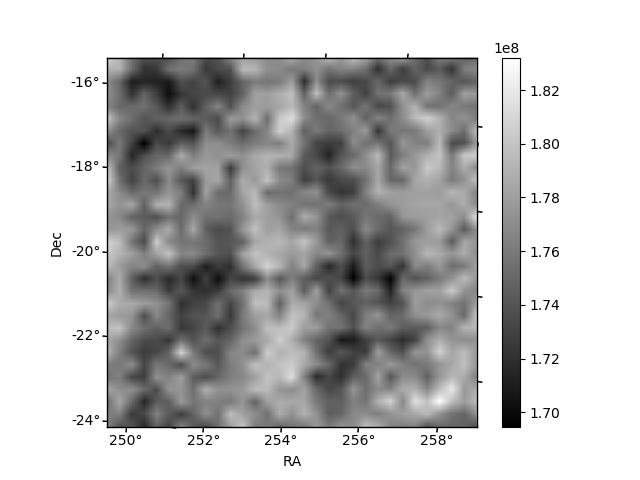
Histogram calculated using DETX and DETY for each event in the final _common_clean file
| Quadrant A |  |
 |
Quadrant B |
|---|---|---|---|
| Quadrant D | 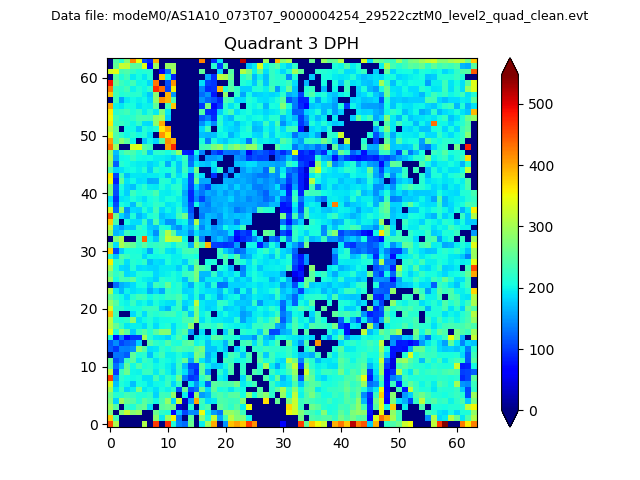 |
 |
Quadrant C |
| Plot type | Count rate plots | Images |
|---|---|---|
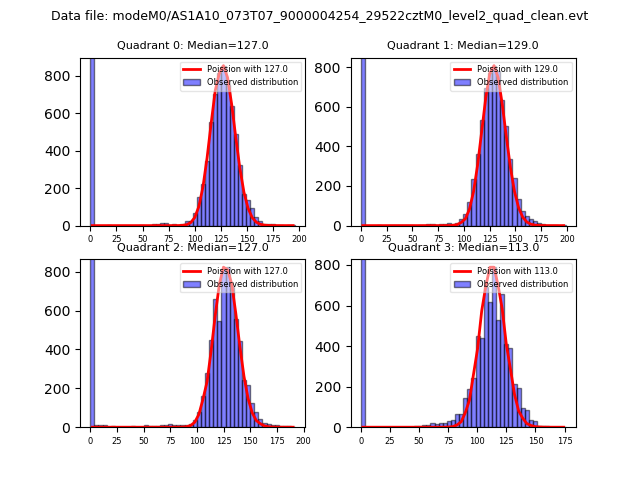
| Comparison with Poisson distribution Blue bars denote a histogram of data divided into 1 sec bins. Red curve is a Poisson curve with rate = median count rate of data. |
 |
 |
| Quadrant-wise count rates Data is divided into 100 sec bins |
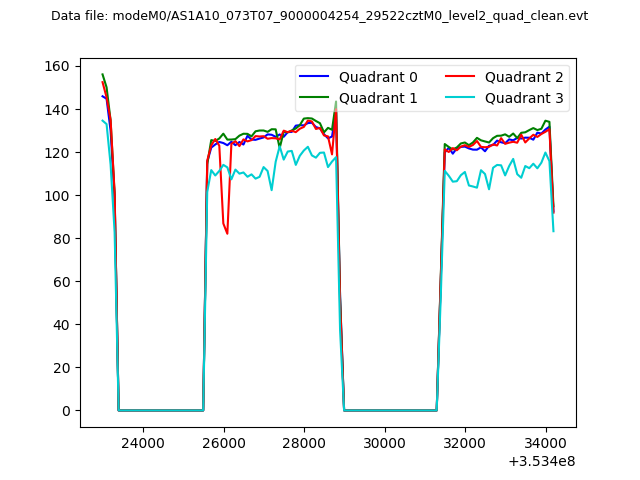 |
|
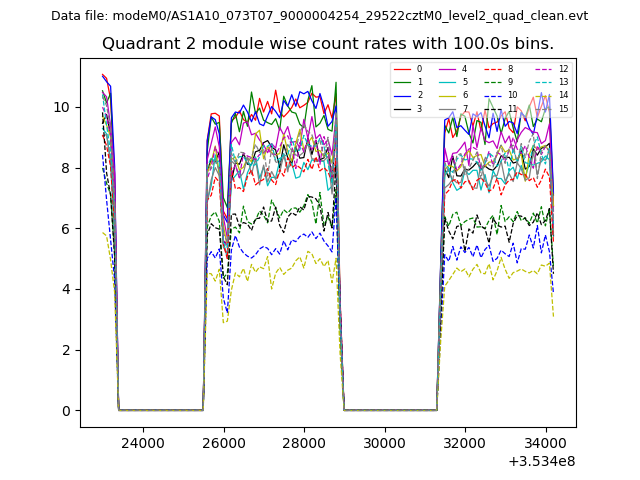
| Module-wise count rates for Quadrant A Data is divided into 100 sec bins |
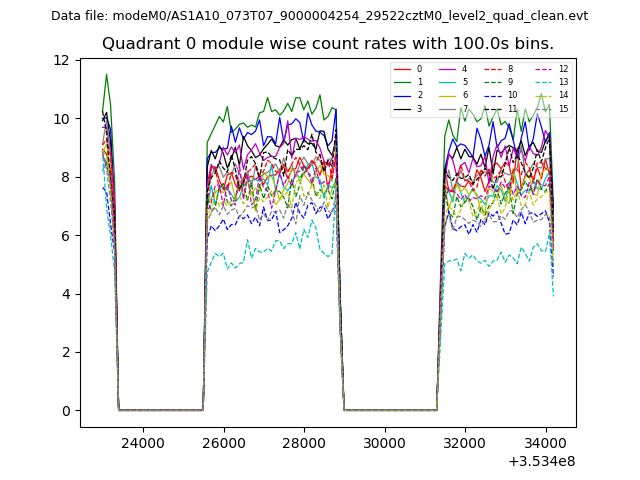 |
 |
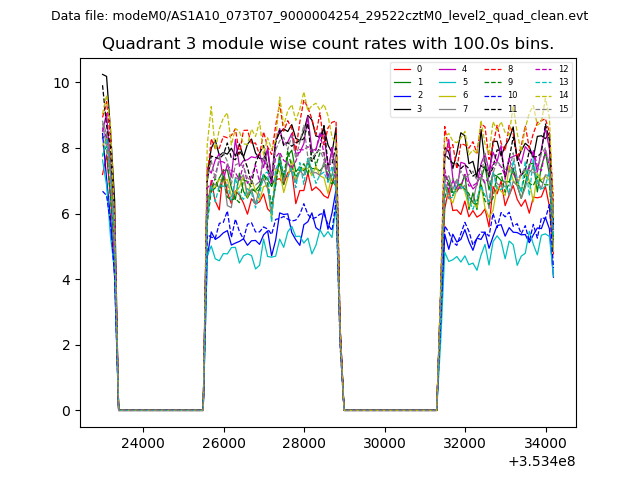
| Module-wise count rates for Quadrant B Data is divided into 100 sec bins |
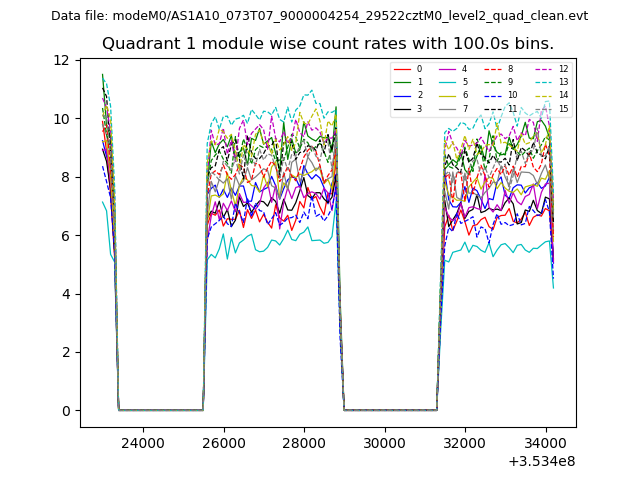 |
 |
| Module-wise count rates for Quadrant C Data is divided into 100 sec bins |
 |
 |
| Module-wise count rates for Quadrant D Data is divided into 100 sec bins |
 |
 |
| Parameter | Plot |
|---|---|
| CZT HV Monitor | 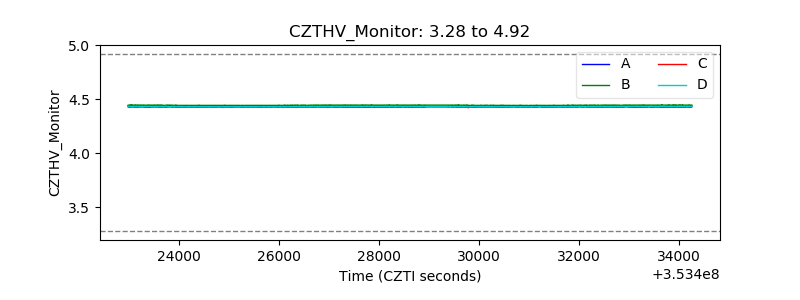 |
| D_VDD | 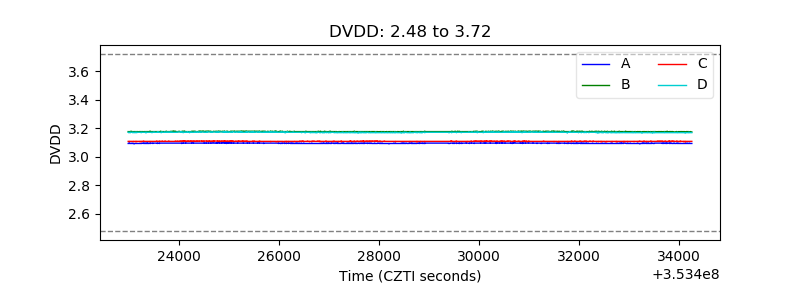 |
| Temperature 1 | 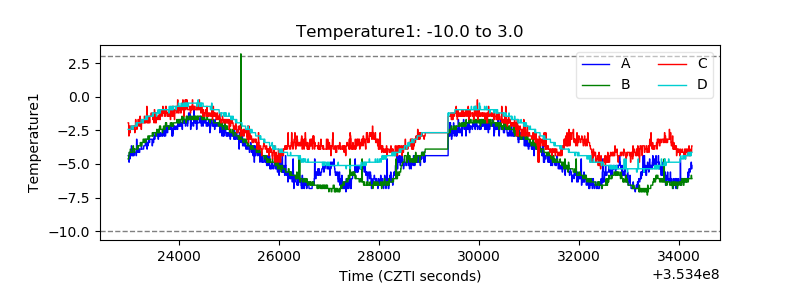 |
| Veto HV Monitor | 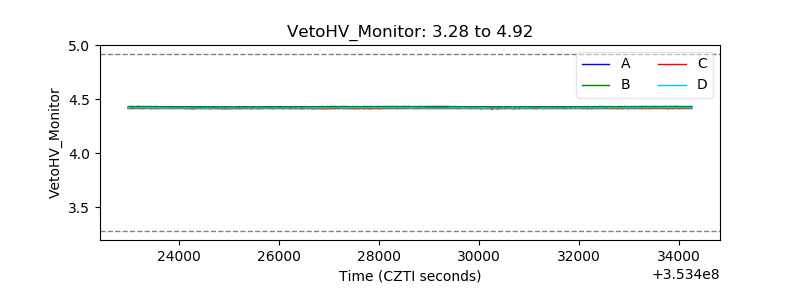 |
| Veto LLD |  |
| Alpha Counter | 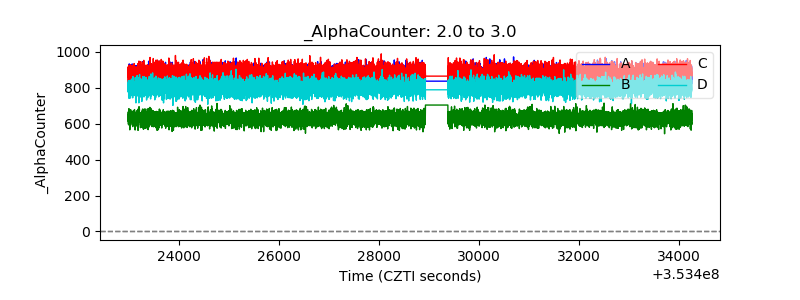 |
| _CPM_Rate | 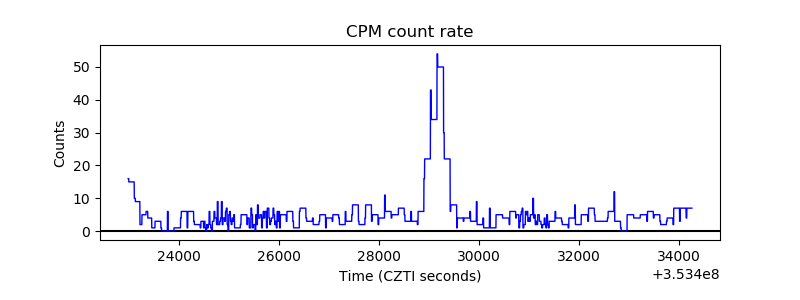 |
| CZT Counter | 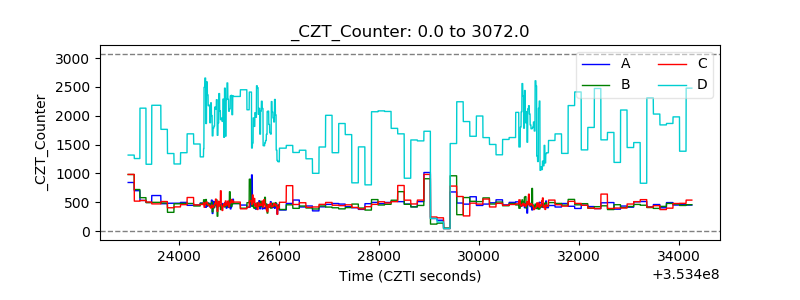 |
| +2.5 Volts monitor |  |
| +5 Volts monitor |  |
| _ROLL_ROT | 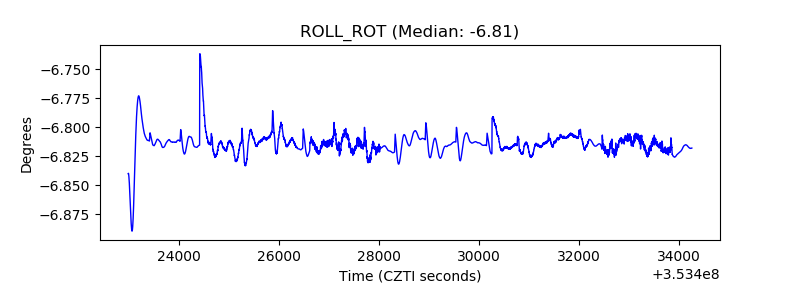 |
| _Roll_DEC | 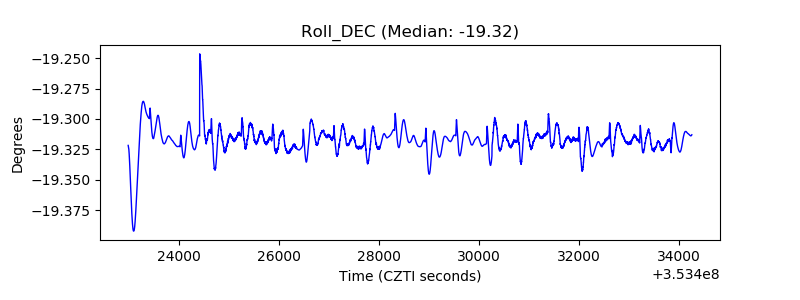 |
| _Roll_RA | 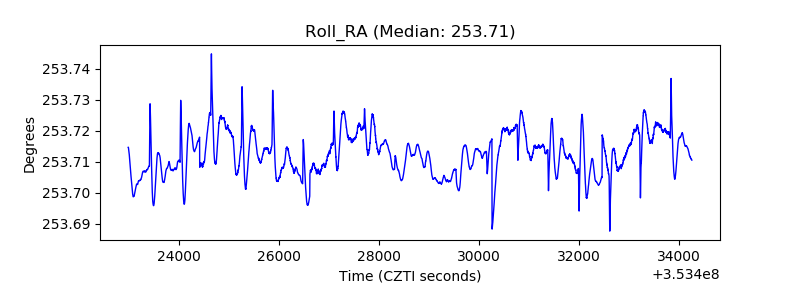 |
| Veto Counter | 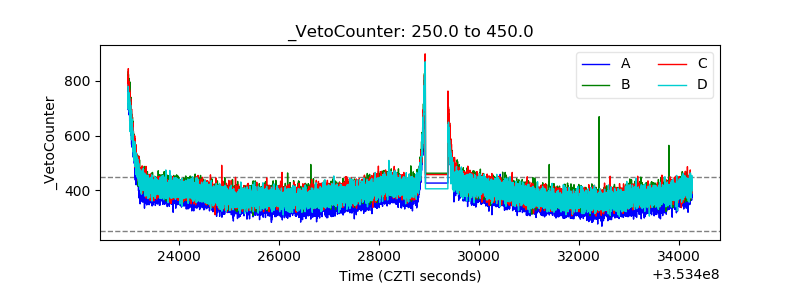 |