| Param | Original file | Final file |
|---|---|---|
| Filename | modeM0/AS1A10_073T07_9000004254_29523cztM0_level2.evt | modeM0/AS1A10_073T07_9000004254_29523cztM0_level2_quad_clean.evt |
| Size (bytes) | 2,037,401,280 | 225,777,600 |
| Size | 1.9 GB | 215.3 MB |
| Events in quadrant A | 8,853,625 | 1,427,148 |
| Events in quadrant B | 9,113,742 | 1,455,873 |
| Events in quadrant C | 9,247,175 | 1,417,235 |
| Events in quadrant D | 33,244,507 | 1,260,611 |
| Mode SS | |||
|---|---|---|---|
| Quadrant | BADHDUFLAG | Total packets | Discarded packets |
| A | 0 | 376 | 0 |
| B | 0 | 376 | 0 |
| C | 0 | 376 | 0 |
| D | 0 | 376 | 0 |
| Mode M9 | |||
|---|---|---|---|
| Quadrant | BADHDUFLAG | Total packets | Discarded packets |
| A | 0 | 20 | 0 |
| B | 0 | 20 | 0 |
| C | 0 | 20 | 0 |
| D | 0 | 20 | 0 |
| Mode M0 | |||
|---|---|---|---|
| Quadrant | BADHDUFLAG | Total packets | Discarded packets |
| A | 0 | 38212 | 4 |
| B | 0 | 38739 | 4 |
| C | 0 | 38706 | 5 |
| D | 0 | 111606 | 4 |
| Quadrant | Total seconds | Saturated seconds | Saturation percentage |
|---|---|---|---|
| A | 18523 | 238 | 1.284889% |
| B | 18523 | 292 | 1.576419% |
| C | 18522 | 488 | 2.634705% |
| D | 18522 | 5693 | 30.736422% |
Noise dominated data is calculated using 1-second bins in cleaned event files. If a bin has >2000 counts, and if more than 50% of those come from <1% of pixels, then it is considered to be noise-dominated and hence unusable.
| Quadrant | # 1 sec bins | Bins with >0 counts | Bins with >2000 counts | High rate bins dominated by noise | Noise dominated (total time) | Noise dominated (detector-on time) | Marked lightcurve |
|---|---|---|---|---|---|---|---|
| A | 20454 | 18527 | 0 | 0 | 0.00% | 0.00% | 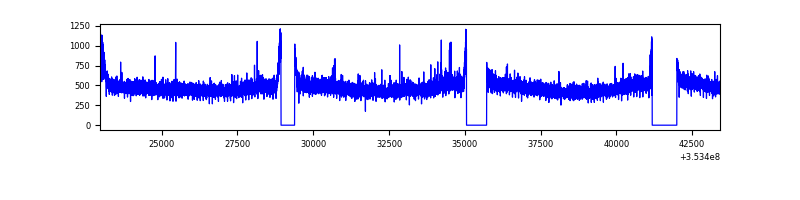 |
| B | 20454 | 18527 | 18 | 18 | 0.09% | 0.10% | 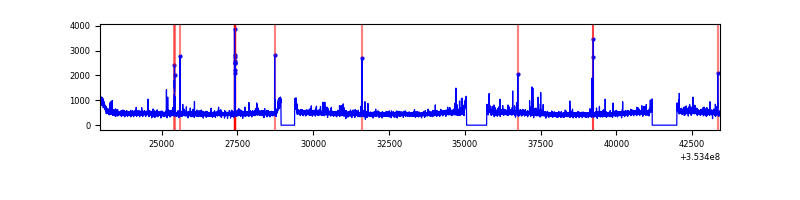 |
| C | 20453 | 18525 | 3 | 3 | 0.01% | 0.02% | 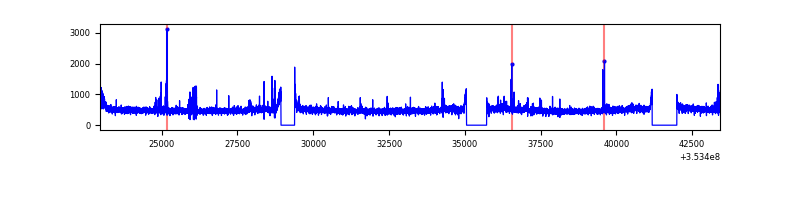 |
| D | 20453 | 18526 | 6180 | 6180 | 30.22% | 33.36% | 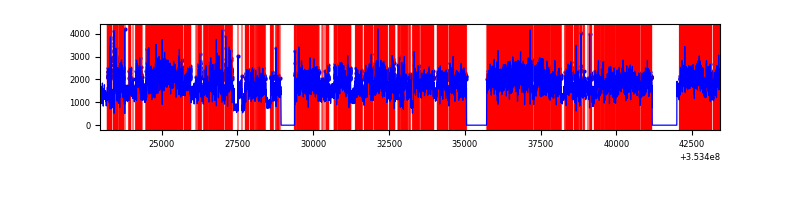 |
Top three noisy pixels from each quadrant. If the there are fewer than three noisy pixels in the level2.evt file, extra rows are filled as -1
| Pixel properties | Quadrant properties | ||||||
|---|---|---|---|---|---|---|---|
| Quadrant | DetID | PixID | Counts | Sigma | Mean | Median | Sigma |
| A | 0 | 13 | 47364 | 97.21 | 2279 | 2227 | 464.3 |
| A | 13 | 254 | 36619 | 74.07 | 2279 | 2227 | 464.3 |
| A | 3 | 137 | 22814 | 44.34 | 2279 | 2227 | 464.3 |
| B | 0 | 190 | 85909 | 190.65 | 2263 | 2205 | 439.0 |
| B | 12 | 111 | 54724 | 119.62 | 2263 | 2205 | 439.0 |
| B | 11 | 111 | 49673 | 108.12 | 2263 | 2205 | 439.0 |
| C | 14 | 238 | 398183 | 766.08 | 2192 | 2211 | 516.9 |
| C | 3 | 233 | 129036 | 245.37 | 2192 | 2211 | 516.9 |
| C | 14 | 254 | 78371 | 147.35 | 2192 | 2211 | 516.9 |
| D | 8 | 195 | 23633012 | 47248.9 | 2087 | 2033 | 500.1 |
| D | 7 | 223 | 606269 | 1208.14 | 2087 | 2033 | 500.1 |
| D | 13 | 153 | 417483 | 830.67 | 2087 | 2033 | 500.1 |
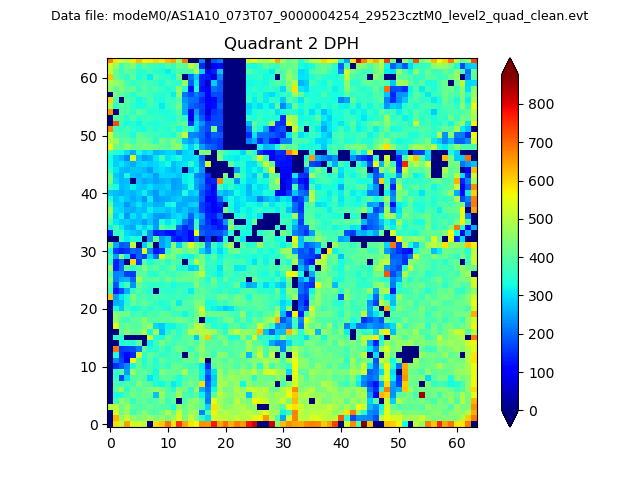
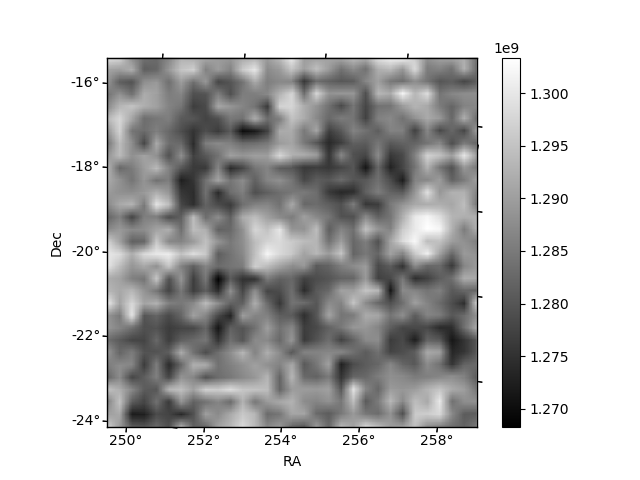
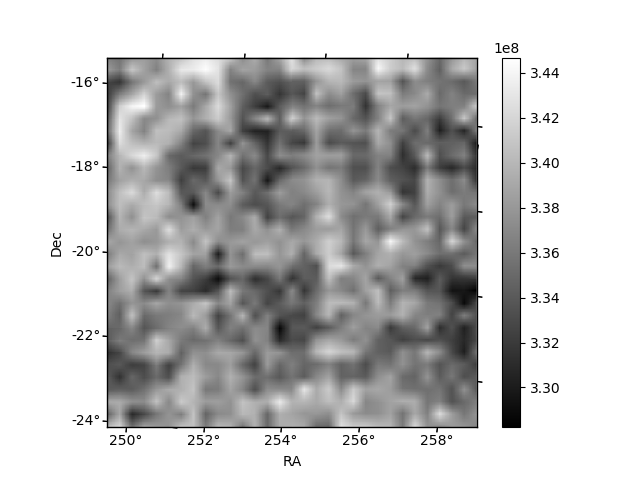
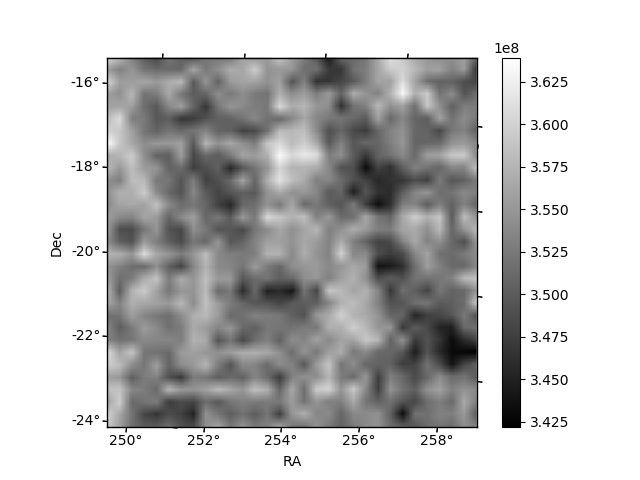
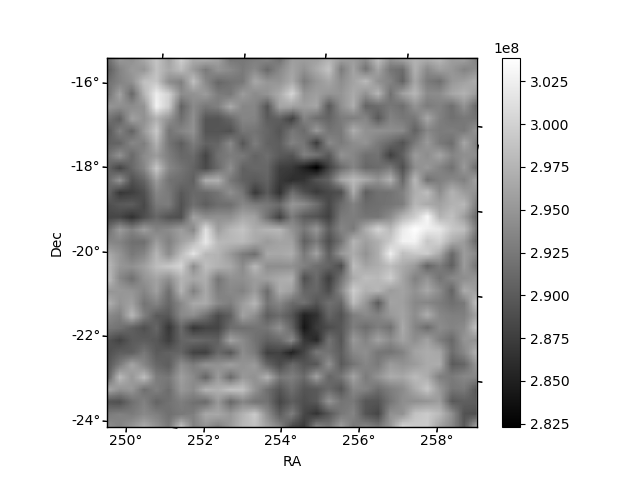
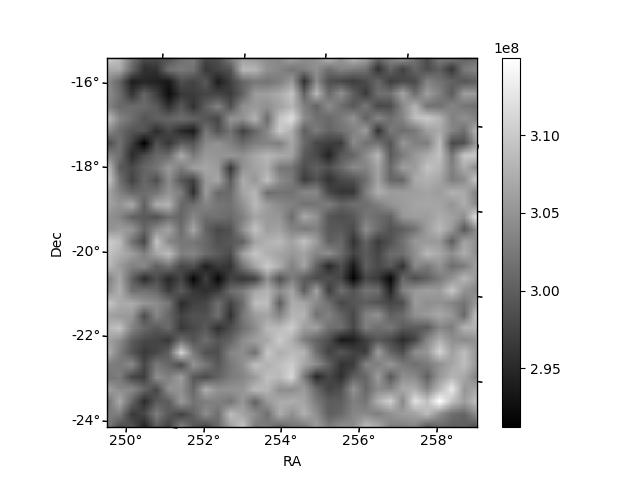
Histogram calculated using DETX and DETY for each event in the final _common_clean file
| Quadrant A | 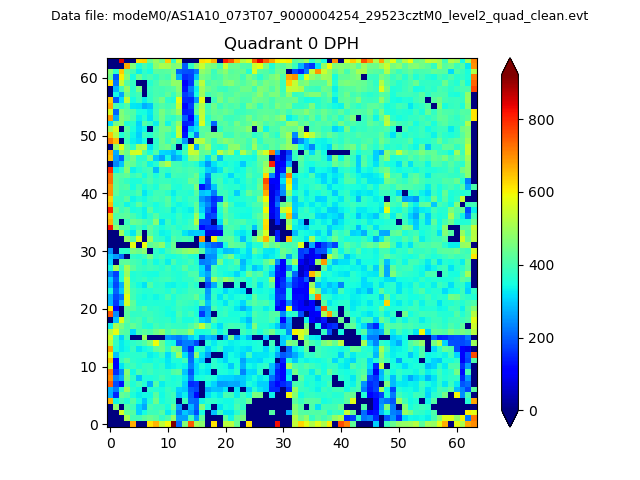 |
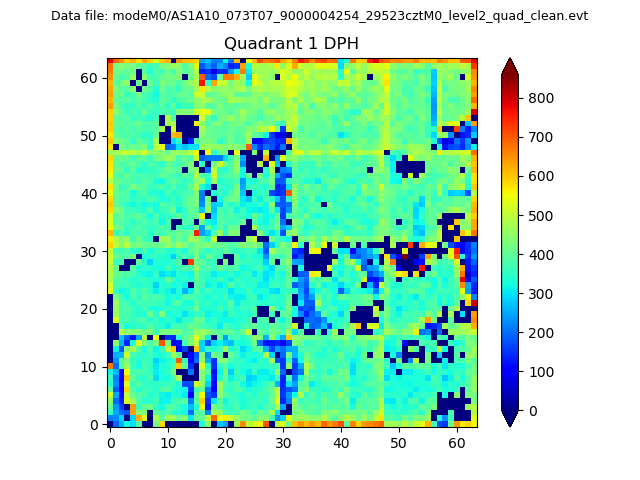 |
Quadrant B |
|---|---|---|---|
| Quadrant D | 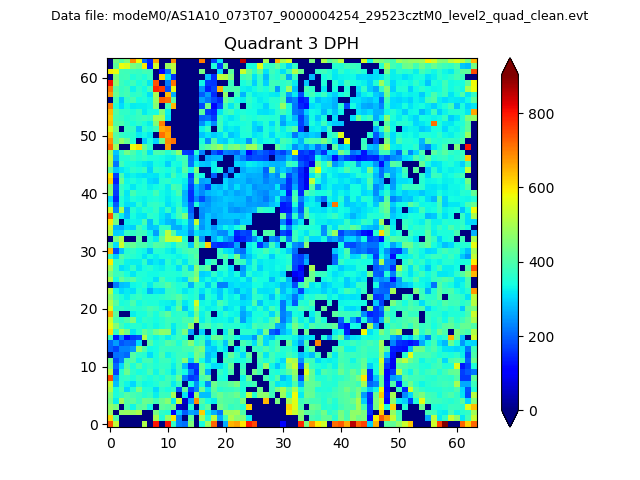 |
 |
Quadrant C |
| Plot type | Count rate plots | Images |
|---|---|---|
| Comparison with Poisson distribution Blue bars denote a histogram of data divided into 1 sec bins. Red curve is a Poisson curve with rate = median count rate of data. |
 |
 |
| Quadrant-wise count rates Data is divided into 100 sec bins |
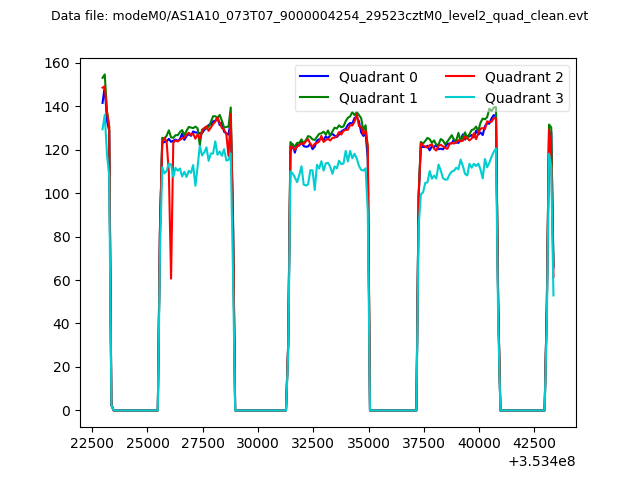 |
|
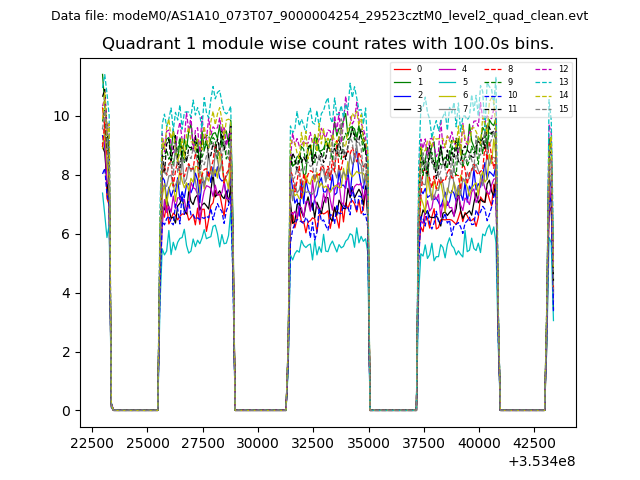
| Module-wise count rates for Quadrant A Data is divided into 100 sec bins |
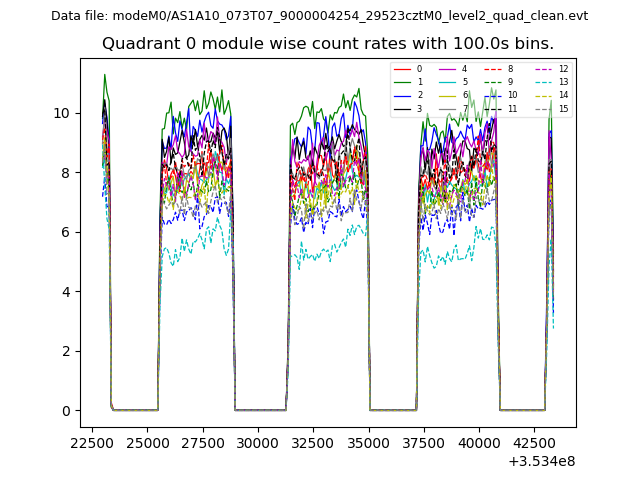 |
 |
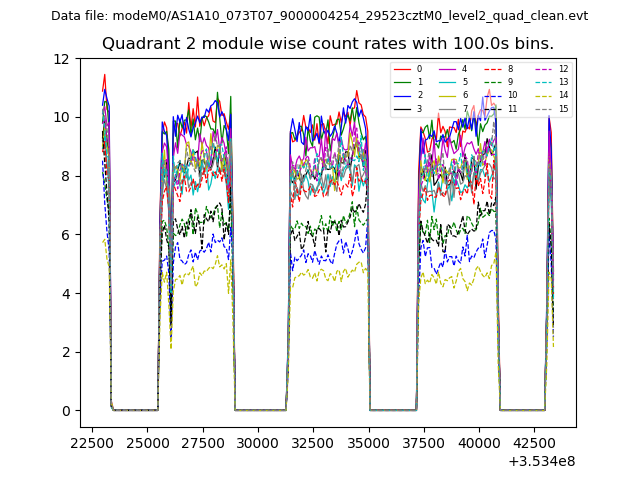
| Module-wise count rates for Quadrant B Data is divided into 100 sec bins |
 |
 |
| Module-wise count rates for Quadrant C Data is divided into 100 sec bins |
 |
 |
| Module-wise count rates for Quadrant D Data is divided into 100 sec bins |
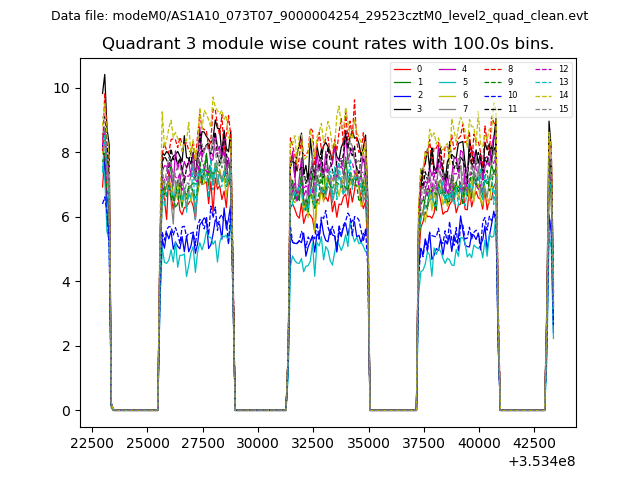 |
 |
| Parameter | Plot |
|---|---|
| CZT HV Monitor | 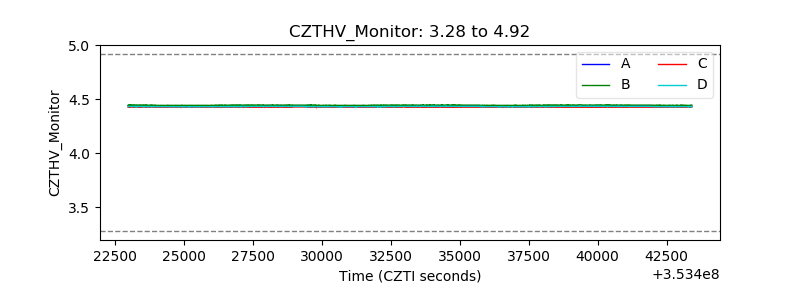 |
| D_VDD | 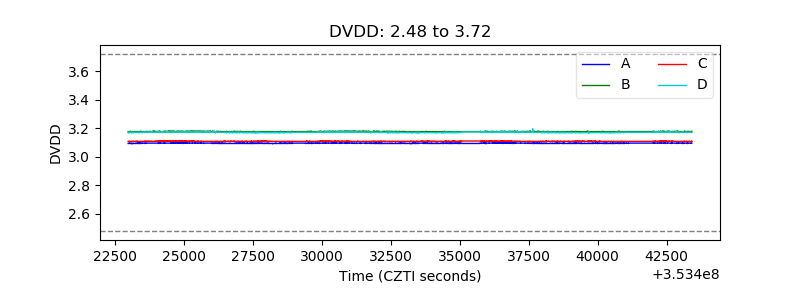 |
| Temperature 1 | 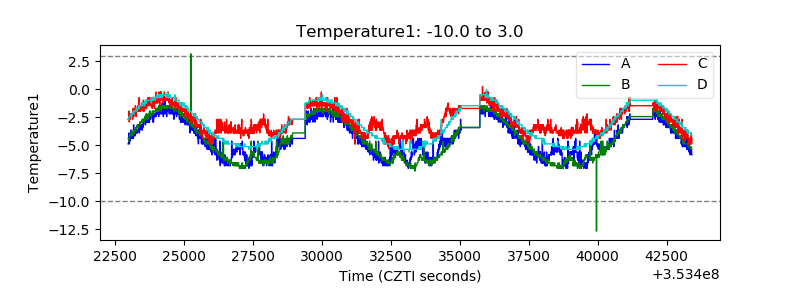 |
| Veto HV Monitor | 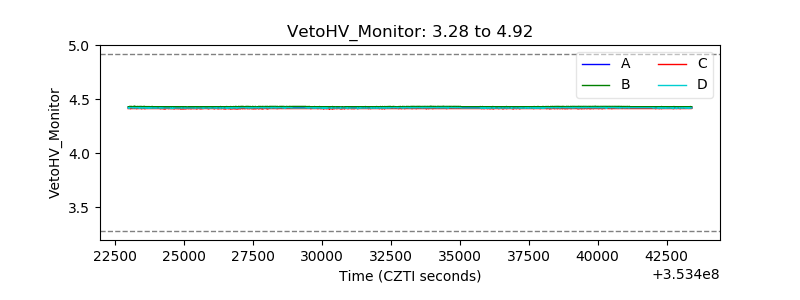 |
| Veto LLD | 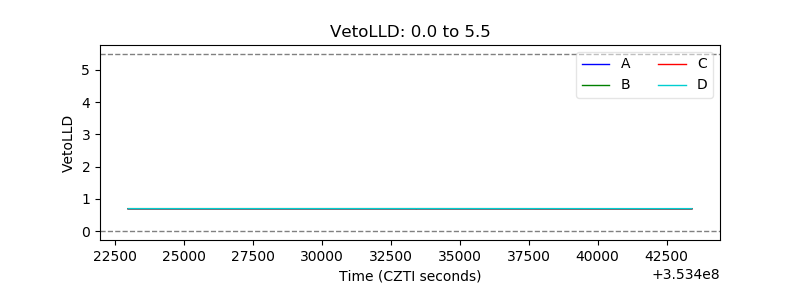 |
| Alpha Counter | 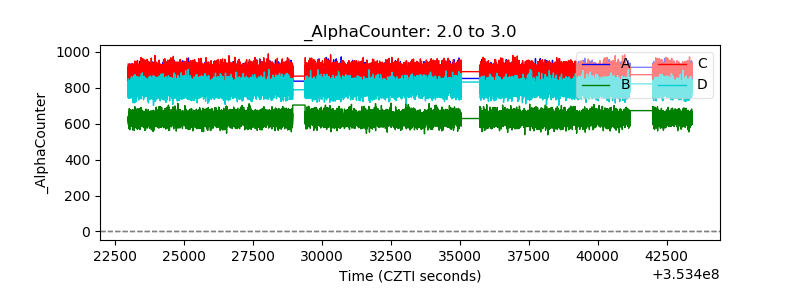 |
| _CPM_Rate | 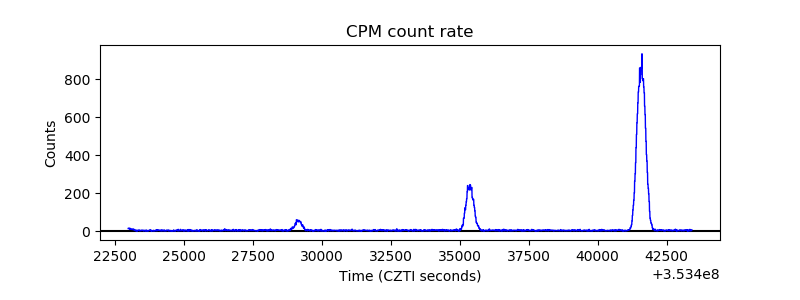 |
| CZT Counter | 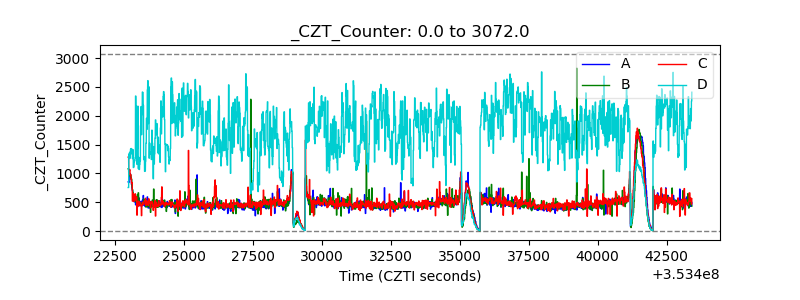 |
| +2.5 Volts monitor |  |
| +5 Volts monitor |  |
| _ROLL_ROT | 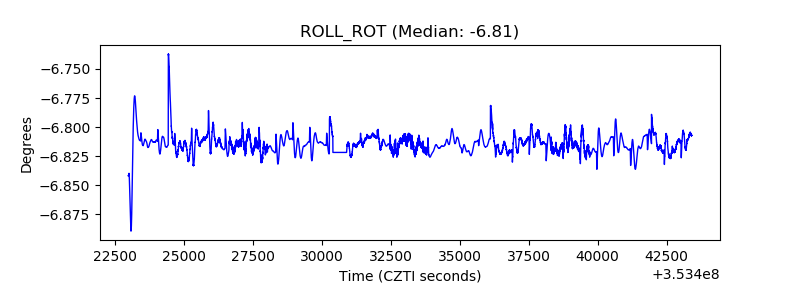 |
| _Roll_DEC | 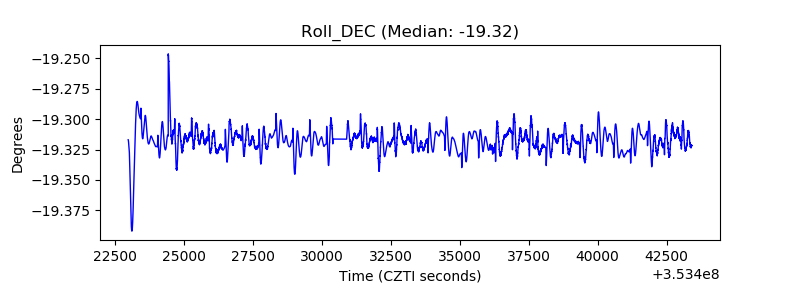 |
| _Roll_RA | 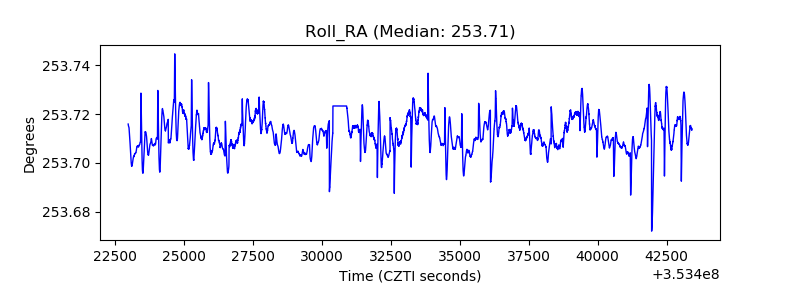 |
| Veto Counter | 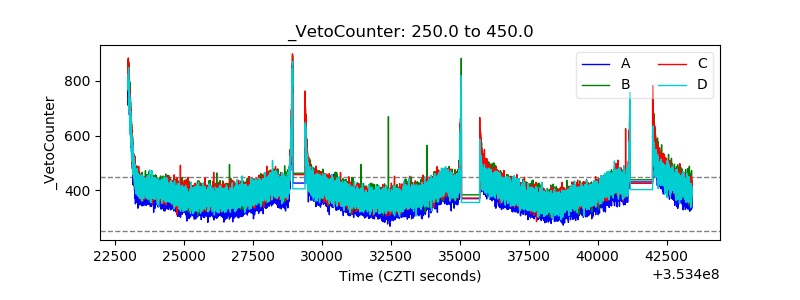 |