| Param | Original file | Final file |
|---|---|---|
| Filename | modeM0/AS1A10_073T07_9000004254_29524cztM0_level2.evt | modeM0/AS1A10_073T07_9000004254_29524cztM0_level2_quad_clean.evt |
| Size (bytes) | 766,978,560 | 86,451,840 |
| Size | 731.4 MB | 82.4 MB |
| Events in quadrant A | 3,324,842 | 551,532 |
| Events in quadrant B | 3,384,530 | 565,261 |
| Events in quadrant C | 3,492,412 | 547,719 |
| Events in quadrant D | 12,567,690 | 479,787 |
| Mode SS | |||
|---|---|---|---|
| Quadrant | BADHDUFLAG | Total packets | Discarded packets |
| A | 0 | 140 | 0 |
| B | 0 | 140 | 0 |
| C | 0 | 140 | 0 |
| D | 0 | 140 | 0 |
| Mode M9 | |||
|---|---|---|---|
| Quadrant | BADHDUFLAG | Total packets | Discarded packets |
| A | 0 | 18 | 0 |
| B | 0 | 18 | 0 |
| C | 0 | 18 | 0 |
| D | 0 | 18 | 0 |
| Mode M0 | |||
|---|---|---|---|
| Quadrant | BADHDUFLAG | Total packets | Discarded packets |
| A | 0 | 14208 | 2 |
| B | 0 | 14359 | 2 |
| C | 0 | 14484 | 2 |
| D | 0 | 42039 | 2 |
| Quadrant | Total seconds | Saturated seconds | Saturation percentage |
|---|---|---|---|
| A | 6789 | 76 | 1.119458% |
| B | 6790 | 98 | 1.443299% |
| C | 6790 | 204 | 3.004418% |
| D | 6790 | 2586 | 38.085420% |
Noise dominated data is calculated using 1-second bins in cleaned event files. If a bin has >2000 counts, and if more than 50% of those come from <1% of pixels, then it is considered to be noise-dominated and hence unusable.
| Quadrant | # 1 sec bins | Bins with >0 counts | Bins with >2000 counts | High rate bins dominated by noise | Noise dominated (total time) | Noise dominated (detector-on time) | Marked lightcurve |
|---|---|---|---|---|---|---|---|
| A | 8599 | 6791 | 0 | 0 | 0.00% | 0.00% | 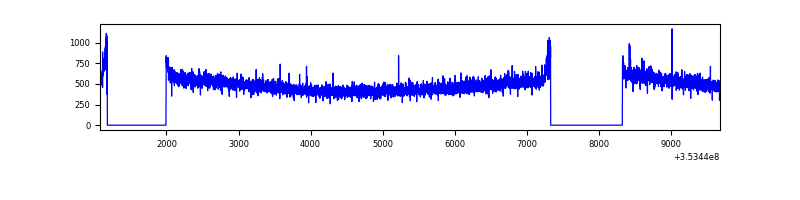 |
| B | 8600 | 6792 | 1 | 1 | 0.01% | 0.01% | 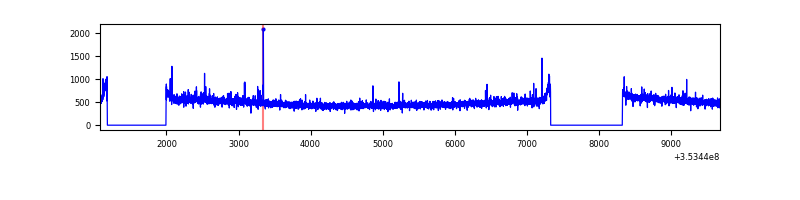 |
| C | 8600 | 6792 | 0 | 0 | 0.00% | 0.00% | 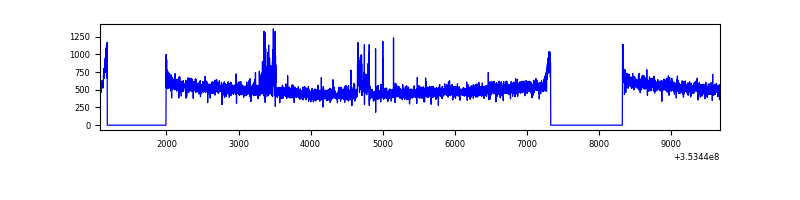 |
| D | 8600 | 6791 | 2952 | 2952 | 34.33% | 43.47% | 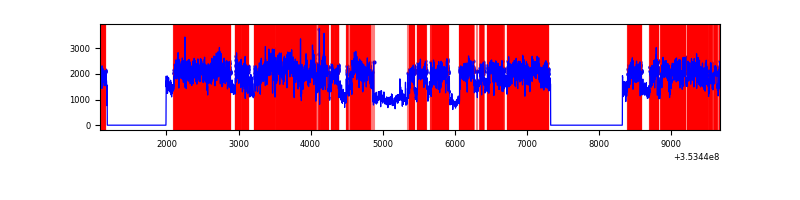 |
Top three noisy pixels from each quadrant. If the there are fewer than three noisy pixels in the level2.evt file, extra rows are filled as -1
| Pixel properties | Quadrant properties | ||||||
|---|---|---|---|---|---|---|---|
| Quadrant | DetID | PixID | Counts | Sigma | Mean | Median | Sigma |
| A | 13 | 254 | 13391 | 71.87 | 859 | 841 | 174.6 |
| A | 3 | 137 | 8922 | 46.28 | 859 | 841 | 174.6 |
| A | 0 | 226 | 7413 | 37.63 | 859 | 841 | 174.6 |
| B | 12 | 111 | 20411 | 116.84 | 854 | 830 | 167.6 |
| B | 0 | 190 | 18627 | 106.2 | 854 | 830 | 167.6 |
| B | 11 | 111 | 18345 | 104.52 | 854 | 830 | 167.6 |
| C | 14 | 238 | 168677 | 864.77 | 825 | 831 | 194.1 |
| C | 14 | 254 | 50736 | 257.12 | 825 | 831 | 194.1 |
| C | 3 | 233 | 38039 | 191.7 | 825 | 831 | 194.1 |
| D | 8 | 195 | 9324944 | 50485.01 | 772 | 752 | 184.7 |
| D | 7 | 223 | 221036 | 1192.71 | 772 | 752 | 184.7 |
| D | 2 | 250 | 27931 | 147.16 | 772 | 752 | 184.7 |
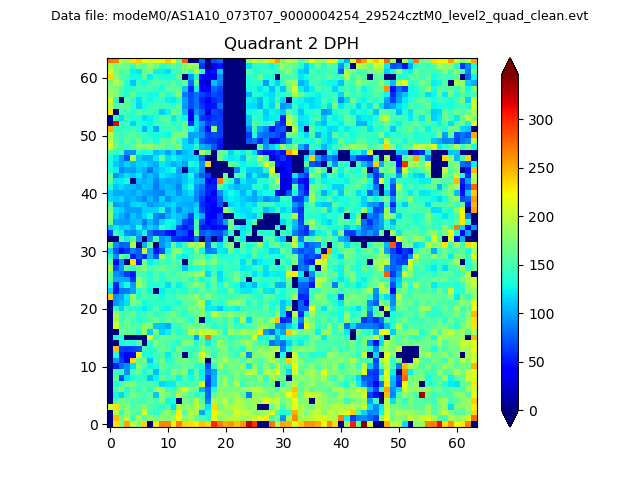
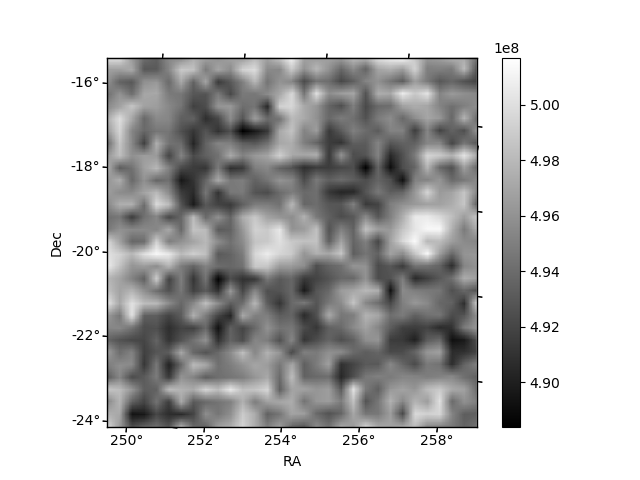
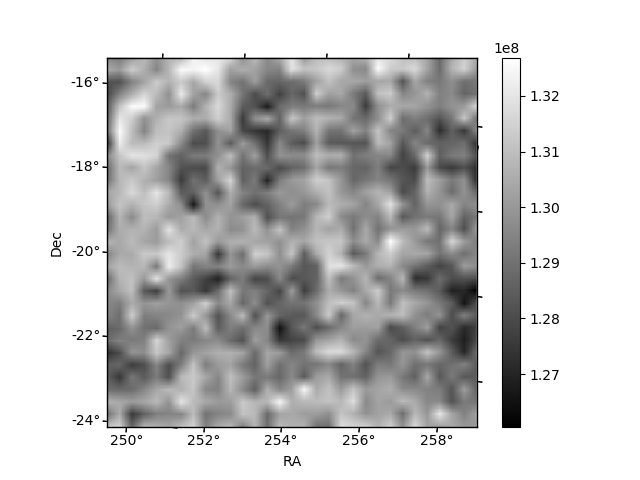
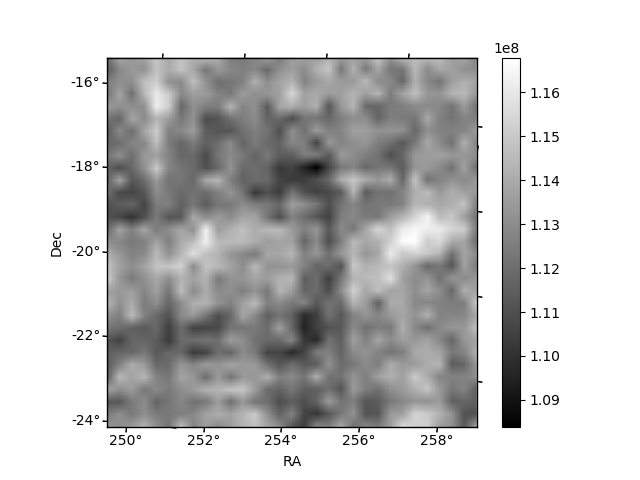
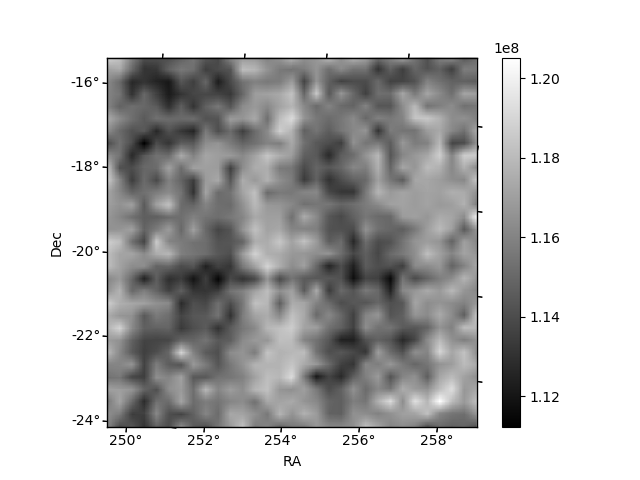
Histogram calculated using DETX and DETY for each event in the final _common_clean file
| Quadrant A | 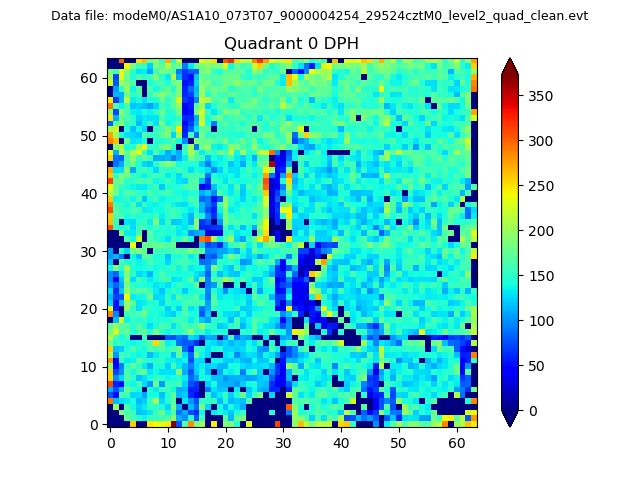 |
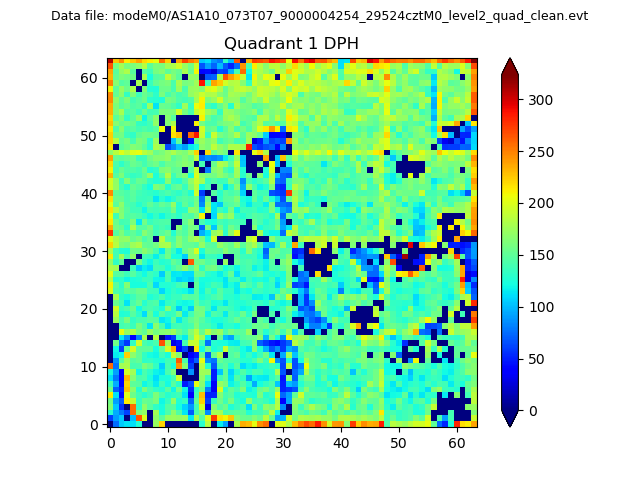 |
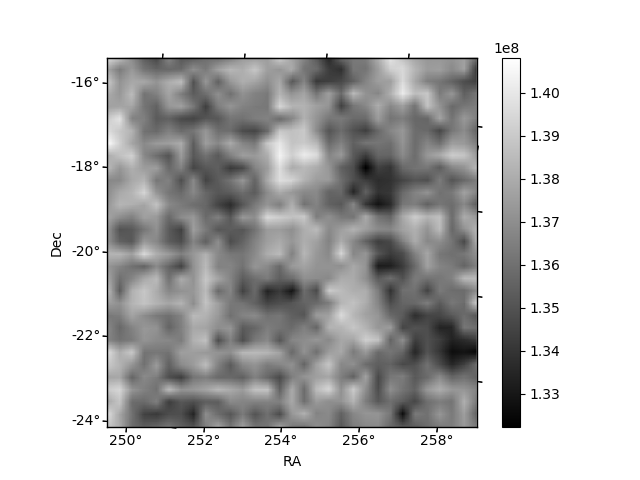
Quadrant B |
|---|---|---|---|
| Quadrant D | 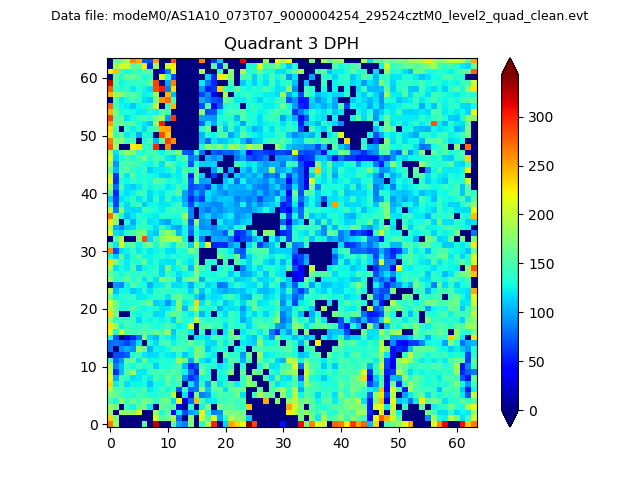 |
 |
Quadrant C |
| Plot type | Count rate plots | Images |
|---|---|---|
| Comparison with Poisson distribution Blue bars denote a histogram of data divided into 1 sec bins. Red curve is a Poisson curve with rate = median count rate of data. |
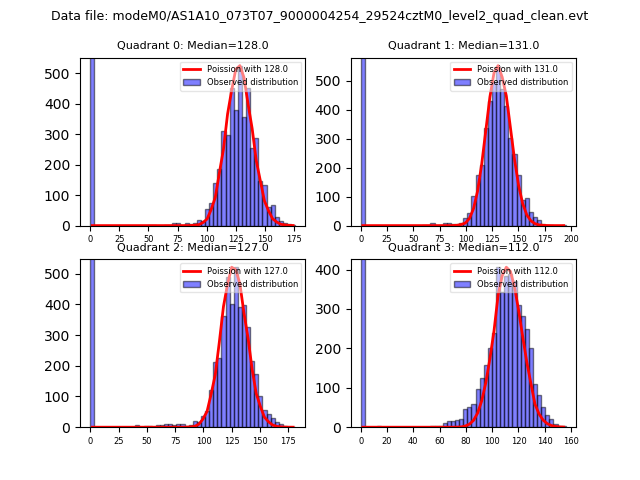 |
 |
| Quadrant-wise count rates Data is divided into 100 sec bins |
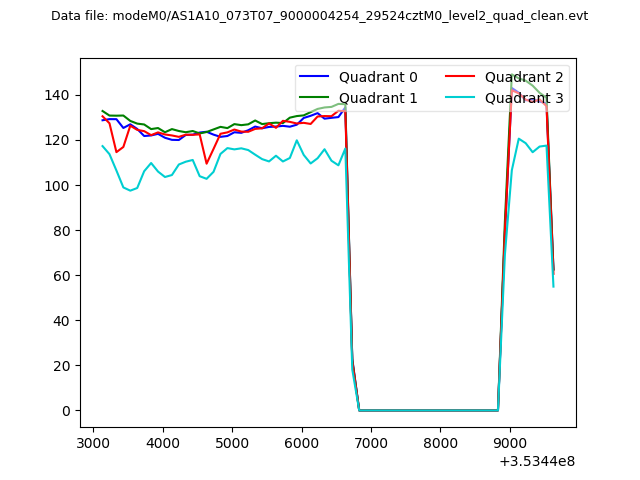 |
|
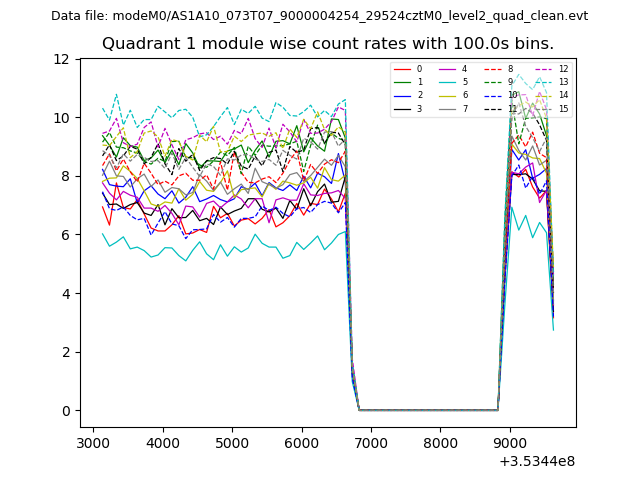
| Module-wise count rates for Quadrant A Data is divided into 100 sec bins |
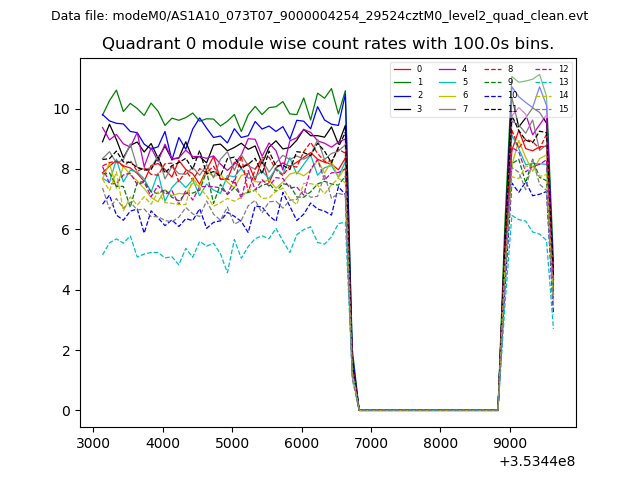 |
 |
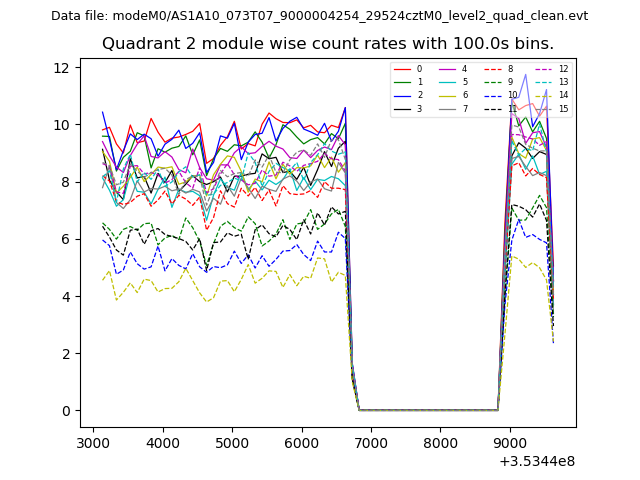
| Module-wise count rates for Quadrant B Data is divided into 100 sec bins |
 |
 |
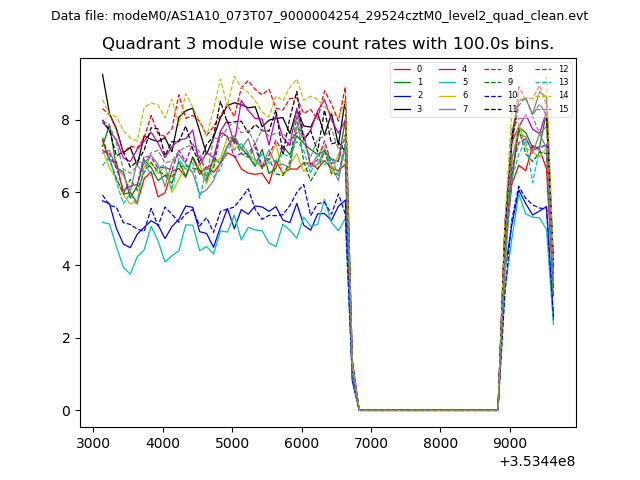
| Module-wise count rates for Quadrant C Data is divided into 100 sec bins |
 |
 |
| Module-wise count rates for Quadrant D Data is divided into 100 sec bins |
 |
 |
| Parameter | Plot |
|---|---|
| CZT HV Monitor | 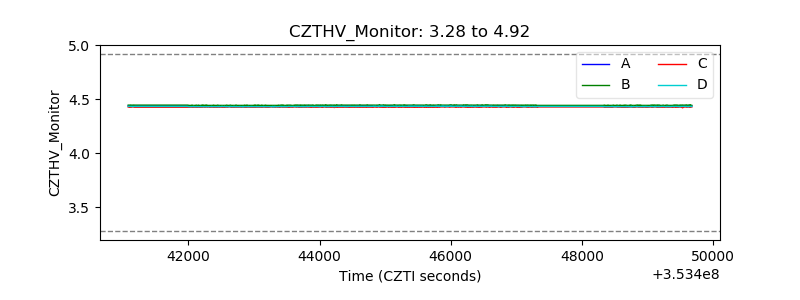 |
| D_VDD | 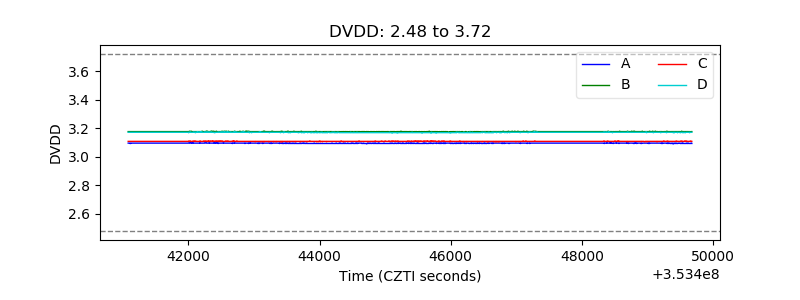 |
| Temperature 1 | 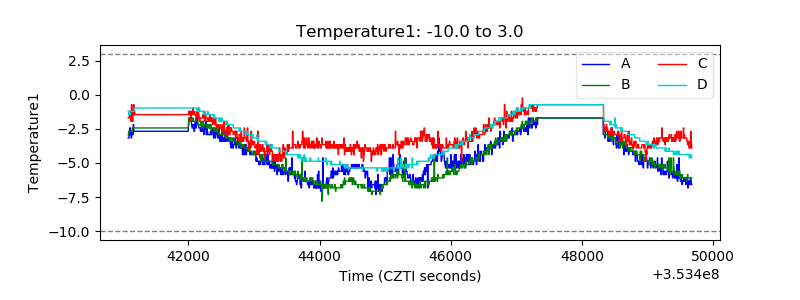 |
| Veto HV Monitor | 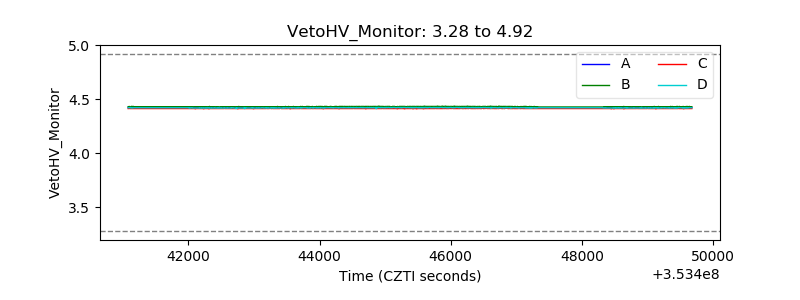 |
| Veto LLD | 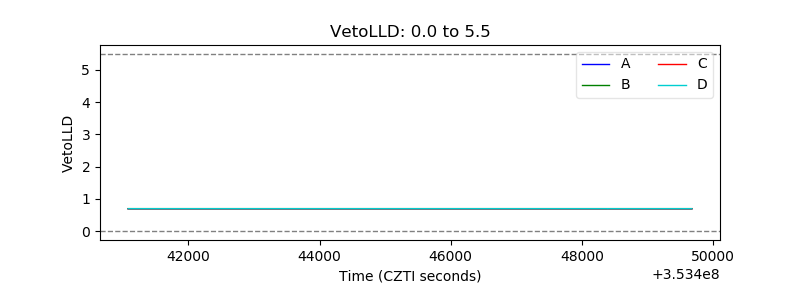 |
| Alpha Counter | 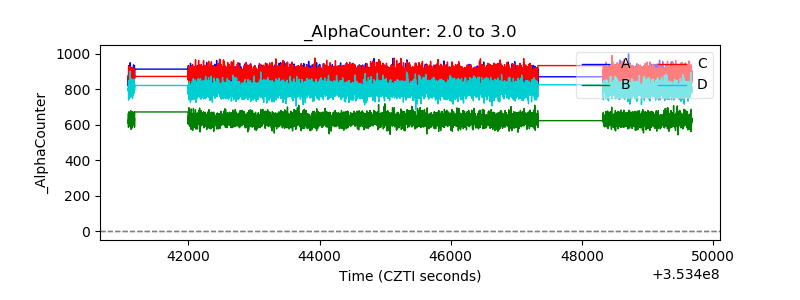 |
| _CPM_Rate | 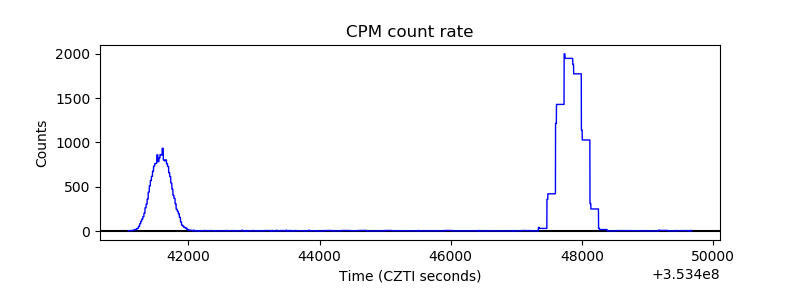 |
| CZT Counter | 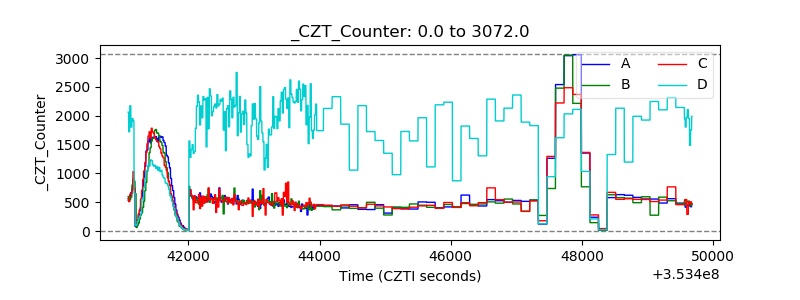 |
| +2.5 Volts monitor |  |
| +5 Volts monitor | 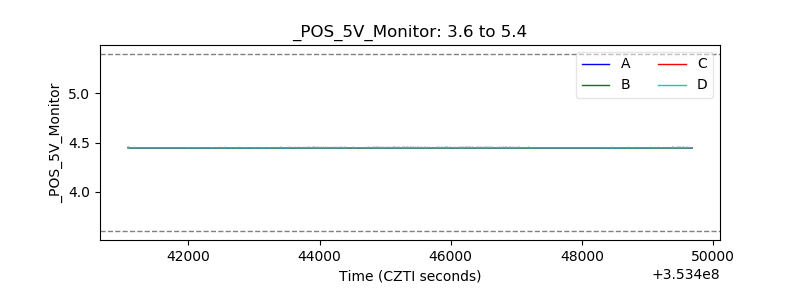 |
| _ROLL_ROT | 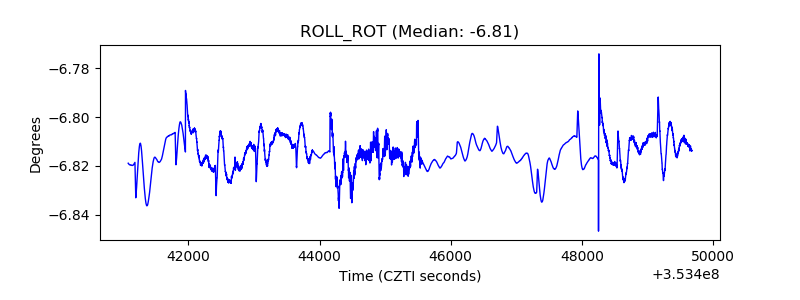 |
| _Roll_DEC | 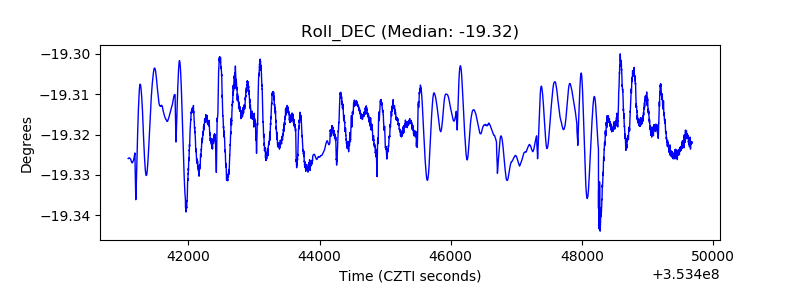 |
| _Roll_RA | 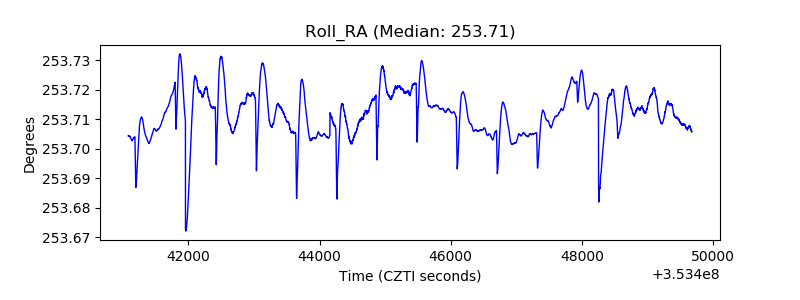 |
| Veto Counter | 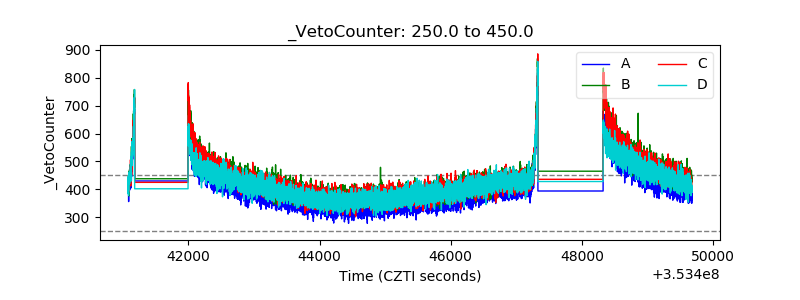 |