| Param | Original file | Final file |
|---|---|---|
| Filename | modeM0/AS1A10_073T07_9000004254_29526cztM0_level2.evt | modeM0/AS1A10_073T07_9000004254_29526cztM0_level2_quad_clean.evt |
| Size (bytes) | 399,242,880 | 60,304,320 |
| Size | 380.7 MB | 57.5 MB |
| Events in quadrant A | 1,779,632 | 406,460 |
| Events in quadrant B | 1,855,434 | 424,692 |
| Events in quadrant C | 1,893,790 | 397,825 |
| Events in quadrant D | 6,319,836 | 344,014 |
| Mode SS | |||
|---|---|---|---|
| Quadrant | BADHDUFLAG | Total packets | Discarded packets |
| A | 0 | 81 | 7 |
| B | 0 | 80 | 8 |
| C | 0 | 80 | 6 |
| D | 0 | 82 | 8 |
| Mode M9 | |||
|---|---|---|---|
| Quadrant | BADHDUFLAG | Total packets | Discarded packets |
| A | 0 | 1 | 0 |
| B | 0 | 3 | 1 |
| C | 0 | 2 | 0 |
| D | 0 | 3 | 1 |
| Mode M0 | |||
|---|---|---|---|
| Quadrant | BADHDUFLAG | Total packets | Discarded packets |
| A | 0 | 8450 | 894 |
| B | 0 | 8712 | 919 |
| C | 0 | 8794 | 957 |
| D | 0 | 23827 | 2629 |
| Quadrant | Total seconds | Saturated seconds | Saturation percentage |
|---|---|---|---|
| A | 3584 | 3 | 0.083705% |
| B | 3590 | 12 | 0.334262% |
| C | 3576 | 151 | 4.222595% |
| D | 3496 | 863 | 24.685355% |
Noise dominated data is calculated using 1-second bins in cleaned event files. If a bin has >2000 counts, and if more than 50% of those come from <1% of pixels, then it is considered to be noise-dominated and hence unusable.
| Quadrant | # 1 sec bins | Bins with >0 counts | Bins with >2000 counts | High rate bins dominated by noise | Noise dominated (total time) | Noise dominated (detector-on time) | Marked lightcurve |
|---|---|---|---|---|---|---|---|
| A | 7589 | 3652 | 0 | 0 | 0.00% | 0.00% | 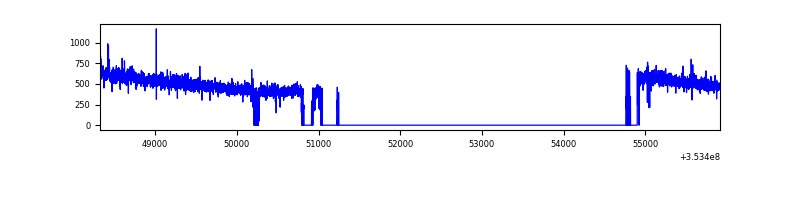 |
| B | 7589 | 3664 | 1 | 1 | 0.01% | 0.03% | 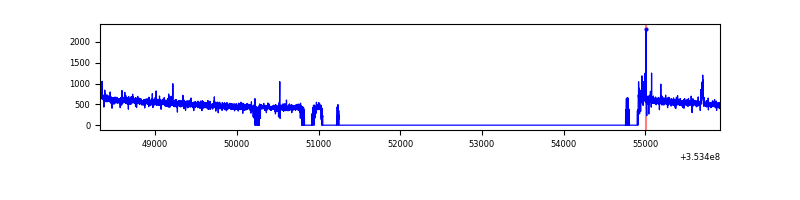 |
| C | 7589 | 3654 | 0 | 0 | 0.00% | 0.00% | 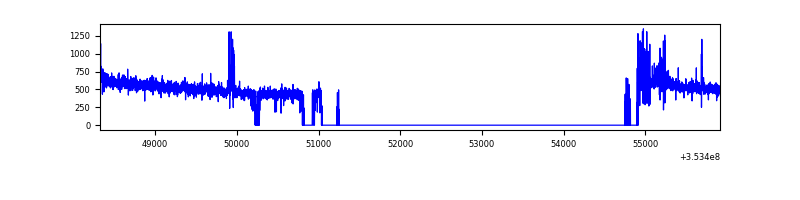 |
| D | 7589 | 3556 | 1210 | 1210 | 15.94% | 34.03% | 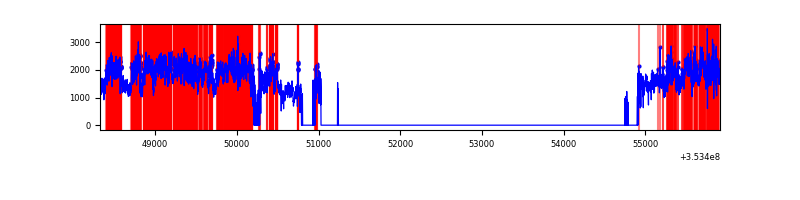 |
Top three noisy pixels from each quadrant. If the there are fewer than three noisy pixels in the level2.evt file, extra rows are filled as -1
| Pixel properties | Quadrant properties | ||||||
|---|---|---|---|---|---|---|---|
| Quadrant | DetID | PixID | Counts | Sigma | Mean | Median | Sigma |
| A | 13 | 254 | 7006 | 69.74 | 459 | 450 | 94.0 |
| A | 0 | 13 | 6135 | 60.48 | 459 | 450 | 94.0 |
| A | 3 | 137 | 4636 | 44.53 | 459 | 450 | 94.0 |
| B | 5 | 255 | 11286 | 121.47 | 466 | 456 | 89.2 |
| B | 12 | 111 | 10871 | 116.81 | 466 | 456 | 89.2 |
| B | 0 | 190 | 9688 | 103.54 | 466 | 456 | 89.2 |
| C | 14 | 238 | 102179 | 969.93 | 441 | 444 | 104.9 |
| C | 14 | 254 | 42761 | 403.44 | 441 | 444 | 104.9 |
| C | 3 | 233 | 19091 | 177.78 | 441 | 444 | 104.9 |
| D | 8 | 195 | 4584382 | 45602.14 | 412 | 401 | 100.5 |
| D | 2 | 250 | 63051 | 623.25 | 412 | 401 | 100.5 |
| D | 7 | 223 | 58943 | 582.38 | 412 | 401 | 100.5 |
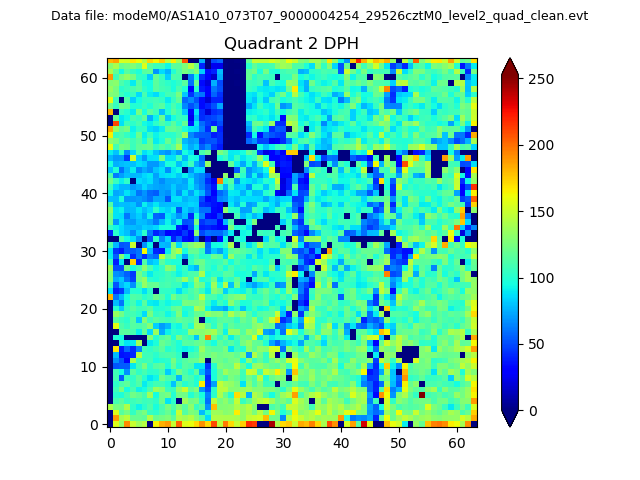
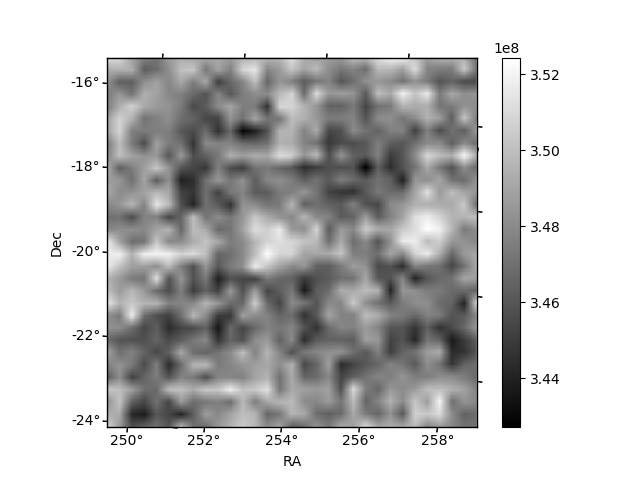
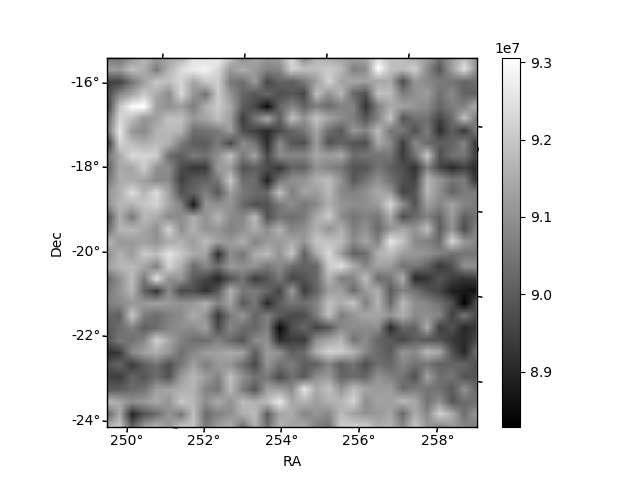
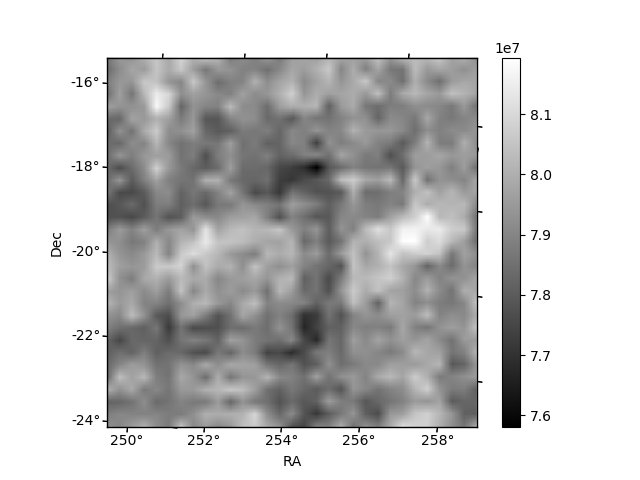
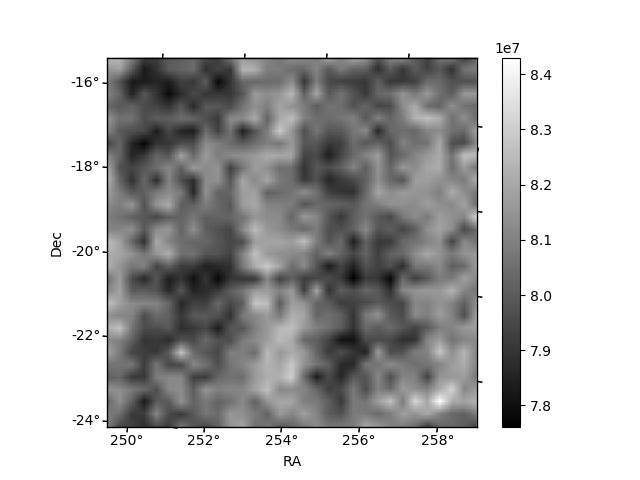
Histogram calculated using DETX and DETY for each event in the final _common_clean file
| Quadrant A | 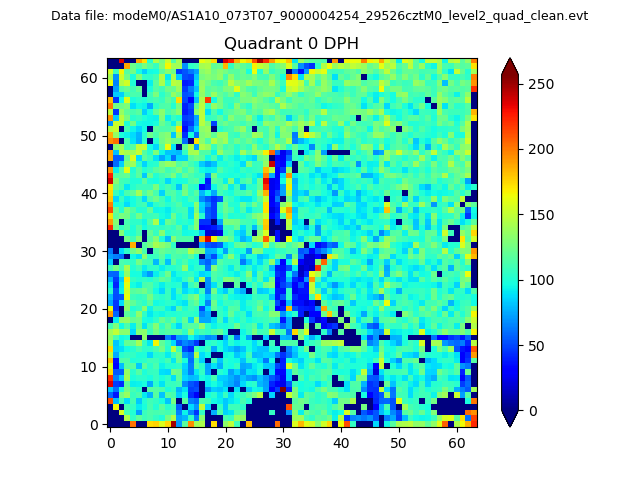 |
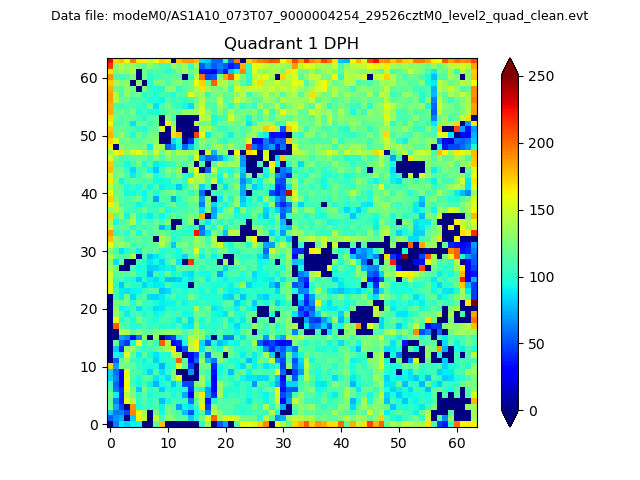 |
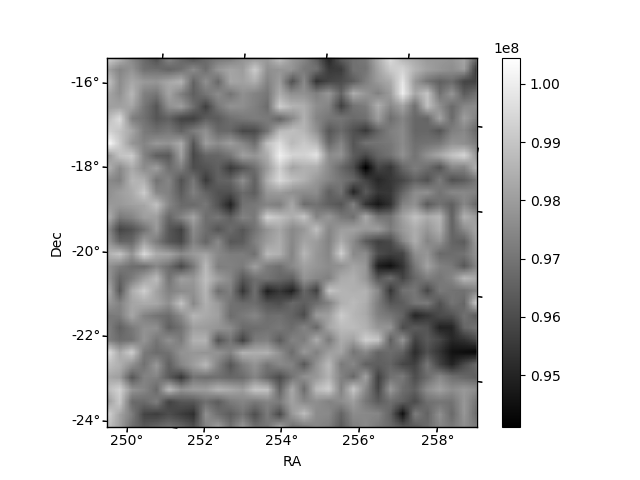
Quadrant B |
|---|---|---|---|
| Quadrant D | 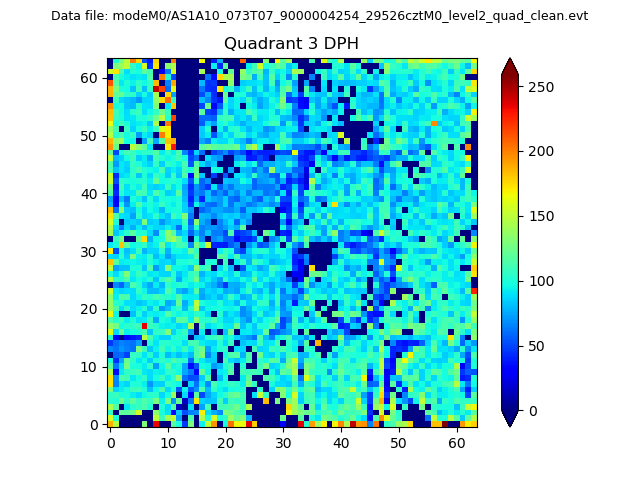 |
 |
Quadrant C |
| Plot type | Count rate plots | Images |
|---|---|---|
| Comparison with Poisson distribution Blue bars denote a histogram of data divided into 1 sec bins. Red curve is a Poisson curve with rate = median count rate of data. |
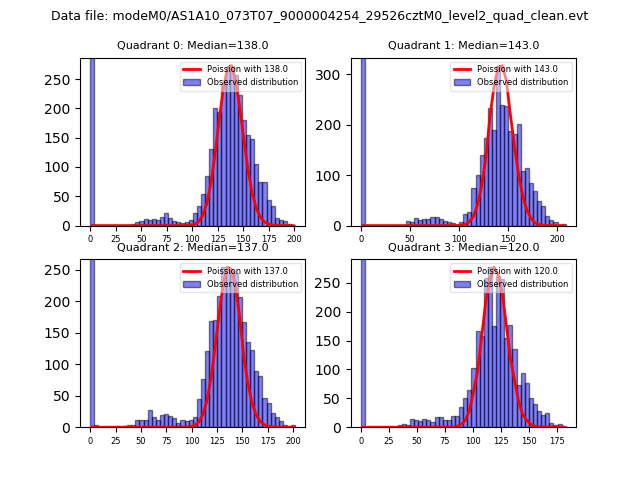 |
 |
| Quadrant-wise count rates Data is divided into 100 sec bins |
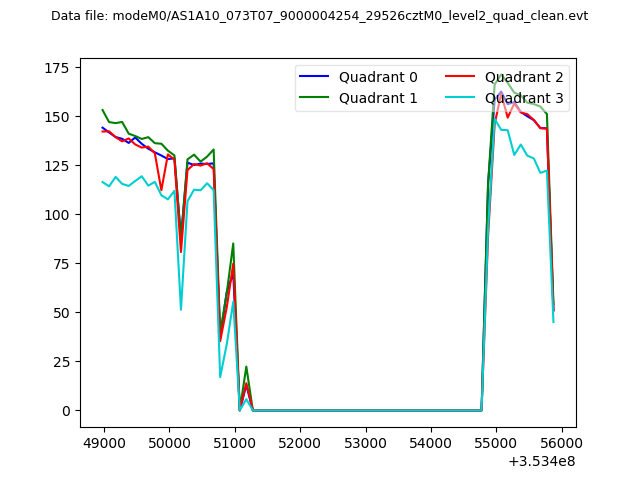 |
|
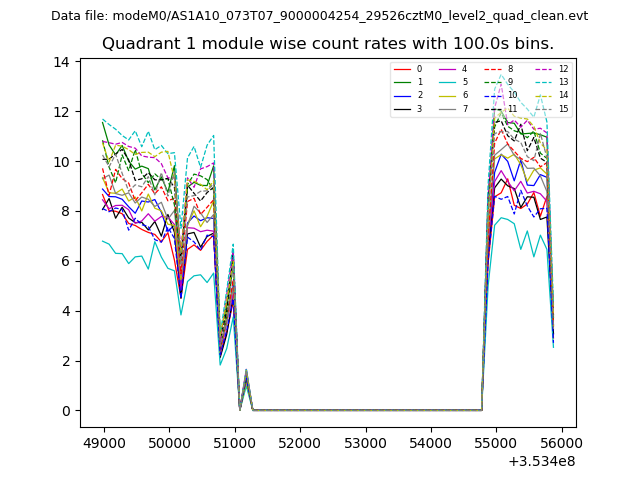
| Module-wise count rates for Quadrant A Data is divided into 100 sec bins |
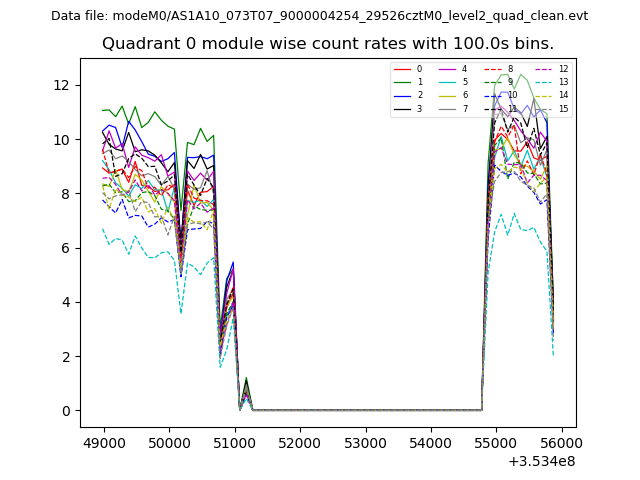 |
 |
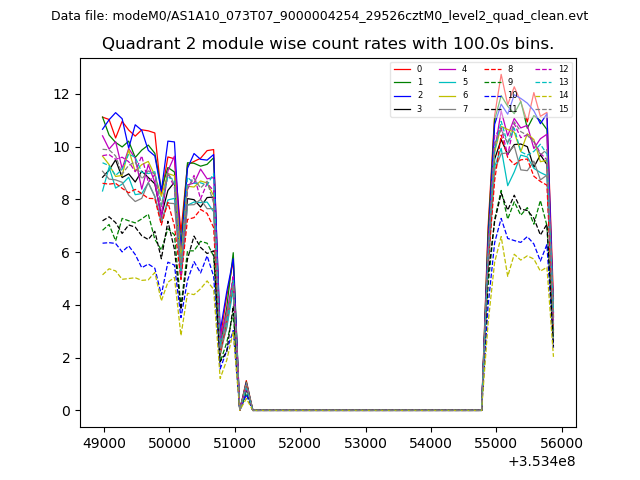
| Module-wise count rates for Quadrant B Data is divided into 100 sec bins |
 |
 |
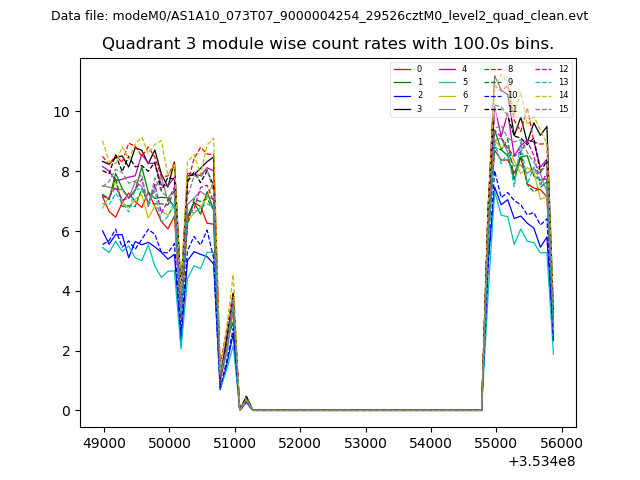
| Module-wise count rates for Quadrant C Data is divided into 100 sec bins |
 |
 |
| Module-wise count rates for Quadrant D Data is divided into 100 sec bins |
 |
 |
| Parameter | Plot |
|---|---|
| CZT HV Monitor | 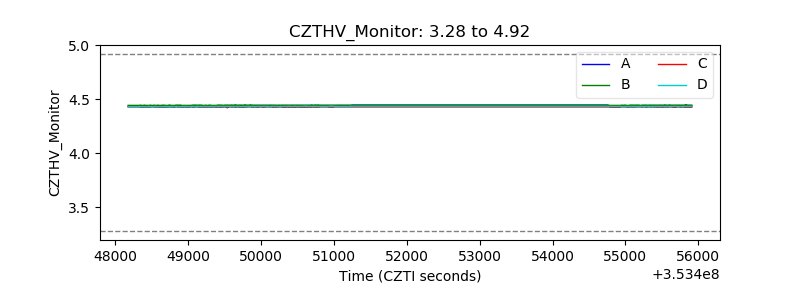 |
| D_VDD | 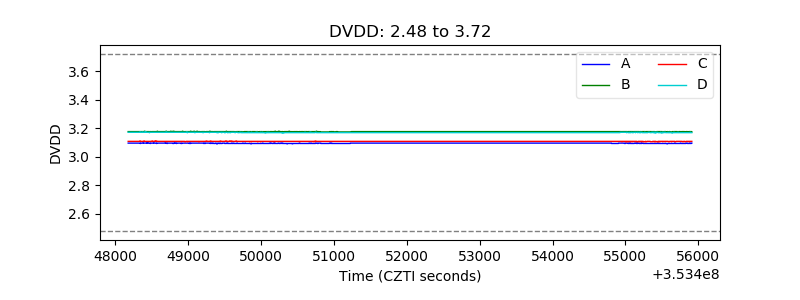 |
| Temperature 1 |  |
| Veto HV Monitor | 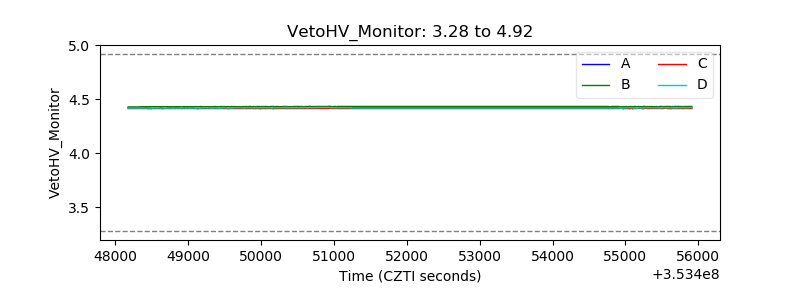 |
| Veto LLD | 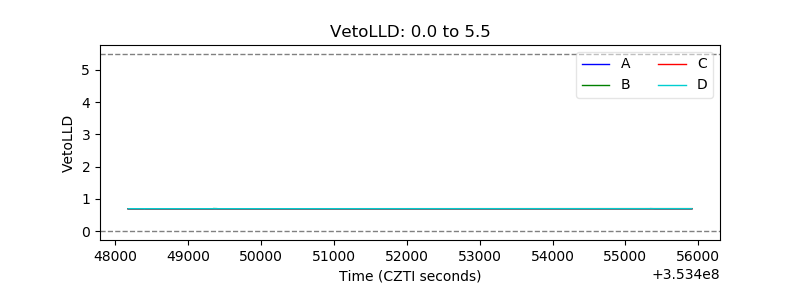 |
| Alpha Counter | 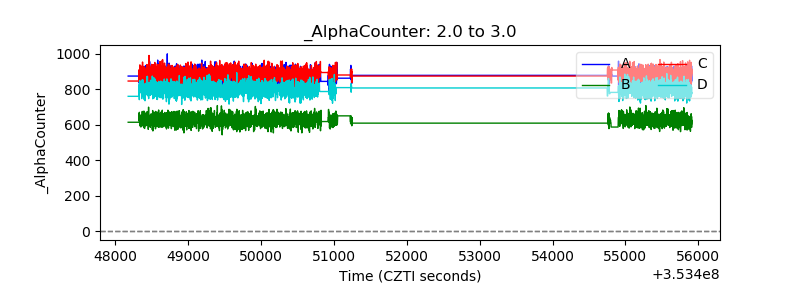 |
| _CPM_Rate | 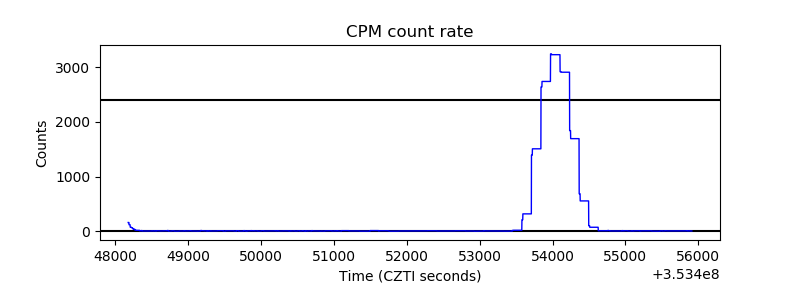 |
| CZT Counter | 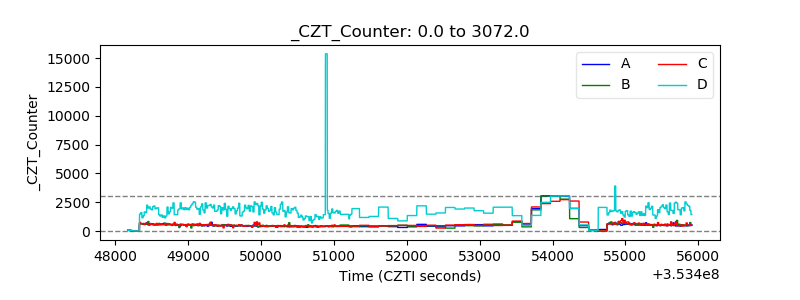 |
| +2.5 Volts monitor |  |
| +5 Volts monitor |  |
| _ROLL_ROT | 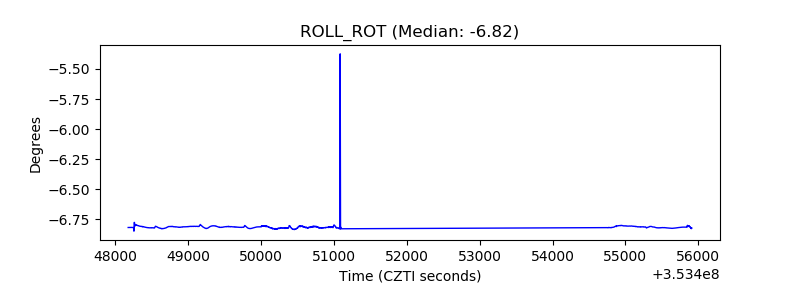 |
| _Roll_DEC | 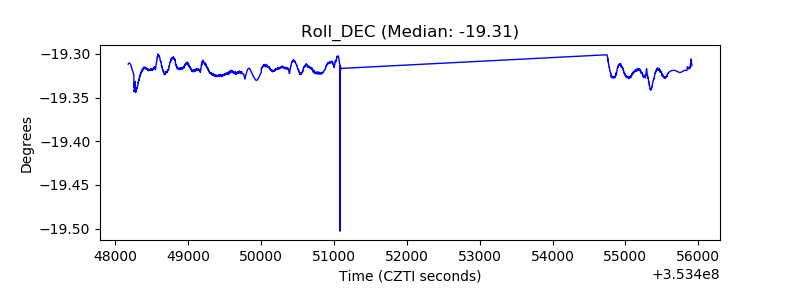 |
| _Roll_RA | 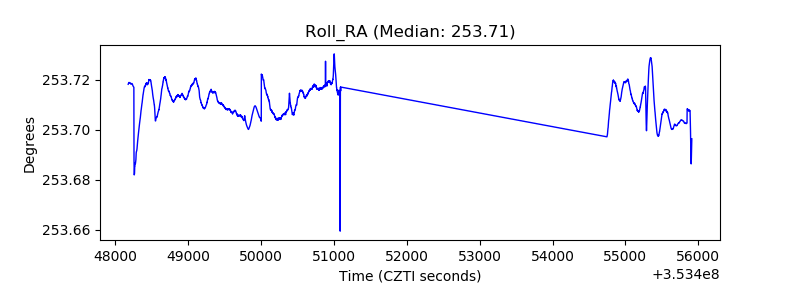 |
| Veto Counter | 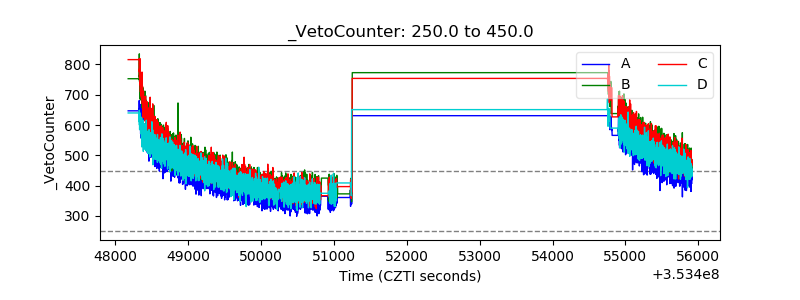 |