| Param | Original file | Final file |
|---|---|---|
| Filename | modeM0/AS1A10_073T07_9000004254_29527cztM0_level2.evt | modeM0/AS1A10_073T07_9000004254_29527cztM0_level2_quad_clean.evt |
| Size (bytes) | 1,152,869,760 | 175,106,880 |
| Size | 1.1 GB | 167.0 MB |
| Events in quadrant A | 5,302,431 | 1,166,866 |
| Events in quadrant B | 5,525,291 | 1,214,191 |
| Events in quadrant C | 5,438,244 | 1,168,343 |
| Events in quadrant D | 17,941,002 | 1,024,931 |
| Mode SS | |||
|---|---|---|---|
| Quadrant | BADHDUFLAG | Total packets | Discarded packets |
| A | 0 | 216 | 0 |
| B | 0 | 216 | 0 |
| C | 0 | 216 | 0 |
| D | 0 | 216 | 0 |
| Mode M9 | |||
|---|---|---|---|
| Quadrant | BADHDUFLAG | Total packets | Discarded packets |
| A | 0 | 24 | 0 |
| B | 0 | 24 | 0 |
| C | 0 | 24 | 0 |
| D | 0 | 24 | 0 |
| Mode M0 | |||
|---|---|---|---|
| Quadrant | BADHDUFLAG | Total packets | Discarded packets |
| A | 0 | 22536 | 2 |
| B | 0 | 23196 | 2 |
| C | 0 | 22657 | 2 |
| D | 0 | 60646 | 11 |
| Quadrant | Total seconds | Saturated seconds | Saturation percentage |
|---|---|---|---|
| A | 10521 | 84 | 0.798403% |
| B | 10522 | 108 | 1.026421% |
| C | 10522 | 254 | 2.413990% |
| D | 10520 | 2306 | 21.920152% |
Noise dominated data is calculated using 1-second bins in cleaned event files. If a bin has >2000 counts, and if more than 50% of those come from <1% of pixels, then it is considered to be noise-dominated and hence unusable.
| Quadrant | # 1 sec bins | Bins with >0 counts | Bins with >2000 counts | High rate bins dominated by noise | Noise dominated (total time) | Noise dominated (detector-on time) | Marked lightcurve |
|---|---|---|---|---|---|---|---|
| A | 12931 | 10523 | 26 | 26 | 0.20% | 0.25% | 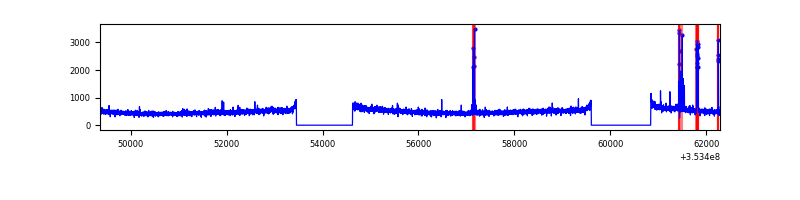 |
| B | 12932 | 10524 | 17 | 17 | 0.13% | 0.16% | 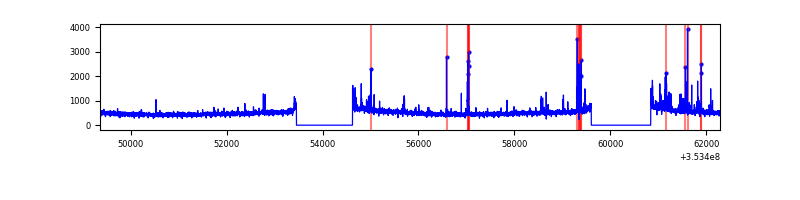 |
| C | 12932 | 10524 | 0 | 0 | 0.00% | 0.00% | 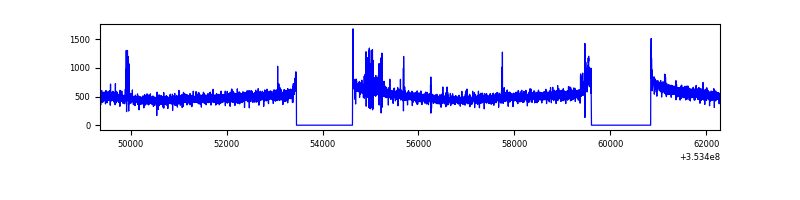 |
| D | 12931 | 10523 | 2754 | 2754 | 21.30% | 26.17% |  |
Top three noisy pixels from each quadrant. If the there are fewer than three noisy pixels in the level2.evt file, extra rows are filled as -1
| Pixel properties | Quadrant properties | ||||||
|---|---|---|---|---|---|---|---|
| Quadrant | DetID | PixID | Counts | Sigma | Mean | Median | Sigma |
| A | 0 | 13 | 164440 | 610.06 | 1331 | 1306 | 267.4 |
| A | 13 | 254 | 19548 | 68.22 | 1331 | 1306 | 267.4 |
| A | 3 | 137 | 12531 | 41.98 | 1331 | 1306 | 267.4 |
| B | 5 | 255 | 145465 | 567.76 | 1338 | 1305 | 253.9 |
| B | 10 | 245 | 77521 | 300.17 | 1338 | 1305 | 253.9 |
| B | 0 | 190 | 33689 | 127.54 | 1338 | 1305 | 253.9 |
| C | 14 | 238 | 244573 | 810.0 | 1296 | 1311 | 300.3 |
| C | 3 | 233 | 54057 | 175.63 | 1296 | 1311 | 300.3 |
| C | 14 | 254 | 52929 | 171.88 | 1296 | 1311 | 300.3 |
| D | 8 | 195 | 12477477 | 42746.68 | 1232 | 1204 | 291.9 |
| D | 7 | 238 | 251935 | 859.06 | 1232 | 1204 | 291.9 |
| D | 7 | 223 | 246723 | 841.2 | 1232 | 1204 | 291.9 |
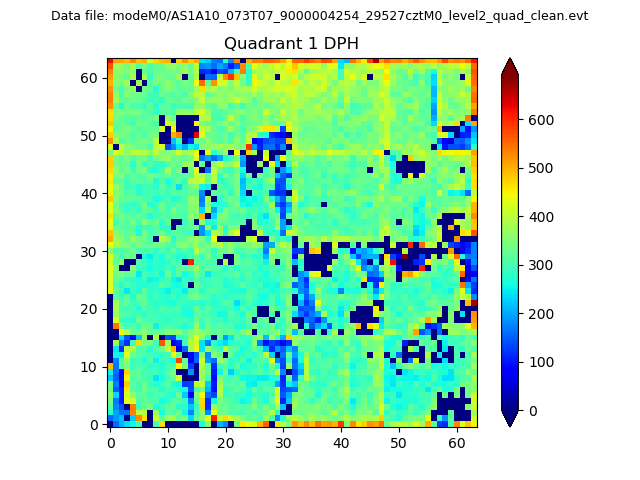
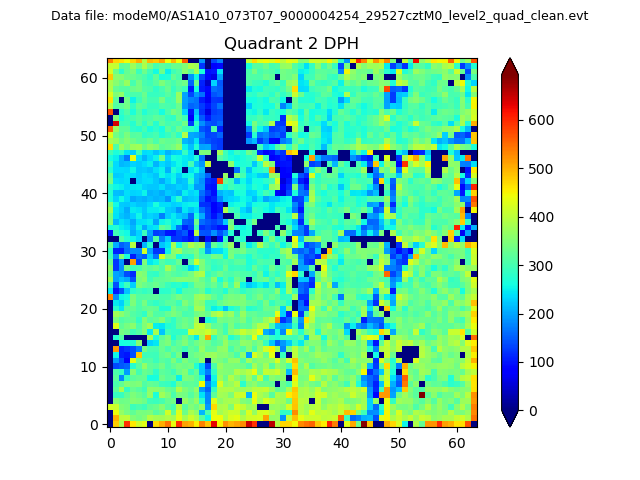
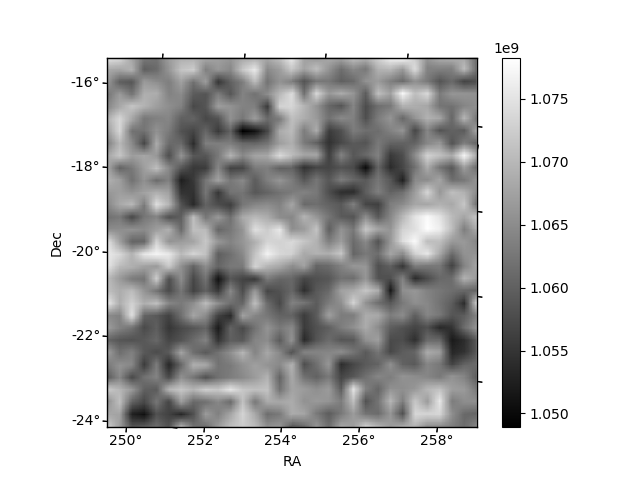
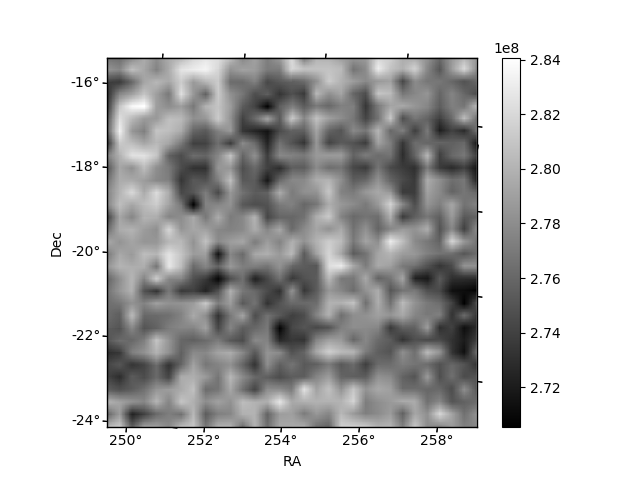
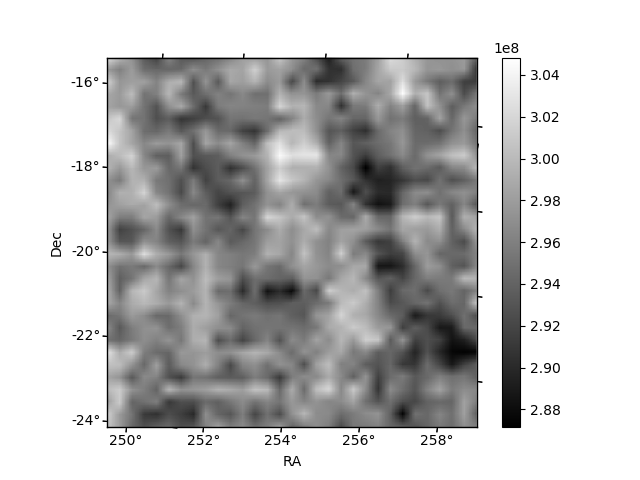
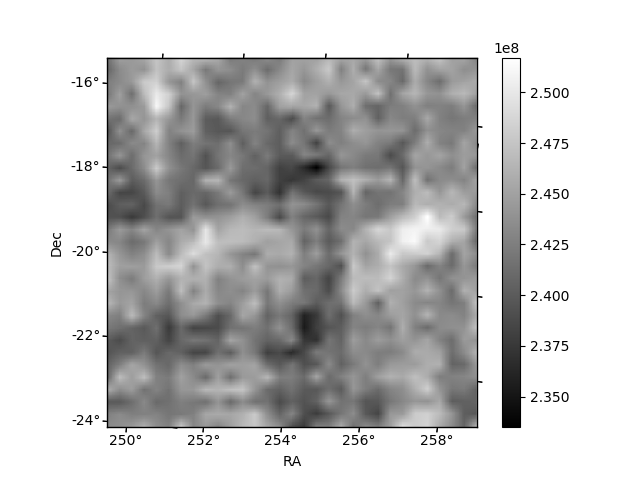
Histogram calculated using DETX and DETY for each event in the final _common_clean file
| Quadrant A | 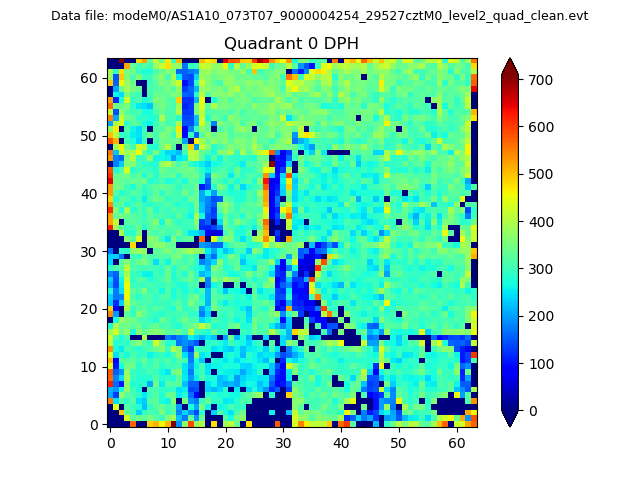 |
 |
Quadrant B |
|---|---|---|---|
| Quadrant D | 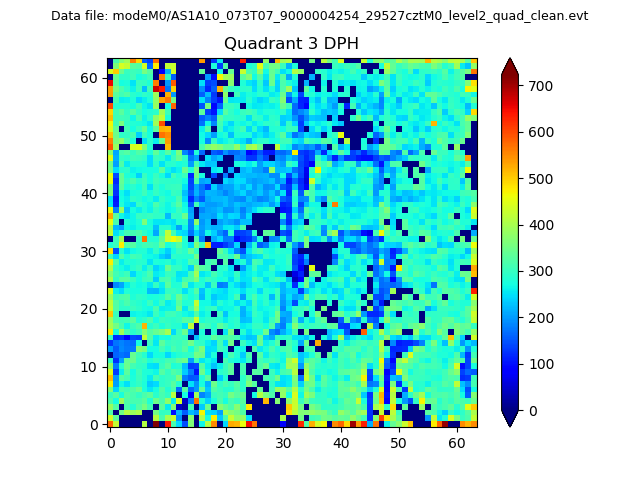 |
 |
Quadrant C |
| Plot type | Count rate plots | Images |
|---|---|---|
| Comparison with Poisson distribution Blue bars denote a histogram of data divided into 1 sec bins. Red curve is a Poisson curve with rate = median count rate of data. |
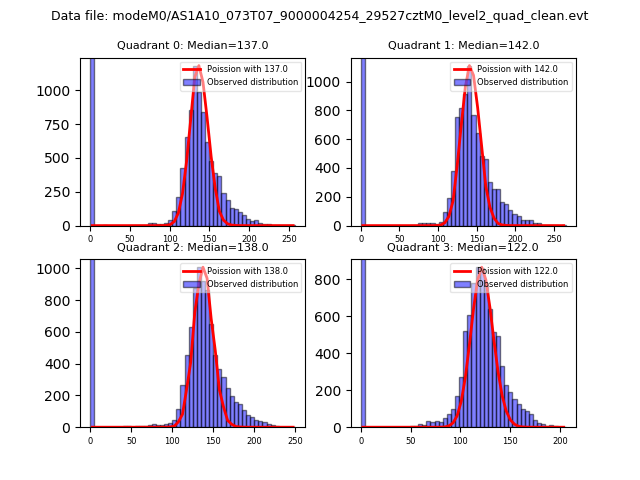 |
 |
| Quadrant-wise count rates Data is divided into 100 sec bins |
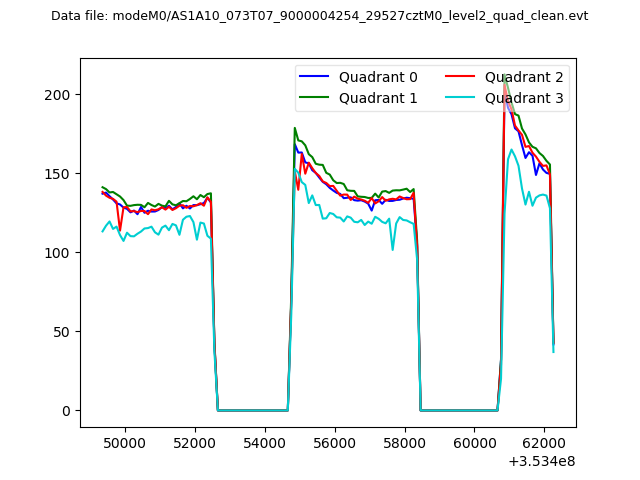 |
|
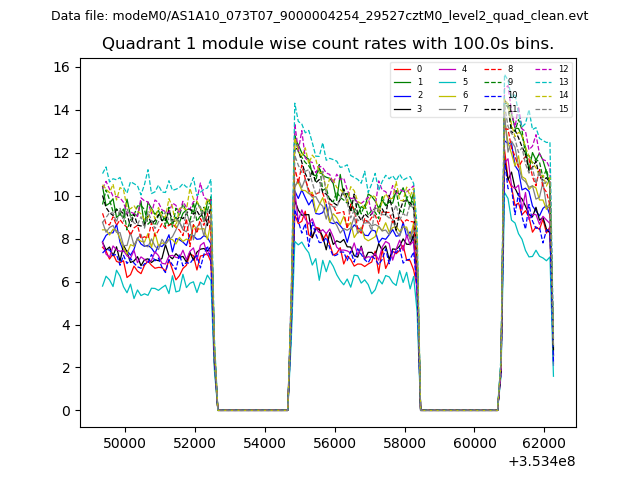
| Module-wise count rates for Quadrant A Data is divided into 100 sec bins |
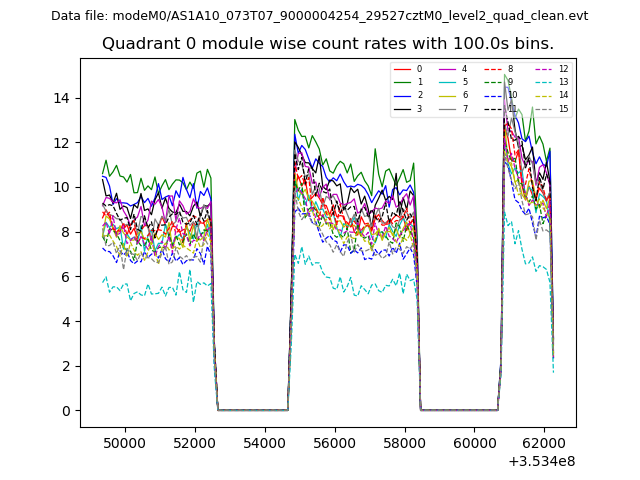 |
 |
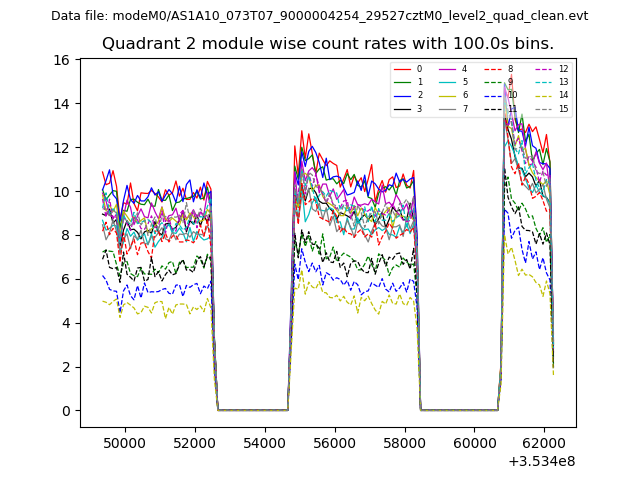
| Module-wise count rates for Quadrant B Data is divided into 100 sec bins |
 |
 |
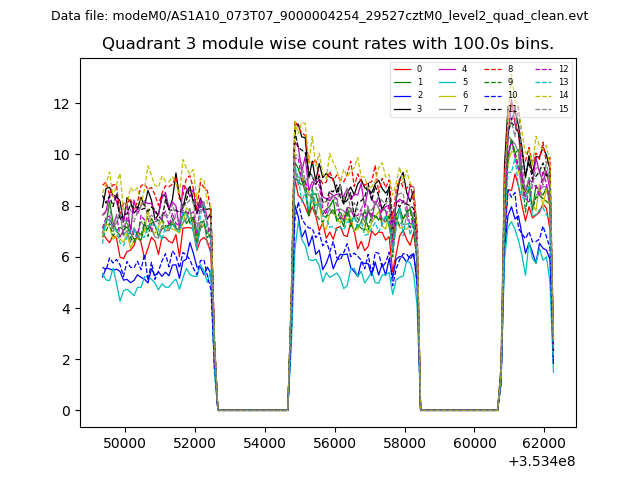
| Module-wise count rates for Quadrant C Data is divided into 100 sec bins |
 |
 |
| Module-wise count rates for Quadrant D Data is divided into 100 sec bins |
 |
 |
| Parameter | Plot |
|---|---|
| CZT HV Monitor | 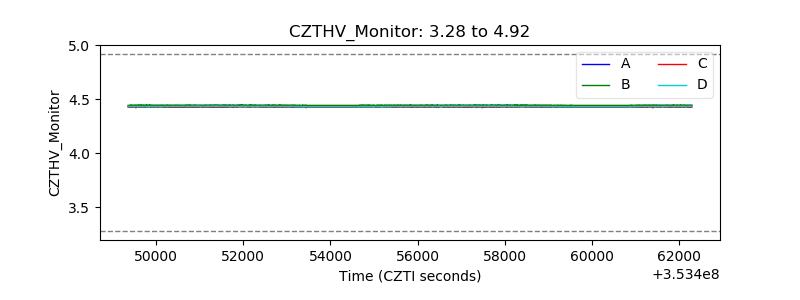 |
| D_VDD | 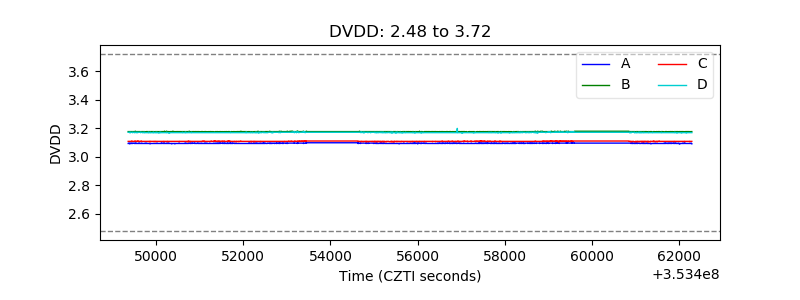 |
| Temperature 1 |  |
| Veto HV Monitor | 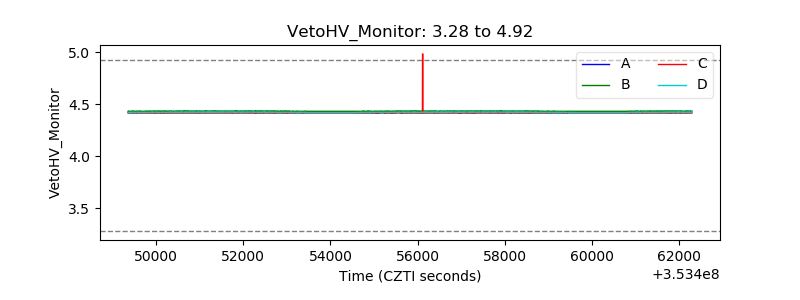 |
| Veto LLD | 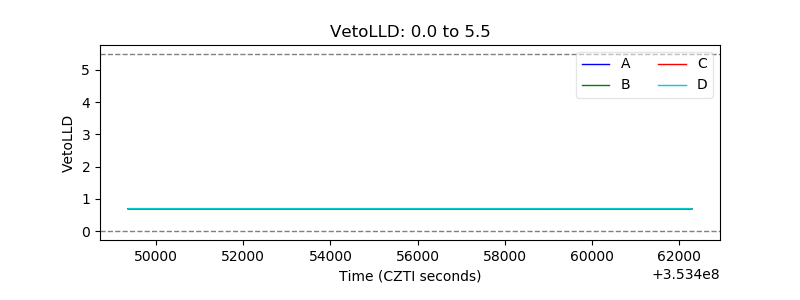 |
| Alpha Counter | 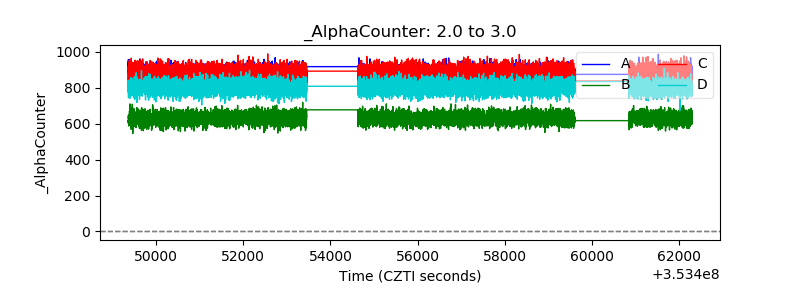 |
| _CPM_Rate | 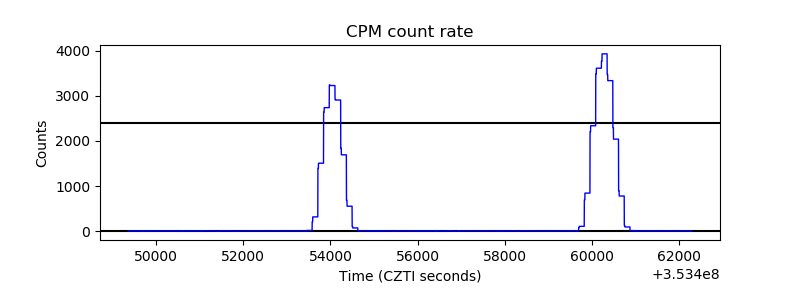 |
| CZT Counter | 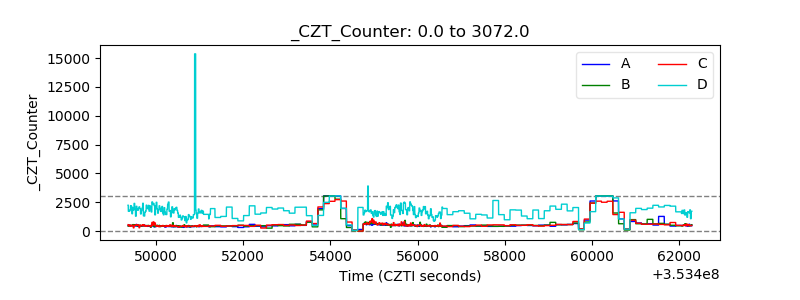 |
| +2.5 Volts monitor |  |
| +5 Volts monitor |  |
| _ROLL_ROT | 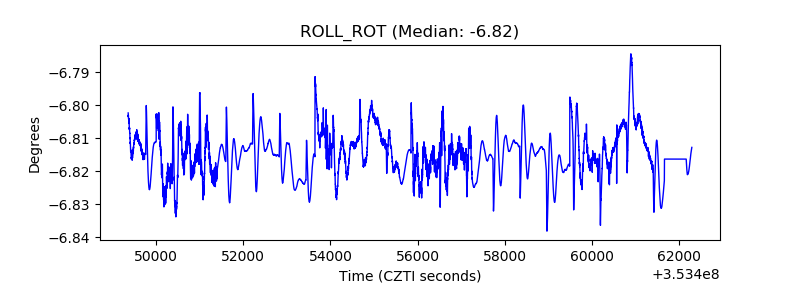 |
| _Roll_DEC | 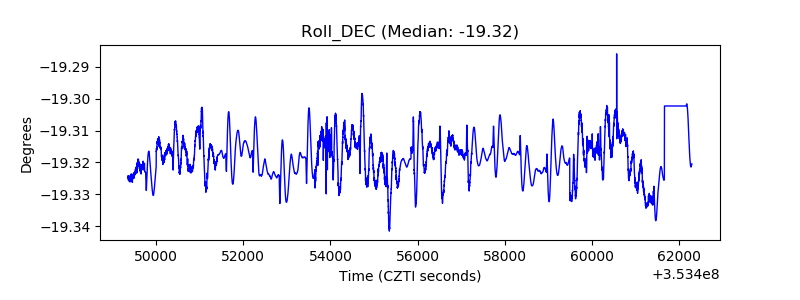 |
| _Roll_RA | 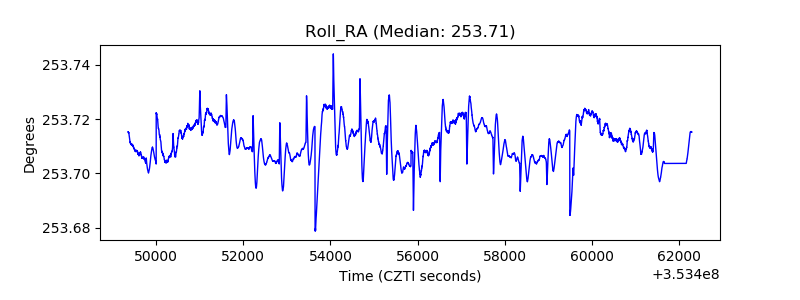 |
| Veto Counter | 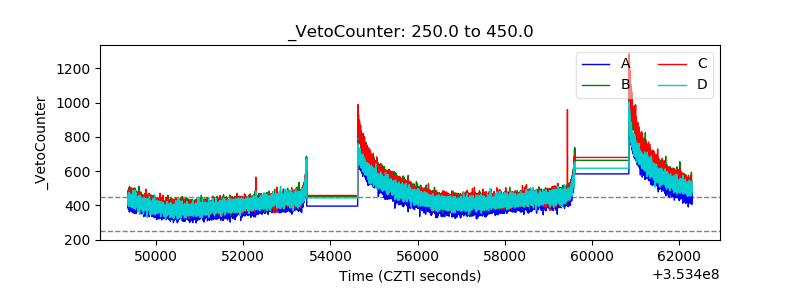 |