| Param | Original file | Final file |
|---|---|---|
| Filename | modeM0/AS1A10_073T07_9000004254_29531cztM0_level2.evt | modeM0/AS1A10_073T07_9000004254_29531cztM0_level2_quad_clean.evt |
| Size (bytes) | 661,913,280 | 79,606,080 |
| Size | 631.2 MB | 75.9 MB |
| Events in quadrant A | 2,955,705 | 514,409 |
| Events in quadrant B | 2,995,233 | 531,612 |
| Events in quadrant C | 3,180,512 | 511,228 |
| Events in quadrant D | 10,516,361 | 440,780 |
| Mode SS | |||
|---|---|---|---|
| Quadrant | BADHDUFLAG | Total packets | Discarded packets |
| A | 0 | 118 | 0 |
| B | 0 | 118 | 0 |
| C | 0 | 118 | 0 |
| D | 0 | 118 | 0 |
| Mode M9 | |||
|---|---|---|---|
| Quadrant | BADHDUFLAG | Total packets | Discarded packets |
| A | 0 | 11 | 0 |
| B | 0 | 11 | 0 |
| C | 0 | 11 | 0 |
| D | 0 | 11 | 0 |
| Mode M0 | |||
|---|---|---|---|
| Quadrant | BADHDUFLAG | Total packets | Discarded packets |
| A | 0 | 12385 | 1 |
| B | 0 | 12500 | 1 |
| C | 0 | 12891 | 1 |
| D | 0 | 35341 | 1 |
| Quadrant | Total seconds | Saturated seconds | Saturation percentage |
|---|---|---|---|
| A | 5905 | 88 | 1.490262% |
| B | 5905 | 103 | 1.744285% |
| C | 5905 | 218 | 3.691787% |
| D | 5905 | 1748 | 29.602032% |
Noise dominated data is calculated using 1-second bins in cleaned event files. If a bin has >2000 counts, and if more than 50% of those come from <1% of pixels, then it is considered to be noise-dominated and hence unusable.
| Quadrant | # 1 sec bins | Bins with >0 counts | Bins with >2000 counts | High rate bins dominated by noise | Noise dominated (total time) | Noise dominated (detector-on time) | Marked lightcurve |
|---|---|---|---|---|---|---|---|
| A | 6910 | 5906 | 0 | 0 | 0.00% | 0.00% | 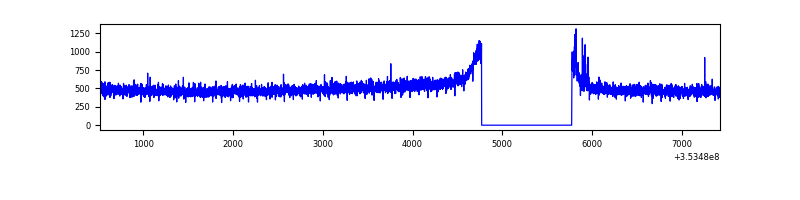 |
| B | 6910 | 5906 | 4 | 4 | 0.06% | 0.07% |  |
| C | 6910 | 5906 | 1 | 1 | 0.01% | 0.02% | 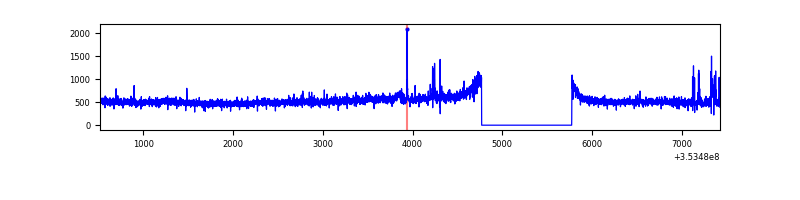 |
| D | 6910 | 5906 | 1914 | 1914 | 27.70% | 32.41% |  |
Top three noisy pixels from each quadrant. If the there are fewer than three noisy pixels in the level2.evt file, extra rows are filled as -1
| Pixel properties | Quadrant properties | ||||||
|---|---|---|---|---|---|---|---|
| Quadrant | DetID | PixID | Counts | Sigma | Mean | Median | Sigma |
| A | 11 | 29 | 22307 | 139.52 | 759 | 743 | 154.6 |
| A | 13 | 254 | 11142 | 67.28 | 759 | 743 | 154.6 |
| A | 3 | 137 | 7168 | 41.57 | 759 | 743 | 154.6 |
| B | 0 | 190 | 20970 | 140.39 | 751 | 734 | 144.1 |
| B | 12 | 111 | 17503 | 116.34 | 751 | 734 | 144.1 |
| B | 11 | 111 | 16144 | 106.91 | 751 | 734 | 144.1 |
| C | 14 | 238 | 141815 | 822.64 | 732 | 740 | 171.5 |
| C | 3 | 233 | 122701 | 711.18 | 732 | 740 | 171.5 |
| C | 14 | 254 | 40571 | 232.26 | 732 | 740 | 171.5 |
| D | 8 | 195 | 6824137 | 42172.71 | 688 | 673 | 161.8 |
| D | 7 | 238 | 908846 | 5613.0 | 688 | 673 | 161.8 |
| D | 7 | 223 | 85621 | 525.02 | 688 | 673 | 161.8 |
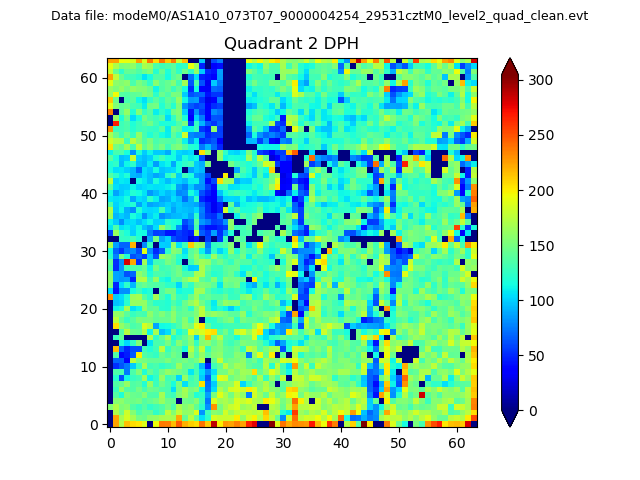
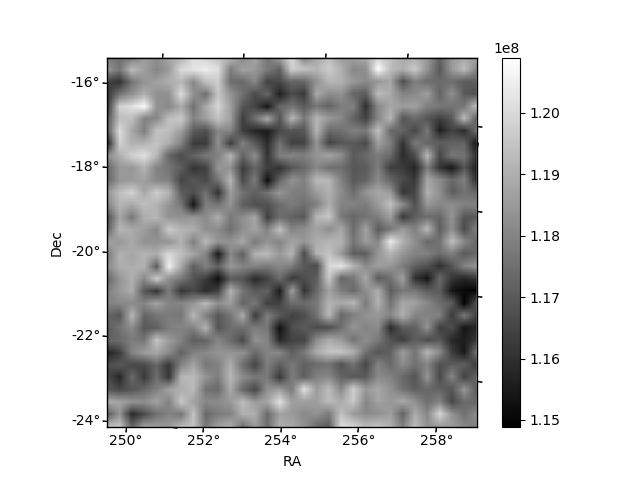
Histogram calculated using DETX and DETY for each event in the final _common_clean file
| Quadrant A | 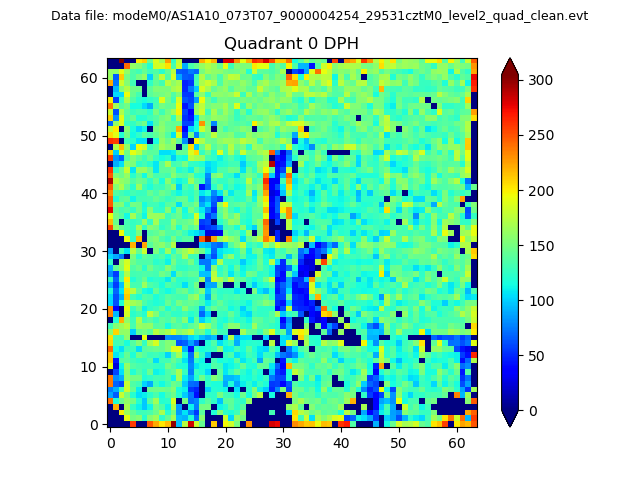 |
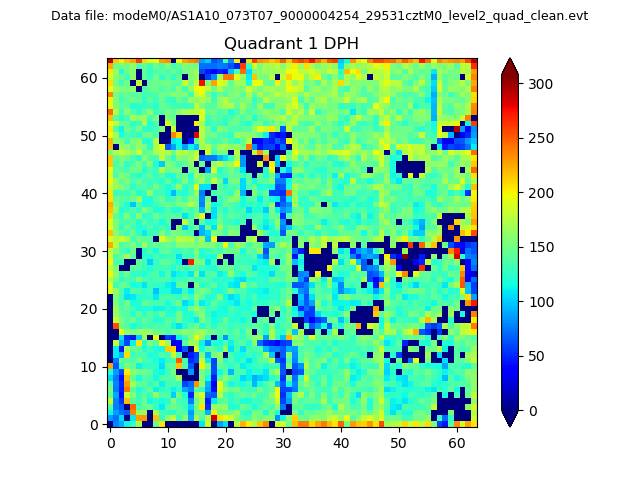 |
Quadrant B |
|---|---|---|---|
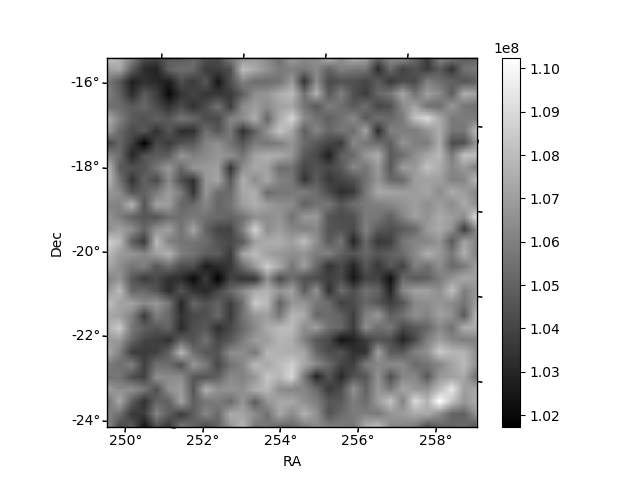
| Quadrant D | 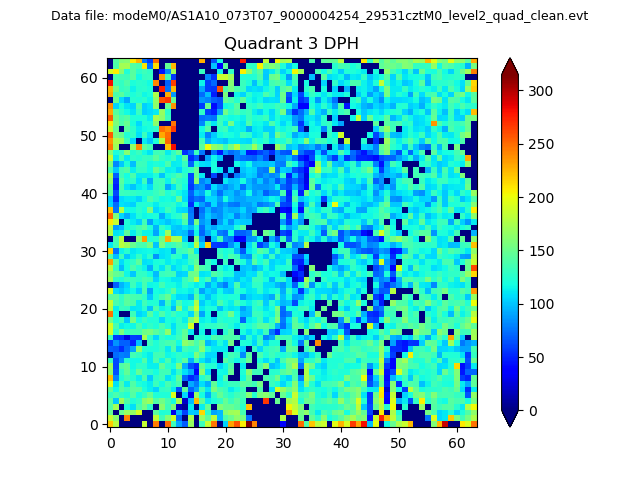 |
 |
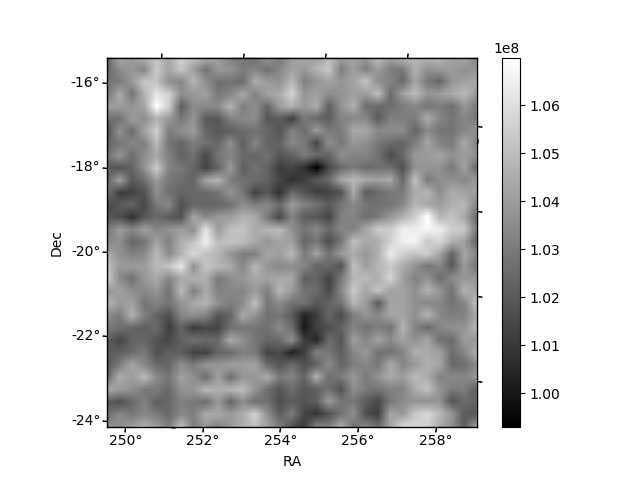
Quadrant C |
| Plot type | Count rate plots | Images |
|---|---|---|
| Comparison with Poisson distribution Blue bars denote a histogram of data divided into 1 sec bins. Red curve is a Poisson curve with rate = median count rate of data. |
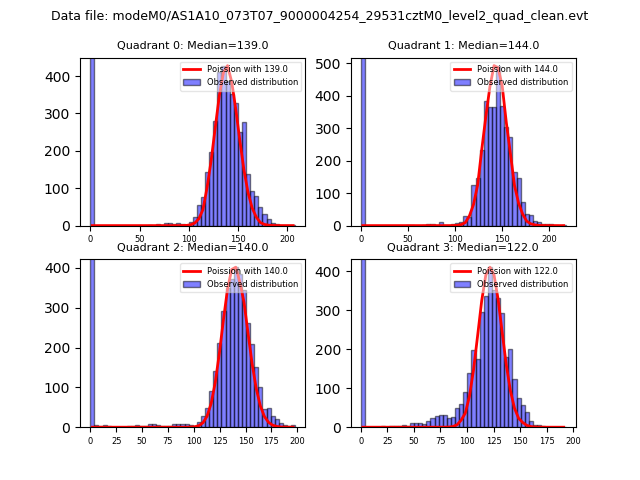 |
 |
| Quadrant-wise count rates Data is divided into 100 sec bins |
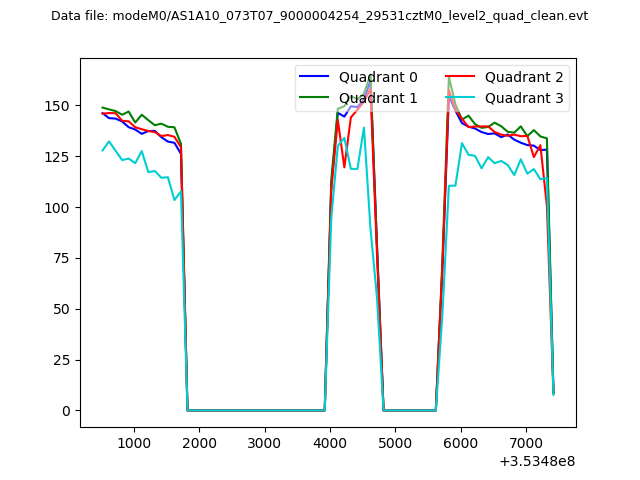 |
|
| Module-wise count rates for Quadrant A Data is divided into 100 sec bins |
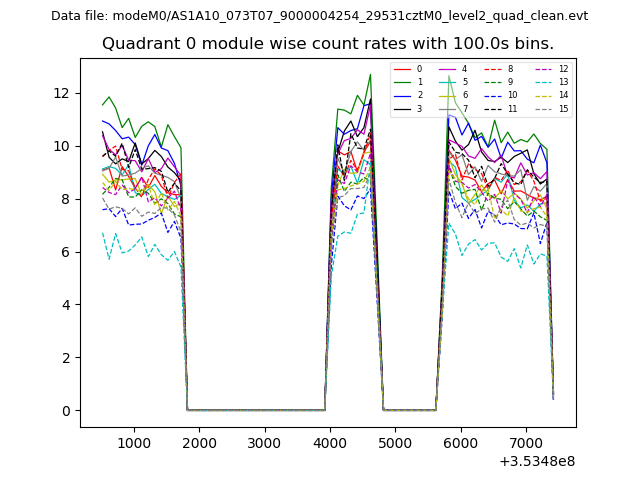 |
 |
| Module-wise count rates for Quadrant B Data is divided into 100 sec bins |
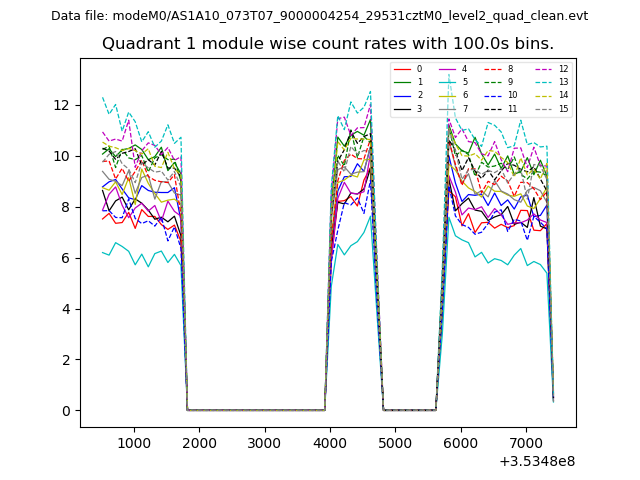 |
 |
| Module-wise count rates for Quadrant C Data is divided into 100 sec bins |
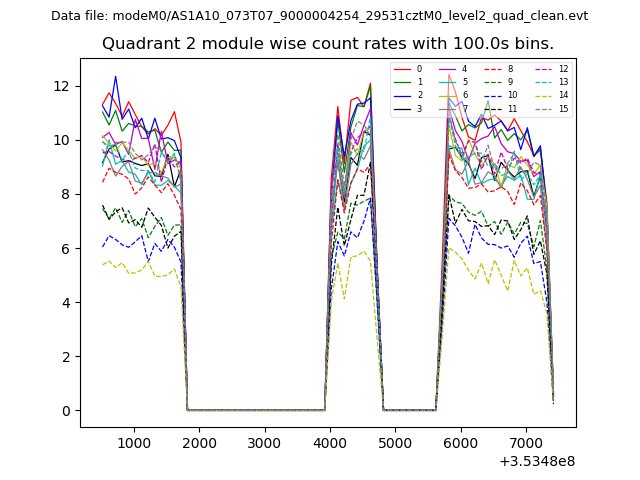 |
 |
| Module-wise count rates for Quadrant D Data is divided into 100 sec bins |
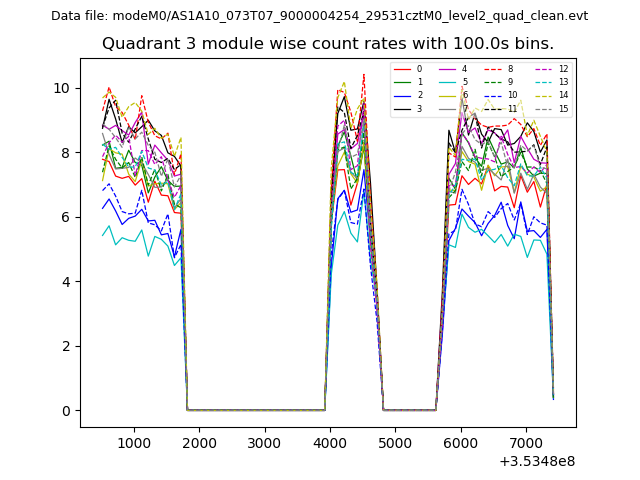 |
 |
| Parameter | Plot |
|---|---|
| CZT HV Monitor | 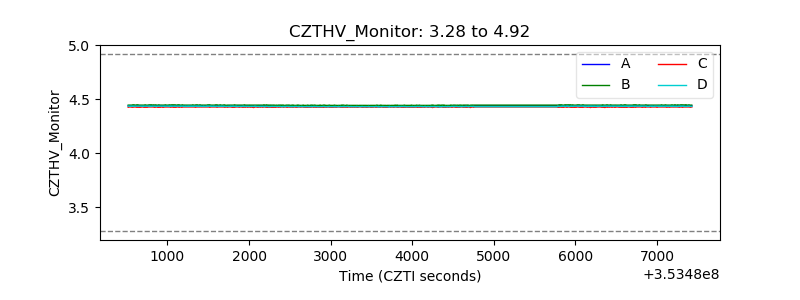 |
| D_VDD | 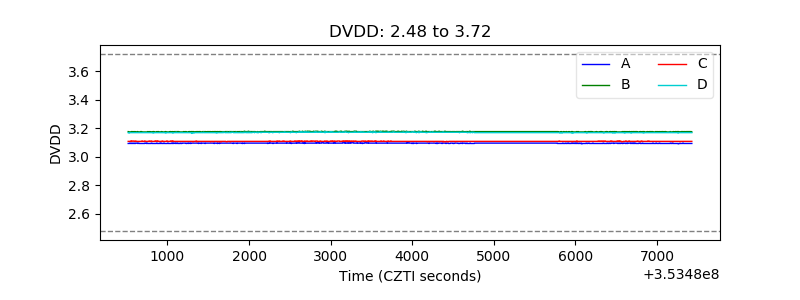 |
| Temperature 1 |  |
| Veto HV Monitor | 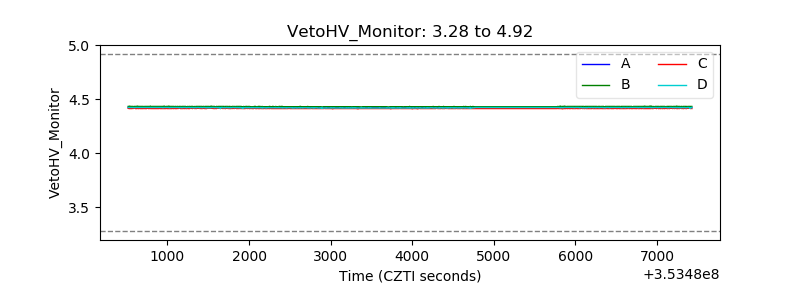 |
| Veto LLD |  |
| Alpha Counter | 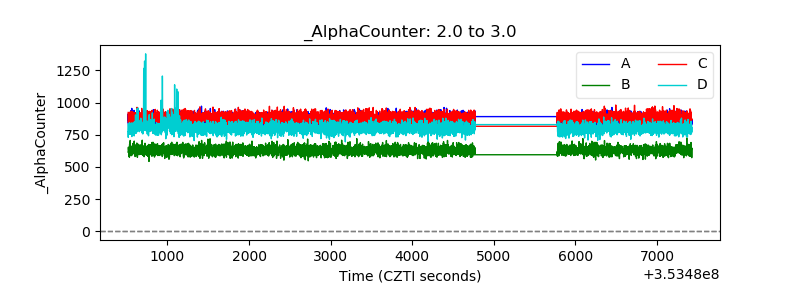 |
| _CPM_Rate | 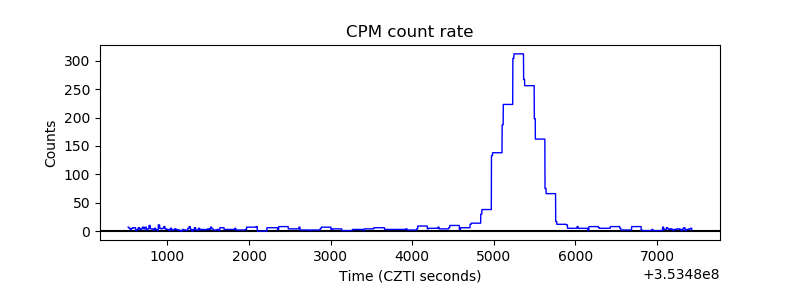 |
| CZT Counter | 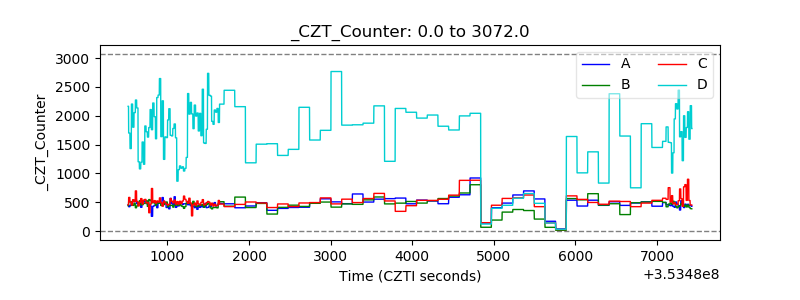 |
| +2.5 Volts monitor |  |
| +5 Volts monitor |  |
| _ROLL_ROT | 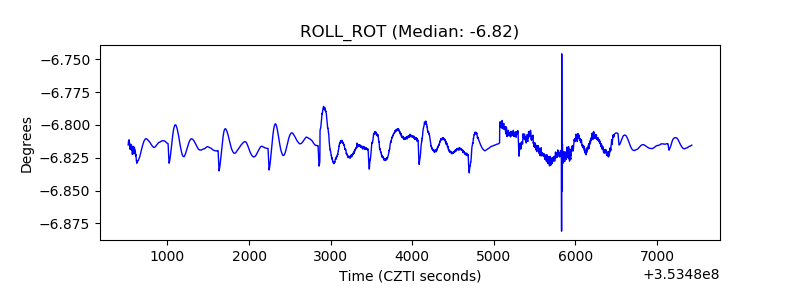 |
| _Roll_DEC | 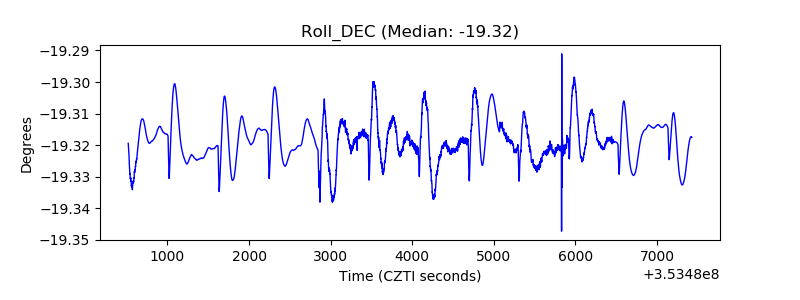 |
| _Roll_RA | 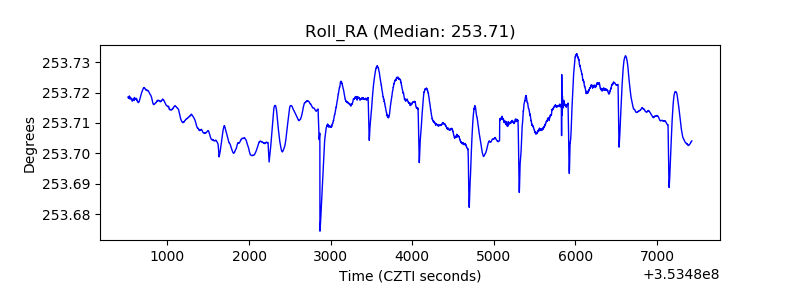 |
| Veto Counter | 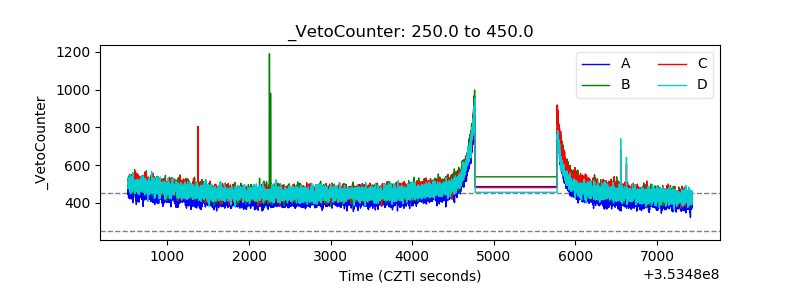 |