| Param | Original file | Final file |
|---|---|---|
| Filename | modeM0/AS1A10_073T07_9000004254_29532cztM0_level2.evt | modeM0/AS1A10_073T07_9000004254_29532cztM0_level2_quad_clean.evt |
| Size (bytes) | 1,423,848,960 | 165,317,760 |
| Size | 1.3 GB | 157.7 MB |
| Events in quadrant A | 6,440,414 | 1,061,230 |
| Events in quadrant B | 6,816,251 | 1,096,265 |
| Events in quadrant C | 6,830,740 | 1,060,058 |
| Events in quadrant D | 22,173,373 | 903,783 |
| Mode SS | |||
|---|---|---|---|
| Quadrant | BADHDUFLAG | Total packets | Discarded packets |
| A | 0 | 282 | 18 |
| B | 0 | 284 | 20 |
| C | 0 | 282 | 24 |
| D | 0 | 277 | 13 |
| Mode M9 | |||
|---|---|---|---|
| Quadrant | BADHDUFLAG | Total packets | Discarded packets |
| A | 0 | 31 | 2 |
| B | 0 | 29 | 0 |
| C | 0 | 29 | 0 |
| D | 0 | 30 | 1 |
| Mode M0 | |||
|---|---|---|---|
| Quadrant | BADHDUFLAG | Total packets | Discarded packets |
| A | 0 | 28846 | 1896 |
| B | 0 | 30038 | 1995 |
| C | 0 | 29761 | 2015 |
| D | 0 | 80865 | 6229 |
| Quadrant | Total seconds | Saturated seconds | Saturation percentage |
|---|---|---|---|
| A | 12850 | 156 | 1.214008% |
| B | 12842 | 230 | 1.790998% |
| C | 12821 | 365 | 2.846892% |
| D | 12676 | 3885 | 30.648470% |
Noise dominated data is calculated using 1-second bins in cleaned event files. If a bin has >2000 counts, and if more than 50% of those come from <1% of pixels, then it is considered to be noise-dominated and hence unusable.
| Quadrant | # 1 sec bins | Bins with >0 counts | Bins with >2000 counts | High rate bins dominated by noise | Noise dominated (total time) | Noise dominated (detector-on time) | Marked lightcurve |
|---|---|---|---|---|---|---|---|
| A | 18358 | 12964 | 0 | 0 | 0.00% | 0.00% | 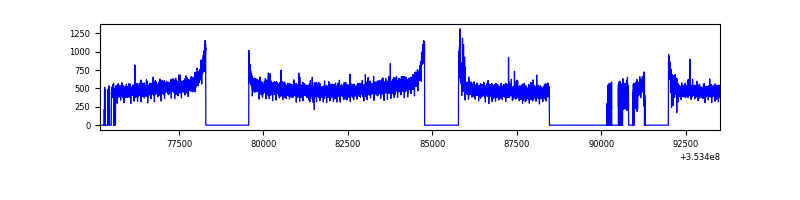 |
| B | 18356 | 12962 | 17 | 17 | 0.09% | 0.13% | 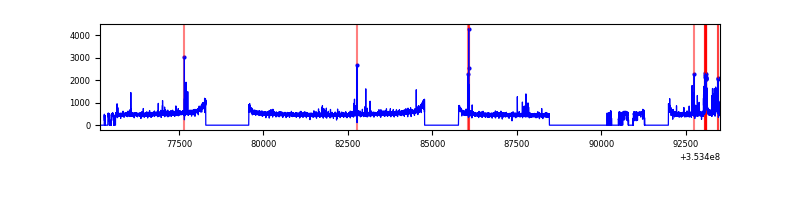 |
| C | 18354 | 12951 | 1 | 1 | 0.01% | 0.01% | 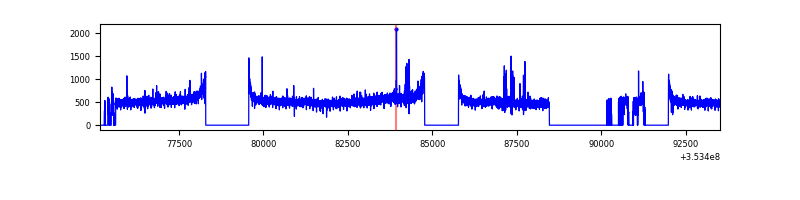 |
| D | 18233 | 12809 | 4006 | 4006 | 21.97% | 31.27% | 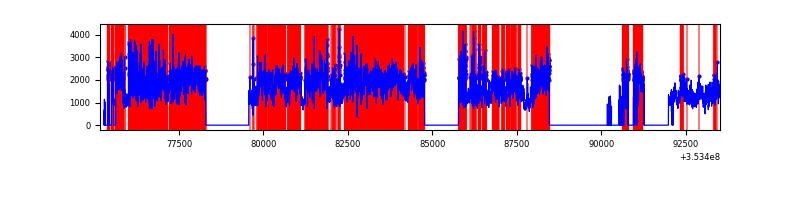 |
Top three noisy pixels from each quadrant. If the there are fewer than three noisy pixels in the level2.evt file, extra rows are filled as -1
| Pixel properties | Quadrant properties | ||||||
|---|---|---|---|---|---|---|---|
| Quadrant | DetID | PixID | Counts | Sigma | Mean | Median | Sigma |
| A | 11 | 29 | 25467 | 70.84 | 1662 | 1622 | 336.6 |
| A | 13 | 254 | 24276 | 67.3 | 1662 | 1622 | 336.6 |
| A | 3 | 137 | 15618 | 41.58 | 1662 | 1622 | 336.6 |
| B | 0 | 229 | 273786 | 865.04 | 1646 | 1602 | 314.6 |
| B | 0 | 190 | 54483 | 168.06 | 1646 | 1602 | 314.6 |
| B | 12 | 111 | 38355 | 116.81 | 1646 | 1602 | 314.6 |
| C | 14 | 238 | 288173 | 766.76 | 1603 | 1618 | 373.7 |
| C | 3 | 233 | 208176 | 552.7 | 1603 | 1618 | 373.7 |
| C | 14 | 254 | 51377 | 133.14 | 1603 | 1618 | 373.7 |
| D | 8 | 195 | 13934205 | 39933.56 | 1480 | 1447 | 348.9 |
| D | 7 | 238 | 2014893 | 5770.86 | 1480 | 1447 | 348.9 |
| D | 7 | 223 | 280727 | 800.46 | 1480 | 1447 | 348.9 |
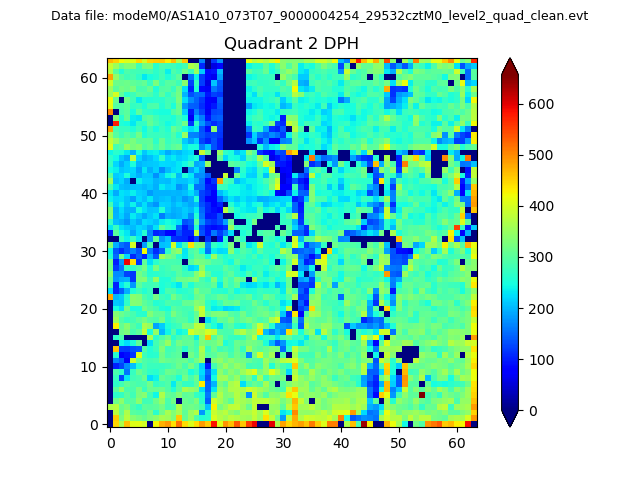
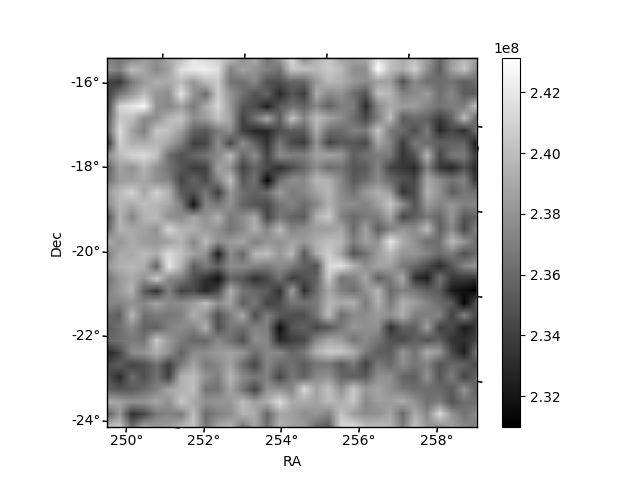
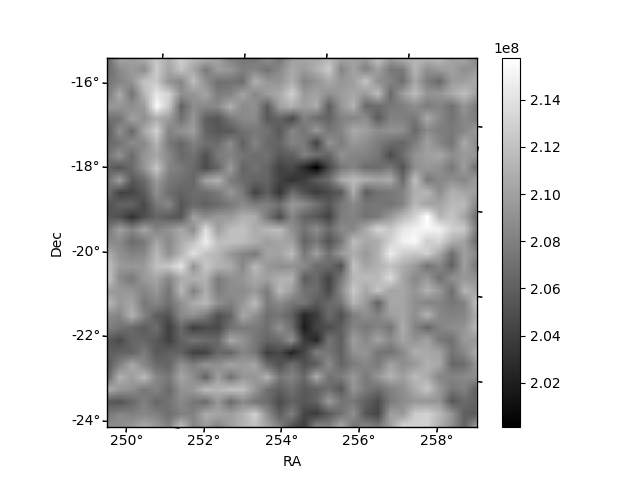
Histogram calculated using DETX and DETY for each event in the final _common_clean file
| Quadrant A | 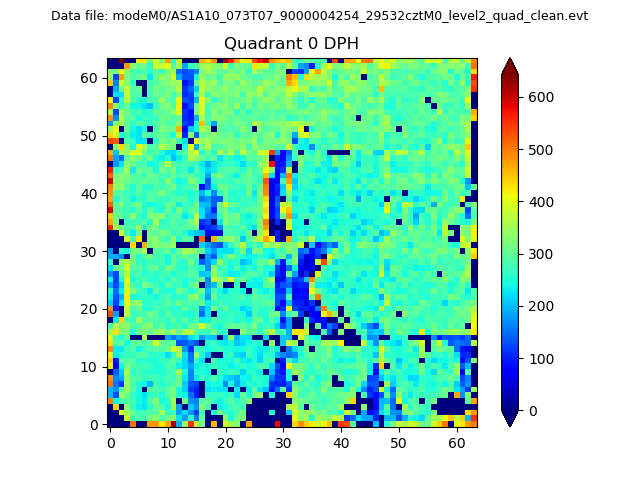 |
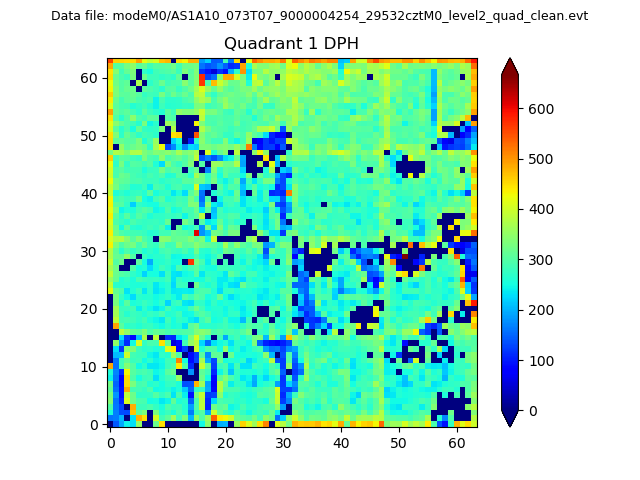 |
Quadrant B |
|---|---|---|---|
| Quadrant D | 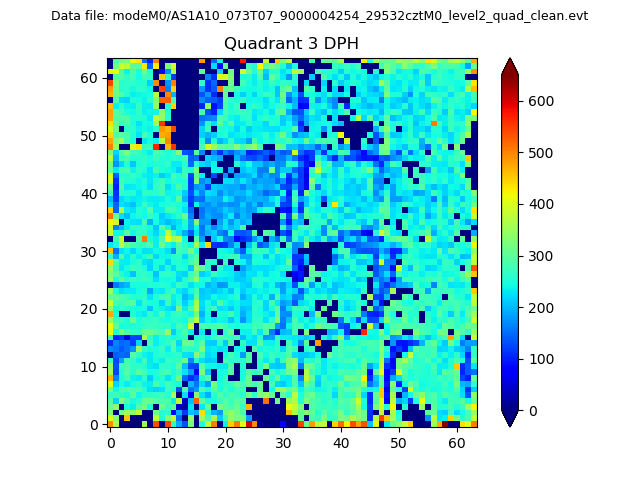 |
 |
Quadrant C |
| Plot type | Count rate plots | Images |
|---|---|---|
| Comparison with Poisson distribution Blue bars denote a histogram of data divided into 1 sec bins. Red curve is a Poisson curve with rate = median count rate of data. |
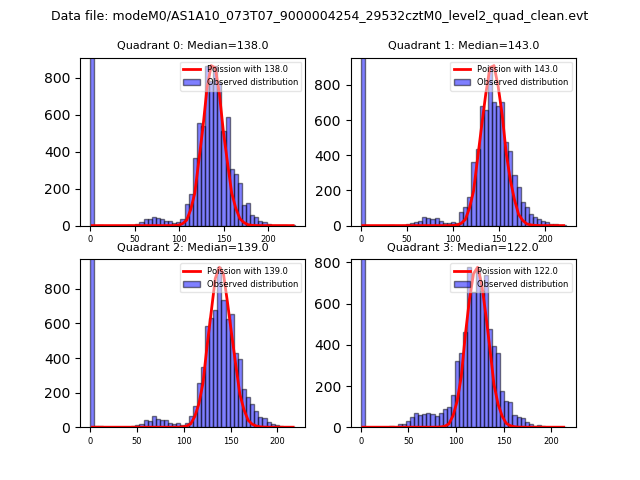 |
 |
| Quadrant-wise count rates Data is divided into 100 sec bins |
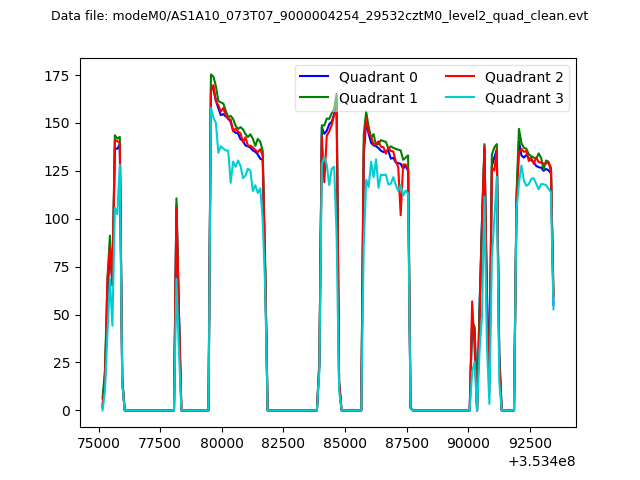 |
|
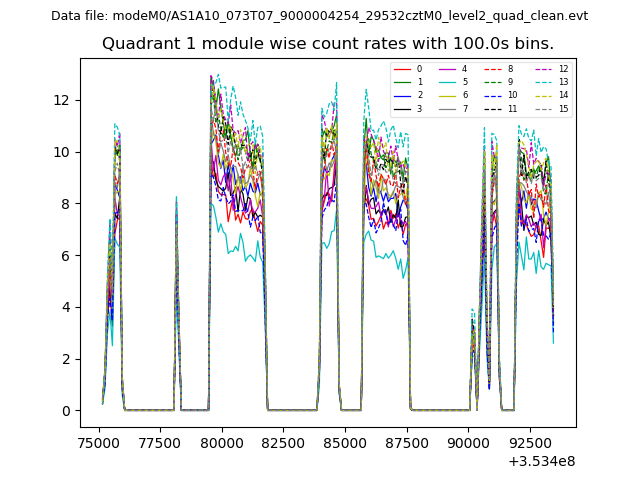
| Module-wise count rates for Quadrant A Data is divided into 100 sec bins |
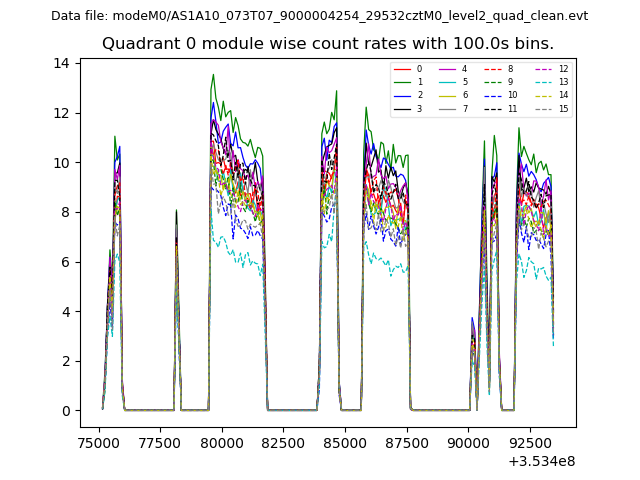 |
 |
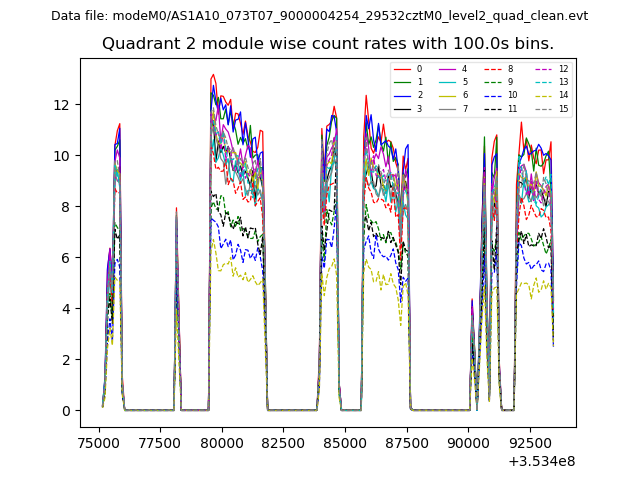
| Module-wise count rates for Quadrant B Data is divided into 100 sec bins |
 |
 |
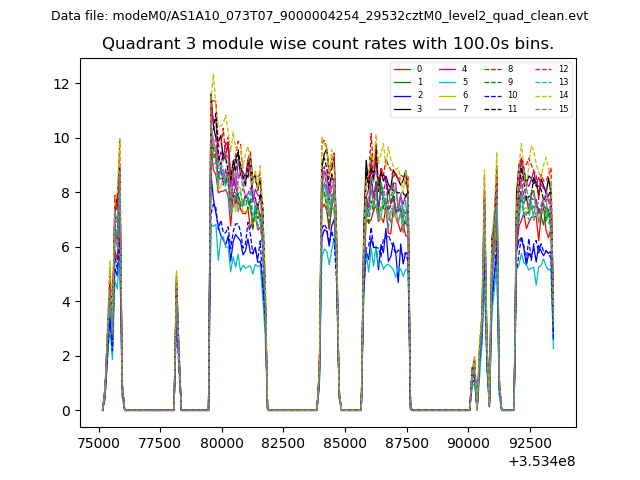
| Module-wise count rates for Quadrant C Data is divided into 100 sec bins |
 |
 |
| Module-wise count rates for Quadrant D Data is divided into 100 sec bins |
 |
 |
| Parameter | Plot |
|---|---|
| CZT HV Monitor | 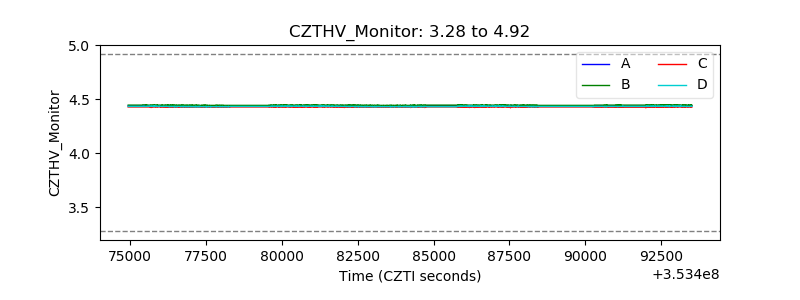 |
| D_VDD | 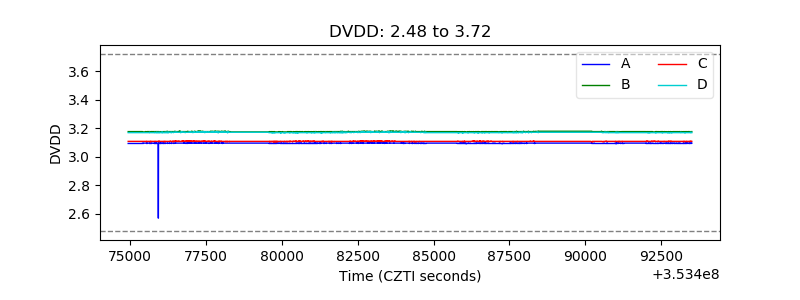 |
| Temperature 1 | 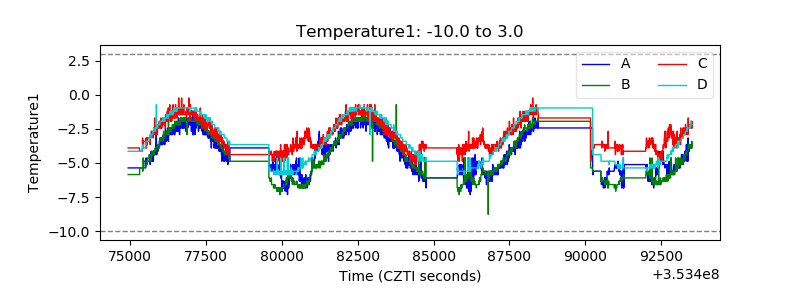 |
| Veto HV Monitor | 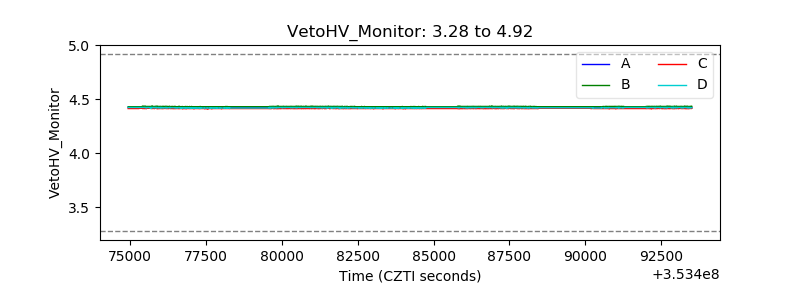 |
| Veto LLD | 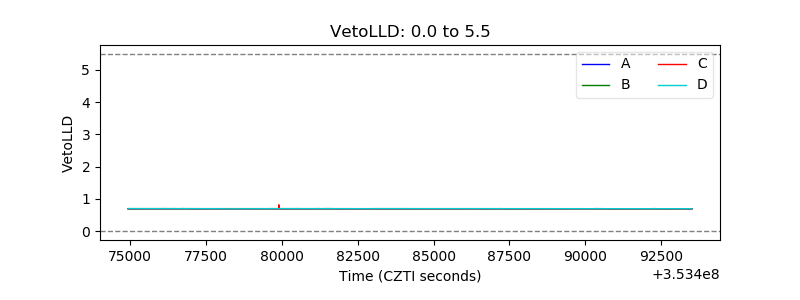 |
| Alpha Counter | 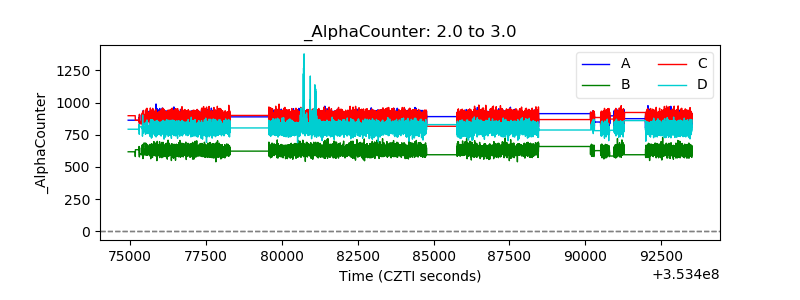 |
| _CPM_Rate | 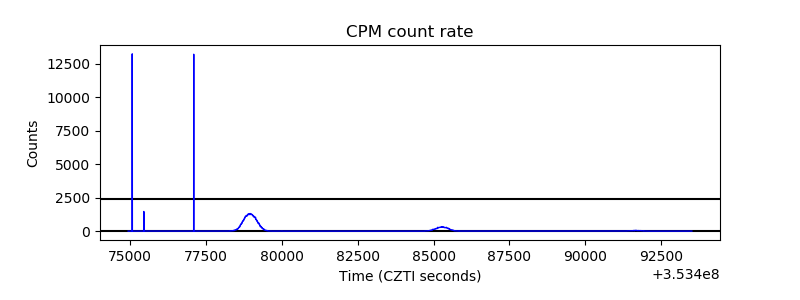 |
| CZT Counter | 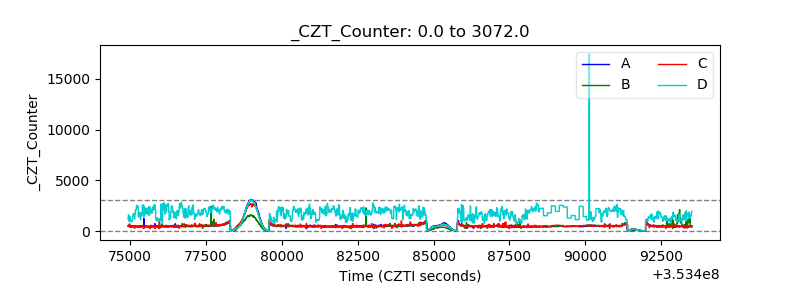 |
| +2.5 Volts monitor |  |
| +5 Volts monitor |  |
| _ROLL_ROT | 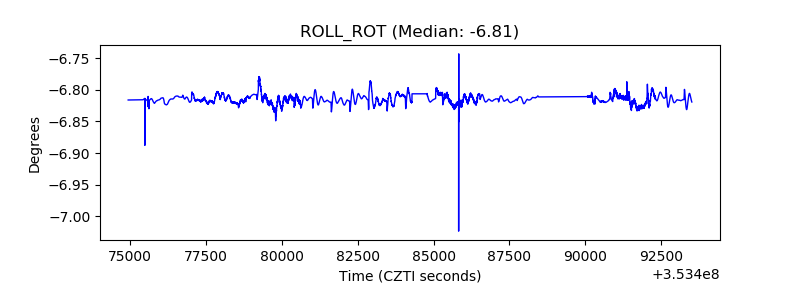 |
| _Roll_DEC | 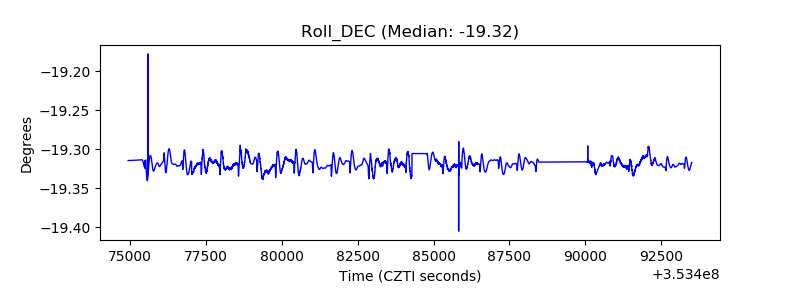 |
| _Roll_RA | 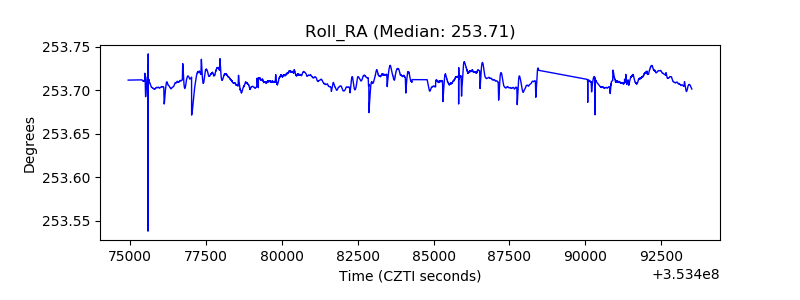 |
| Veto Counter | 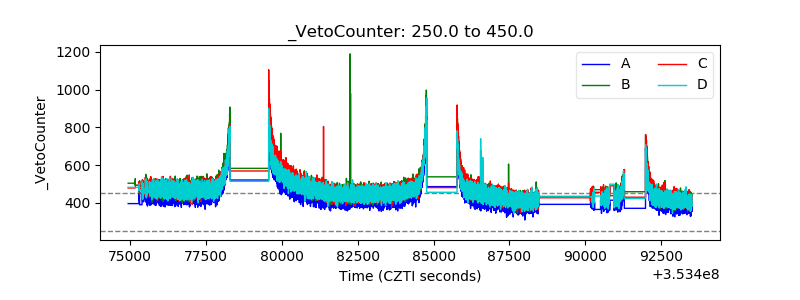 |