| Param | Original file | Final file |
|---|---|---|
| Filename | modeM0/AS1A10_073T07_9000004254_29533cztM0_level2.evt | modeM0/AS1A10_073T07_9000004254_29533cztM0_level2_quad_clean.evt |
| Size (bytes) | 318,424,320 | 34,439,040 |
| Size | 303.7 MB | 32.8 MB |
| Events in quadrant A | 1,466,210 | 213,129 |
| Events in quadrant B | 1,605,177 | 219,771 |
| Events in quadrant C | 1,509,751 | 216,833 |
| Events in quadrant D | 4,863,606 | 184,656 |
| Mode SS | |||
|---|---|---|---|
| Quadrant | BADHDUFLAG | Total packets | Discarded packets |
| A | 0 | 64 | 2 |
| B | 0 | 64 | 2 |
| C | 0 | 65 | 5 |
| D | 0 | 63 | 1 |
| Mode M9 | |||
|---|---|---|---|
| Quadrant | BADHDUFLAG | Total packets | Discarded packets |
| A | 0 | 1 | 0 |
| B | 0 | 1 | 0 |
| C | 0 | 2 | 1 |
| D | 0 | 2 | 1 |
| Mode M0 | |||
|---|---|---|---|
| Quadrant | BADHDUFLAG | Total packets | Discarded packets |
| A | 0 | 6536 | 230 |
| B | 0 | 6957 | 273 |
| C | 0 | 6587 | 257 |
| D | 0 | 17298 | 861 |
| Quadrant | Total seconds | Saturated seconds | Saturation percentage |
|---|---|---|---|
| A | 2913 | 231 | 7.929969% |
| B | 2903 | 244 | 8.405098% |
| C | 2907 | 243 | 8.359133% |
| D | 2887 | 1017 | 35.226879% |
Noise dominated data is calculated using 1-second bins in cleaned event files. If a bin has >2000 counts, and if more than 50% of those come from <1% of pixels, then it is considered to be noise-dominated and hence unusable.
| Quadrant | # 1 sec bins | Bins with >0 counts | Bins with >2000 counts | High rate bins dominated by noise | Noise dominated (total time) | Noise dominated (detector-on time) | Marked lightcurve |
|---|---|---|---|---|---|---|---|
| A | 5049 | 2930 | 0 | 0 | 0.00% | 0.00% | 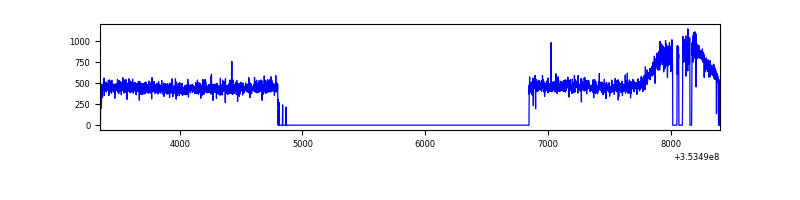 |
| B | 5043 | 2922 | 9 | 9 | 0.18% | 0.31% | 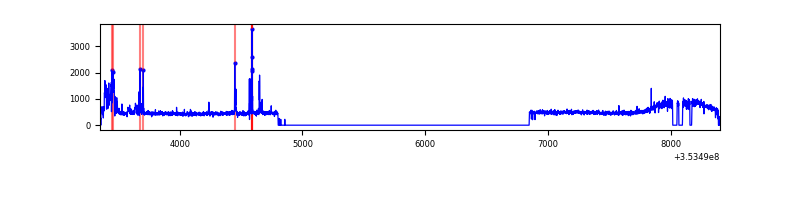 |
| C | 5045 | 2923 | 0 | 0 | 0.00% | 0.00% | 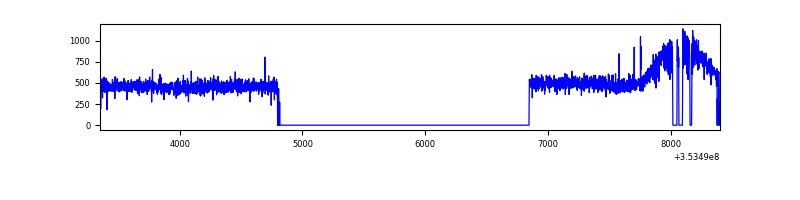 |
| D | 5046 | 2904 | 806 | 806 | 15.97% | 27.75% | 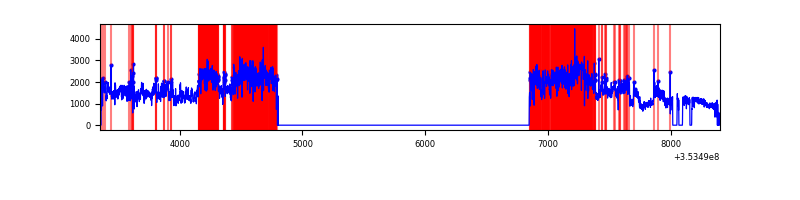 |
Top three noisy pixels from each quadrant. If the there are fewer than three noisy pixels in the level2.evt file, extra rows are filled as -1
| Pixel properties | Quadrant properties | ||||||
|---|---|---|---|---|---|---|---|
| Quadrant | DetID | PixID | Counts | Sigma | Mean | Median | Sigma |
| A | 13 | 254 | 5593 | 65.34 | 379 | 369 | 80.0 |
| A | 3 | 137 | 4063 | 46.2 | 379 | 369 | 80.0 |
| A | 0 | 226 | 3242 | 35.93 | 379 | 369 | 80.0 |
| B | 0 | 229 | 78182 | 1018.47 | 372 | 360 | 76.4 |
| B | 5 | 255 | 31174 | 403.27 | 372 | 360 | 76.4 |
| B | 10 | 247 | 14062 | 179.32 | 372 | 360 | 76.4 |
| C | 14 | 238 | 58384 | 663.1 | 365 | 365 | 87.5 |
| C | 3 | 233 | 16688 | 186.55 | 365 | 365 | 87.5 |
| C | 2 | 114 | 6935 | 75.09 | 365 | 365 | 87.5 |
| D | 8 | 195 | 2827292 | 33966.58 | 341 | 331 | 83.2 |
| D | 12 | 33 | 303309 | 3640.35 | 341 | 331 | 83.2 |
| D | 7 | 238 | 297105 | 3565.81 | 341 | 331 | 83.2 |
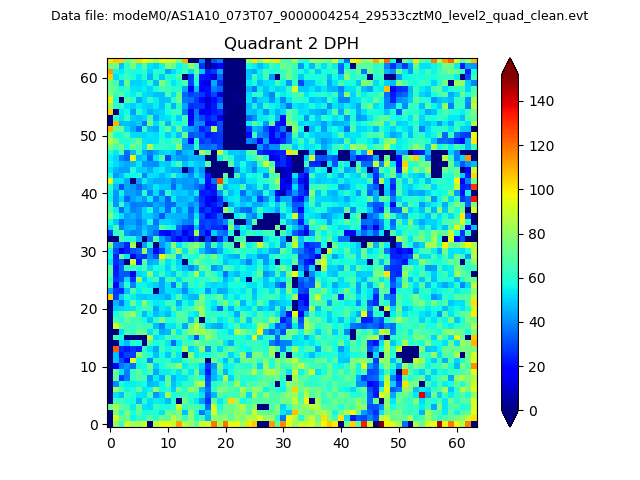
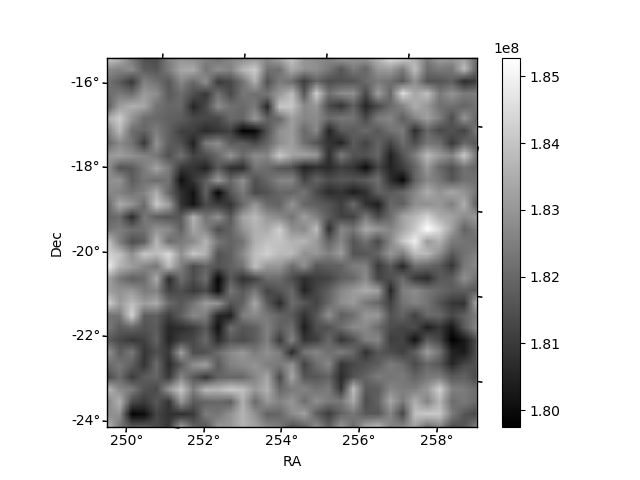
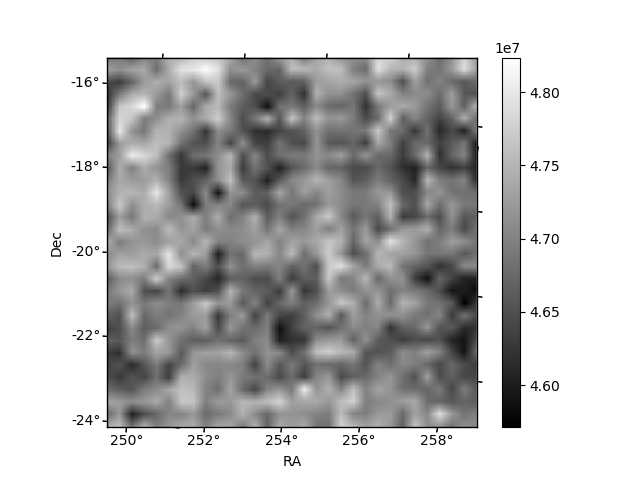
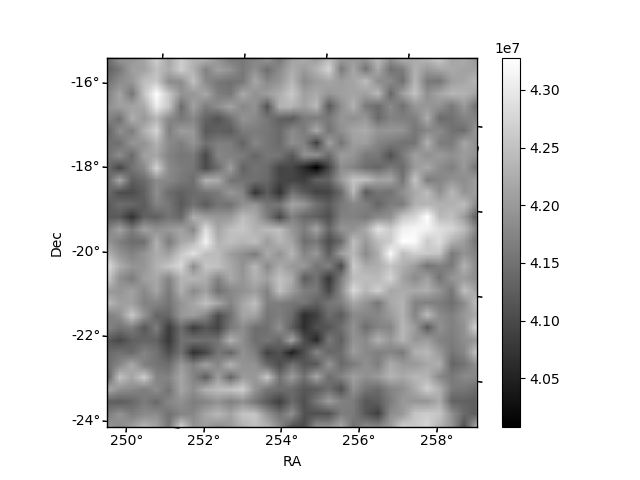
Histogram calculated using DETX and DETY for each event in the final _common_clean file
| Quadrant A | 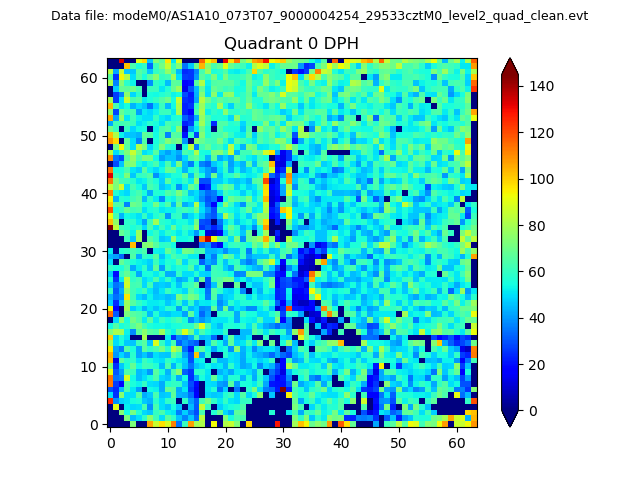 |
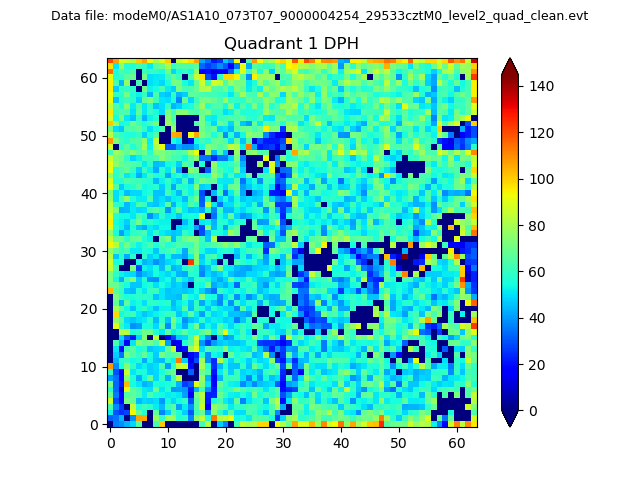 |
Quadrant B |
|---|---|---|---|
| Quadrant D | 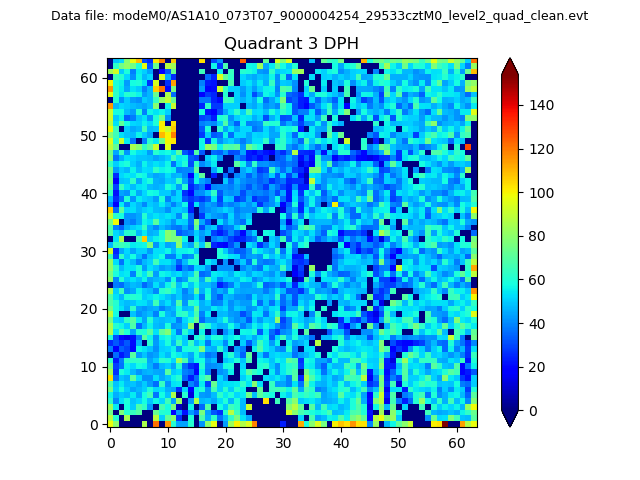 |
 |
Quadrant C |
| Plot type | Count rate plots | Images |
|---|---|---|
| Comparison with Poisson distribution Blue bars denote a histogram of data divided into 1 sec bins. Red curve is a Poisson curve with rate = median count rate of data. |
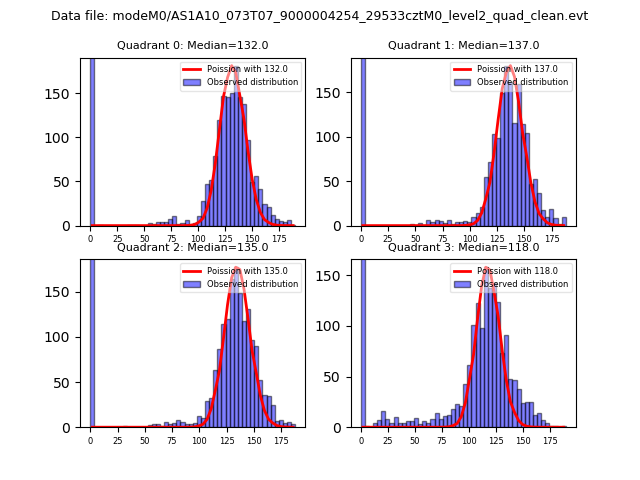 |
 |
| Quadrant-wise count rates Data is divided into 100 sec bins |
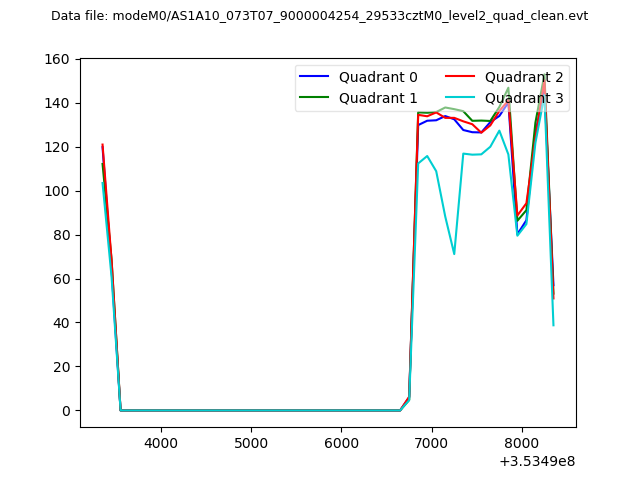 |
|
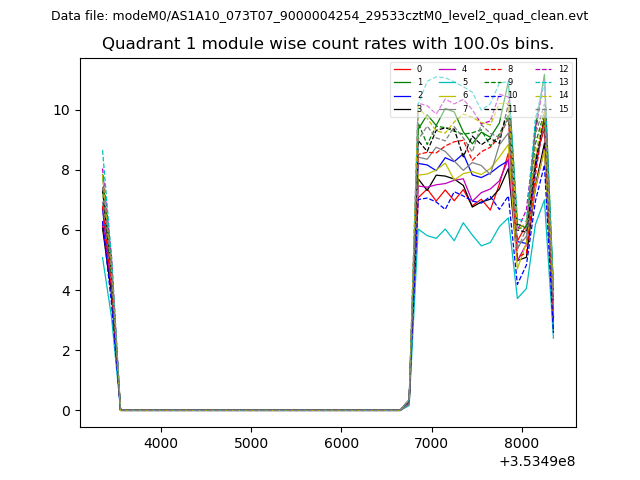
| Module-wise count rates for Quadrant A Data is divided into 100 sec bins |
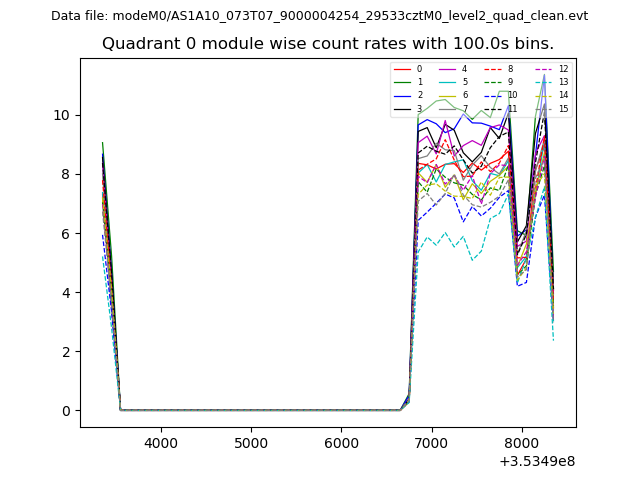 |
 |
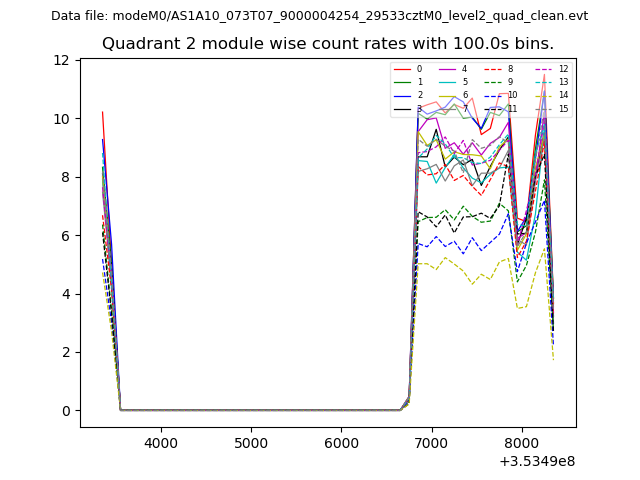
| Module-wise count rates for Quadrant B Data is divided into 100 sec bins |
 |
 |
| Module-wise count rates for Quadrant C Data is divided into 100 sec bins |
 |
 |
| Module-wise count rates for Quadrant D Data is divided into 100 sec bins |
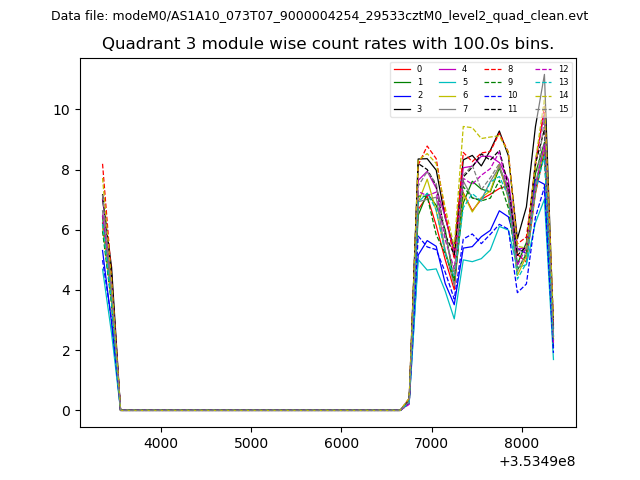 |
 |
| Parameter | Plot |
|---|---|
| CZT HV Monitor | 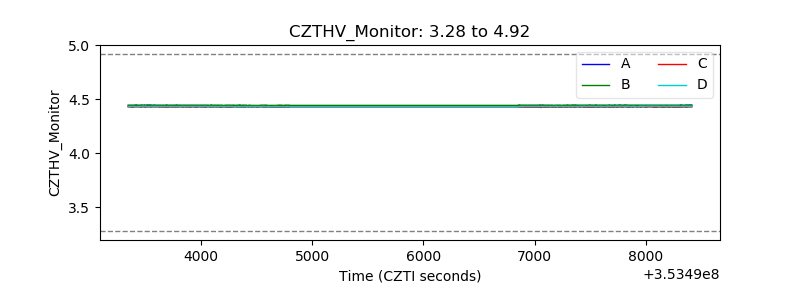 |
| D_VDD | 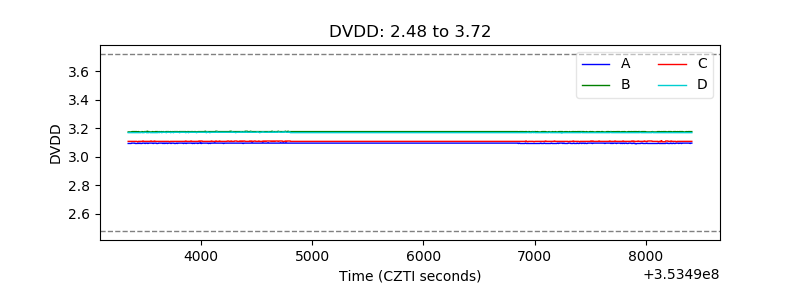 |
| Temperature 1 | 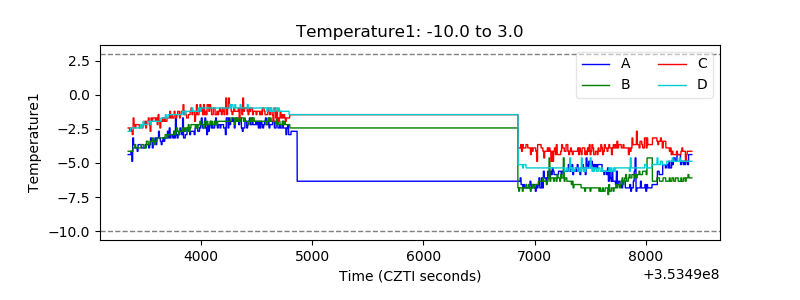 |
| Veto HV Monitor | 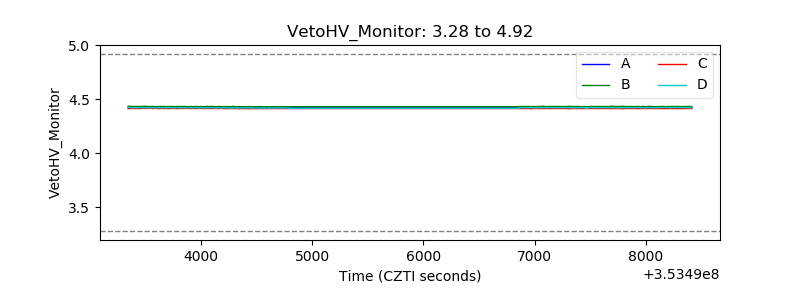 |
| Veto LLD | 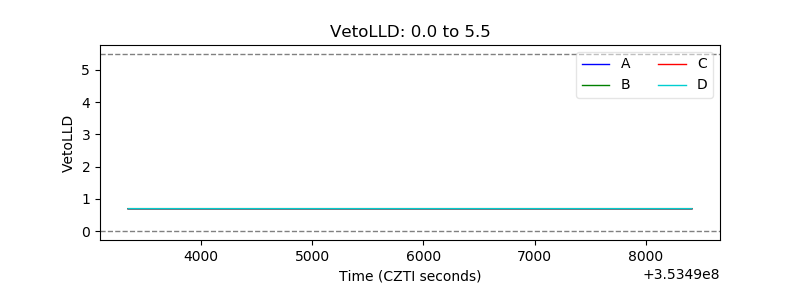 |
| Alpha Counter | 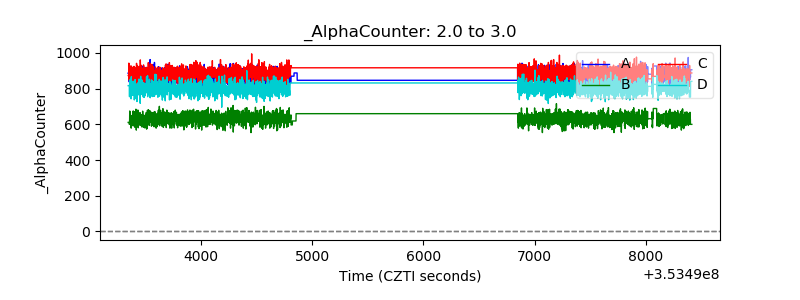 |
| _CPM_Rate | 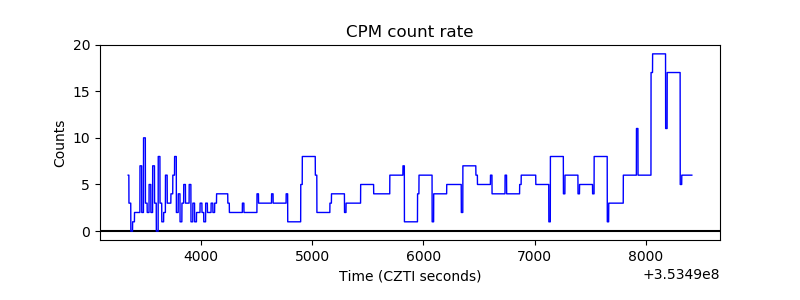 |
| CZT Counter | 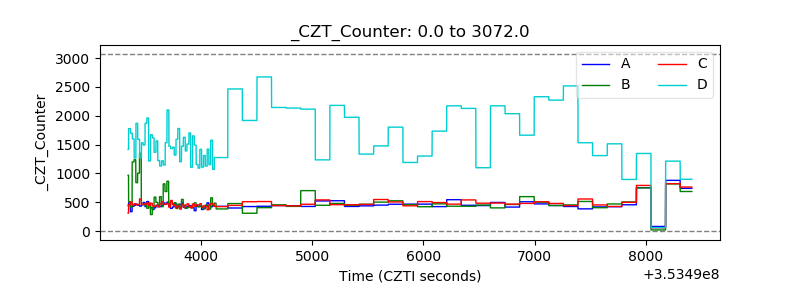 |
| +2.5 Volts monitor |  |
| +5 Volts monitor |  |
| _ROLL_ROT | 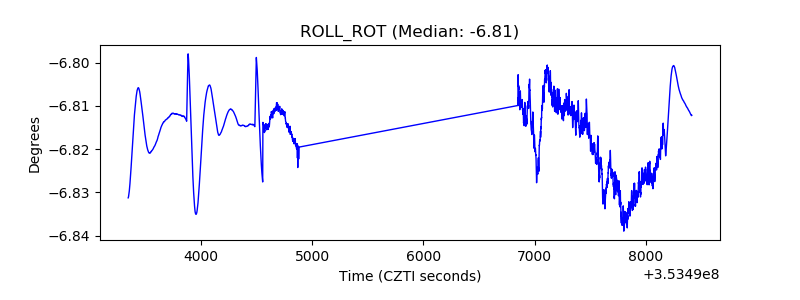 |
| _Roll_DEC | 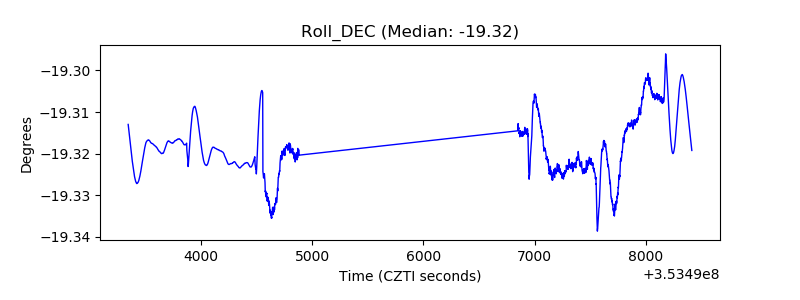 |
| _Roll_RA | 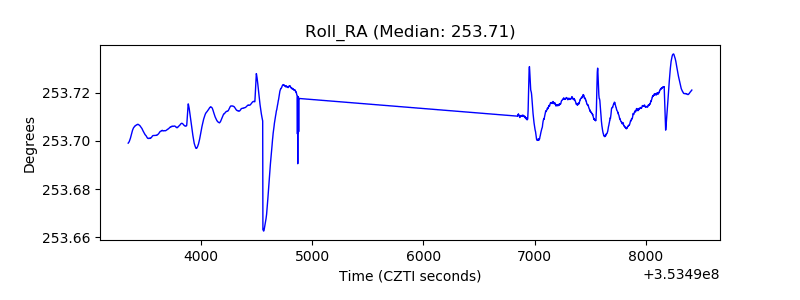 |
| Veto Counter | 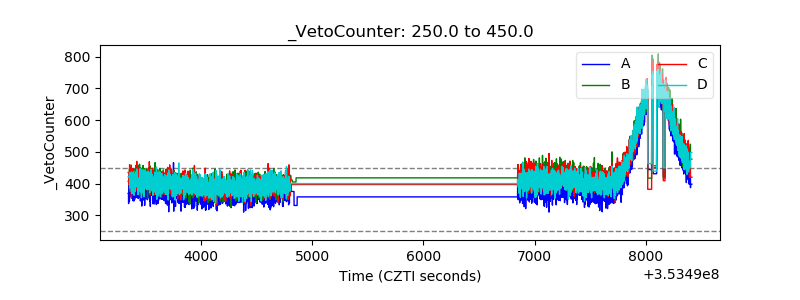 |