| Param | Original file | Final file |
|---|---|---|
| Filename | modeM0/AS1A10_073T07_9000004254_29534cztM0_level2.evt | modeM0/AS1A10_073T07_9000004254_29534cztM0_level2_quad_clean.evt |
| Size (bytes) | 484,119,360 | 58,268,160 |
| Size | 461.7 MB | 55.6 MB |
| Events in quadrant A | 2,291,017 | 357,474 |
| Events in quadrant B | 2,409,544 | 367,431 |
| Events in quadrant C | 2,371,240 | 360,808 |
| Events in quadrant D | 7,250,555 | 327,035 |
| Mode SS | |||
|---|---|---|---|
| Quadrant | BADHDUFLAG | Total packets | Discarded packets |
| A | 0 | 104 | 2 |
| B | 0 | 104 | 4 |
| C | 0 | 104 | 2 |
| D | 0 | 104 | 4 |
| Mode M0 | |||
|---|---|---|---|
| Quadrant | BADHDUFLAG | Total packets | Discarded packets |
| A | 0 | 10351 | 302 |
| B | 0 | 10619 | 299 |
| C | 0 | 10372 | 302 |
| D | 0 | 25803 | 806 |
| Quadrant | Total seconds | Saturated seconds | Saturation percentage |
|---|---|---|---|
| A | 5008 | 1 | 0.019968% |
| B | 5013 | 13 | 0.259326% |
| C | 5010 | 30 | 0.598802% |
| D | 4988 | 573 | 11.487570% |
Noise dominated data is calculated using 1-second bins in cleaned event files. If a bin has >2000 counts, and if more than 50% of those come from <1% of pixels, then it is considered to be noise-dominated and hence unusable.
| Quadrant | # 1 sec bins | Bins with >0 counts | Bins with >2000 counts | High rate bins dominated by noise | Noise dominated (total time) | Noise dominated (detector-on time) | Marked lightcurve |
|---|---|---|---|---|---|---|---|
| A | 5099 | 5040 | 0 | 0 | 0.00% | 0.00% | 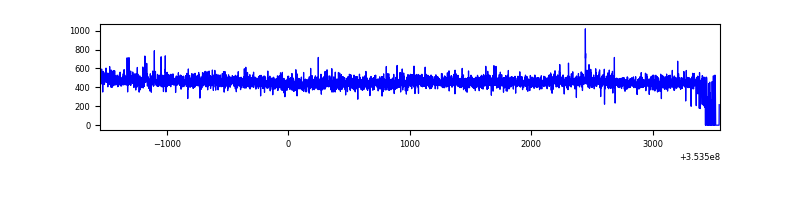 |
| B | 5105 | 5042 | 4 | 4 | 0.08% | 0.08% | 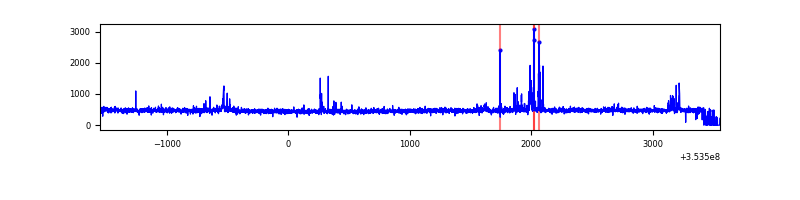 |
| C | 5075 | 5037 | 0 | 0 | 0.00% | 0.00% |  |
| D | 5054 | 5022 | 656 | 656 | 12.98% | 13.06% | 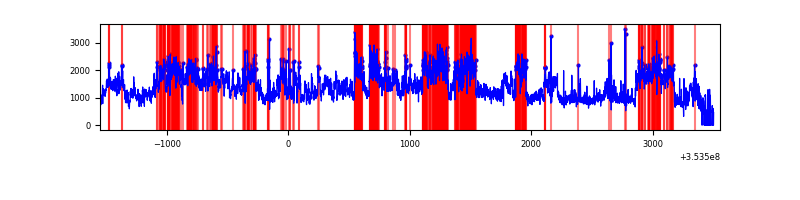 |
Top three noisy pixels from each quadrant. If the there are fewer than three noisy pixels in the level2.evt file, extra rows are filled as -1
| Pixel properties | Quadrant properties | ||||||
|---|---|---|---|---|---|---|---|
| Quadrant | DetID | PixID | Counts | Sigma | Mean | Median | Sigma |
| A | 0 | 13 | 9977 | 77.7 | 591 | 579 | 120.9 |
| A | 13 | 254 | 9412 | 73.03 | 591 | 579 | 120.9 |
| A | 3 | 137 | 5760 | 42.84 | 591 | 579 | 120.9 |
| B | 5 | 255 | 54697 | 473.51 | 589 | 573 | 114.3 |
| B | 0 | 190 | 20989 | 178.61 | 589 | 573 | 114.3 |
| B | 12 | 111 | 14020 | 117.64 | 589 | 573 | 114.3 |
| C | 14 | 238 | 100060 | 731.96 | 574 | 578 | 135.9 |
| C | 2 | 114 | 11370 | 79.4 | 574 | 578 | 135.9 |
| C | 14 | 254 | 11217 | 78.28 | 574 | 578 | 135.9 |
| D | 8 | 195 | 4573987 | 33509.91 | 562 | 547 | 136.5 |
| D | 7 | 223 | 249261 | 1822.34 | 562 | 547 | 136.5 |
| D | 12 | 33 | 135753 | 990.66 | 562 | 547 | 136.5 |
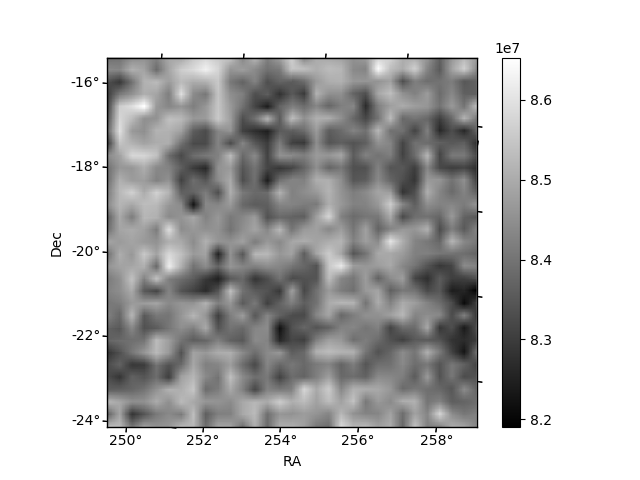
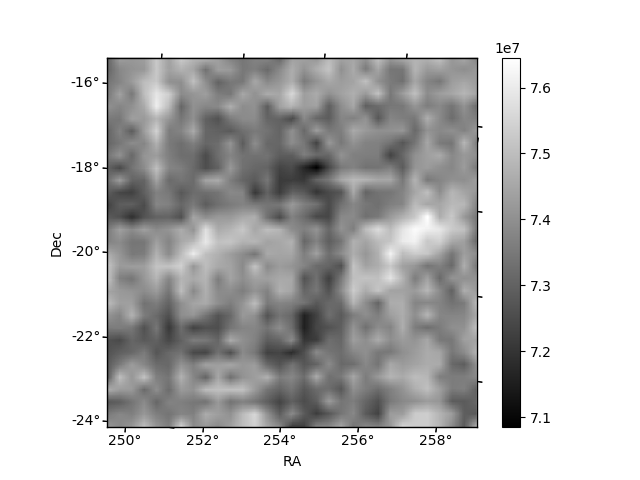
Histogram calculated using DETX and DETY for each event in the final _common_clean file
| Quadrant A | 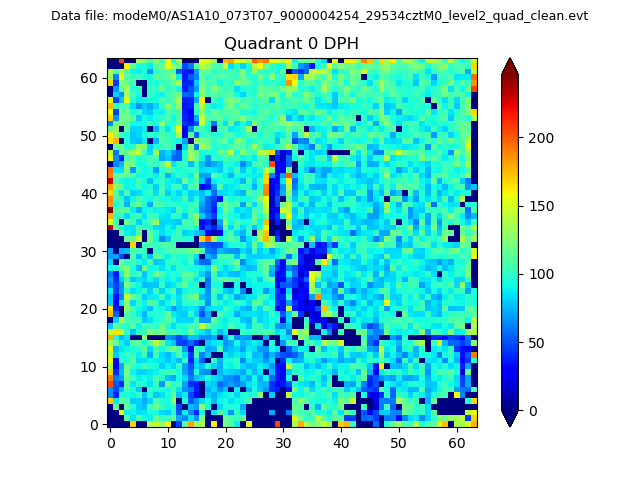 |
 |
Quadrant B |
|---|---|---|---|
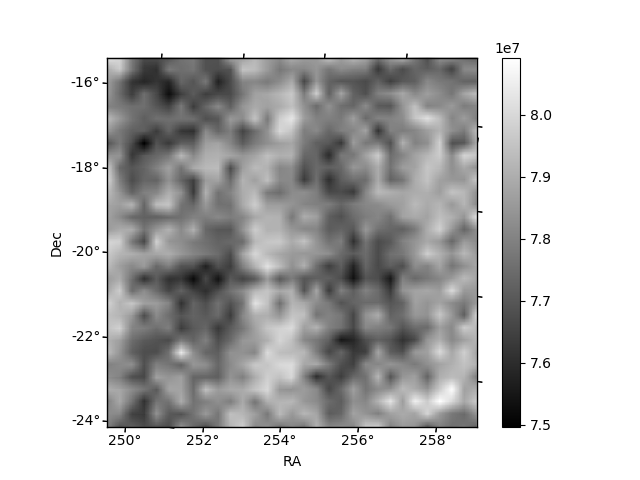
| Quadrant D |  |
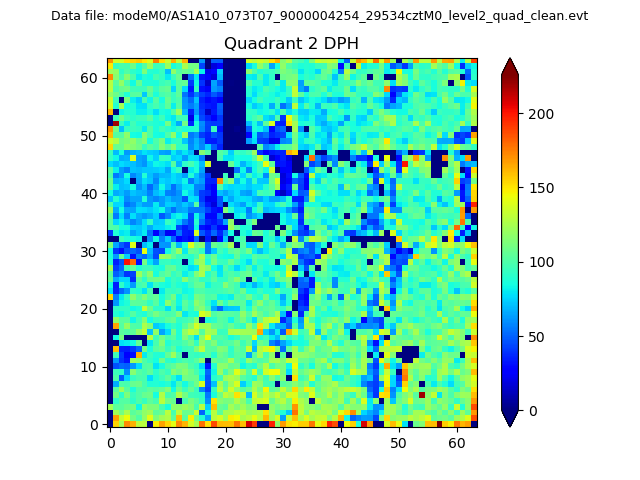 |
Quadrant C |
| Plot type | Count rate plots | Images |
|---|---|---|
| Comparison with Poisson distribution Blue bars denote a histogram of data divided into 1 sec bins. Red curve is a Poisson curve with rate = median count rate of data. |
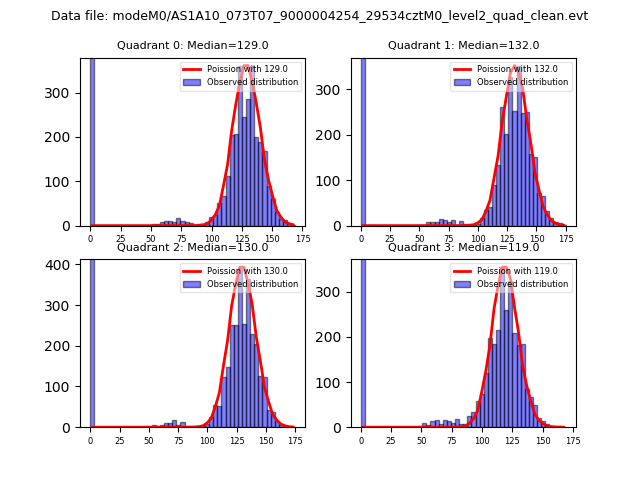 |
 |
| Quadrant-wise count rates Data is divided into 100 sec bins |
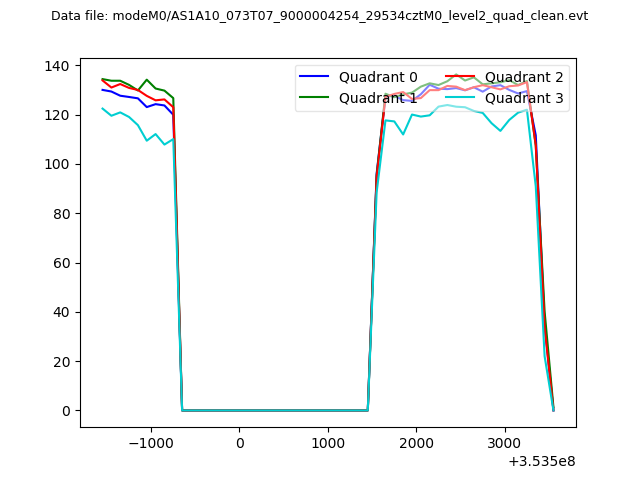 |
|
| Module-wise count rates for Quadrant A Data is divided into 100 sec bins |
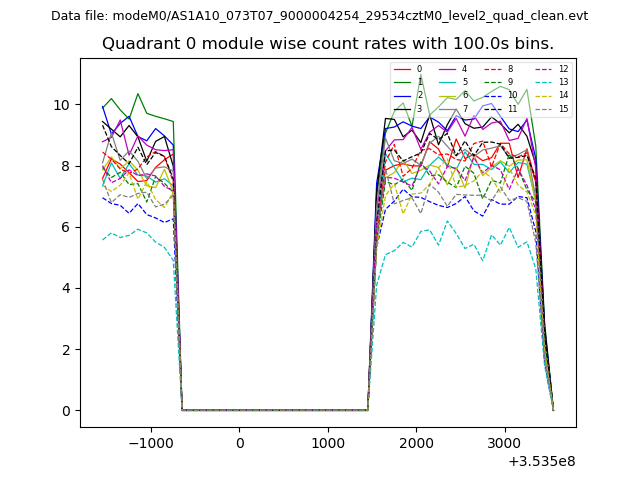 |
 |
| Module-wise count rates for Quadrant B Data is divided into 100 sec bins |
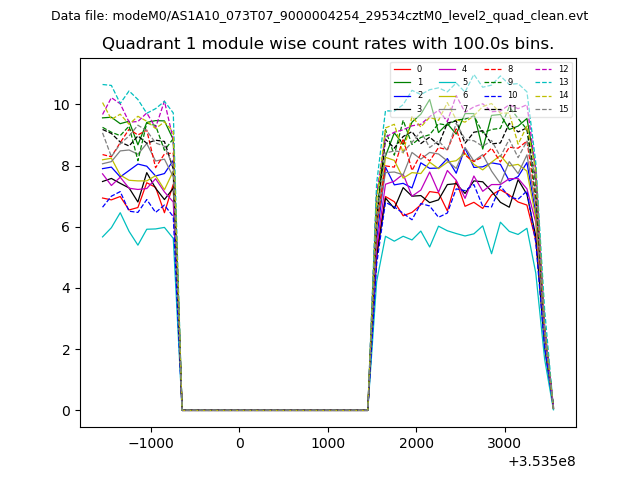 |
 |
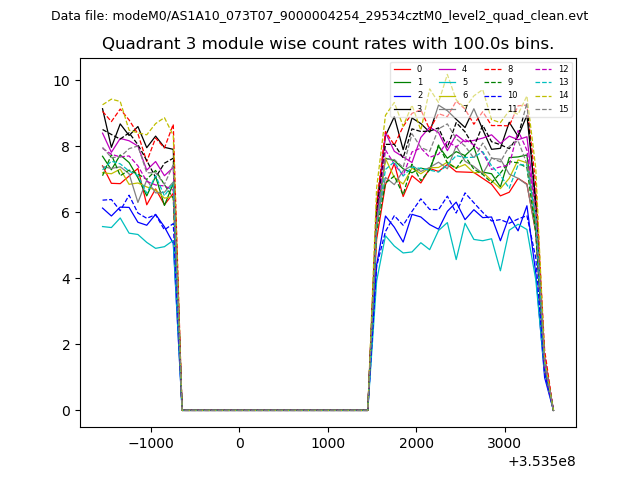
| Module-wise count rates for Quadrant C Data is divided into 100 sec bins |
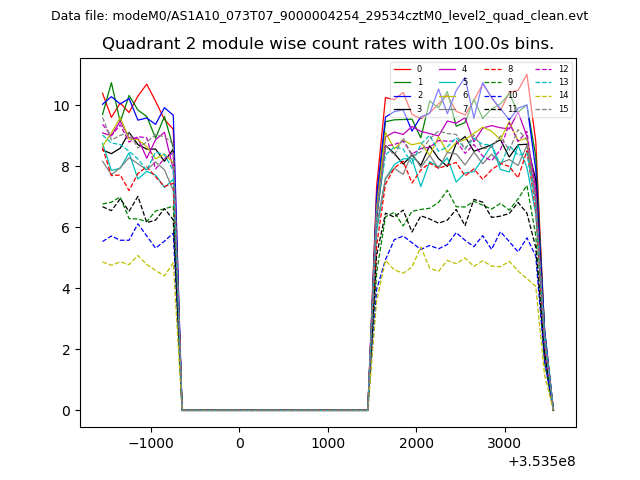 |
 |
| Module-wise count rates for Quadrant D Data is divided into 100 sec bins |
 |
 |
| Parameter | Plot |
|---|---|
| CZT HV Monitor | 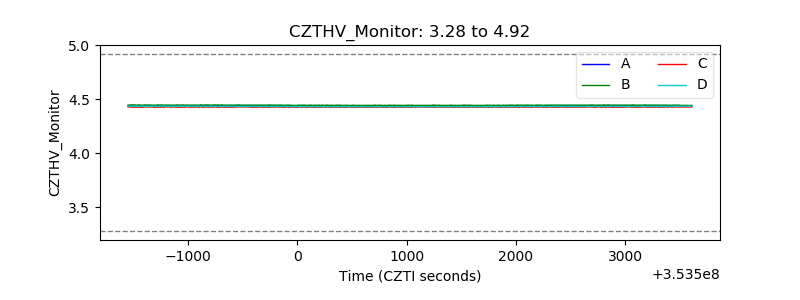 |
| D_VDD | 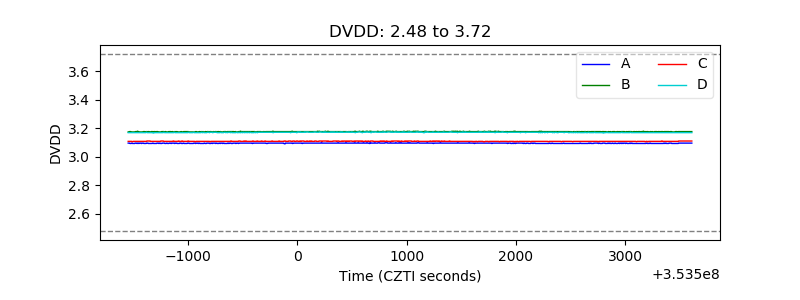 |
| Temperature 1 | 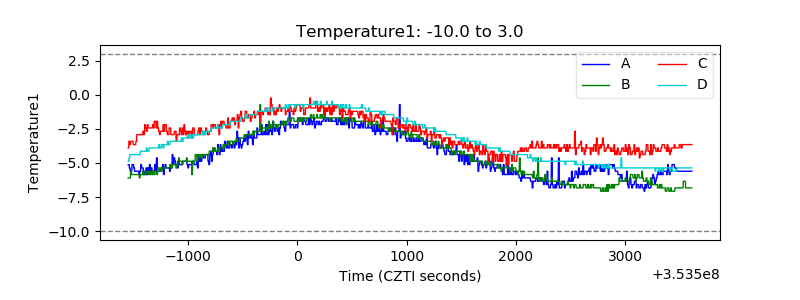 |
| Veto HV Monitor | 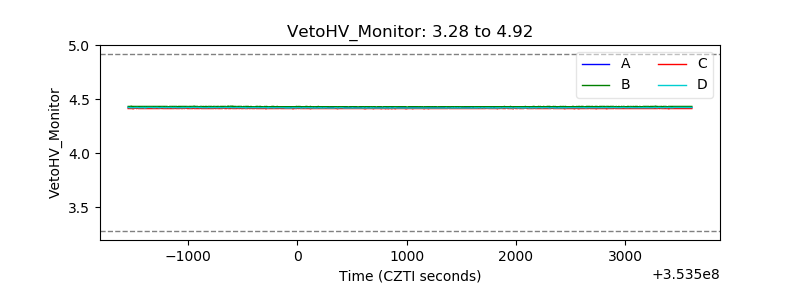 |
| Veto LLD | 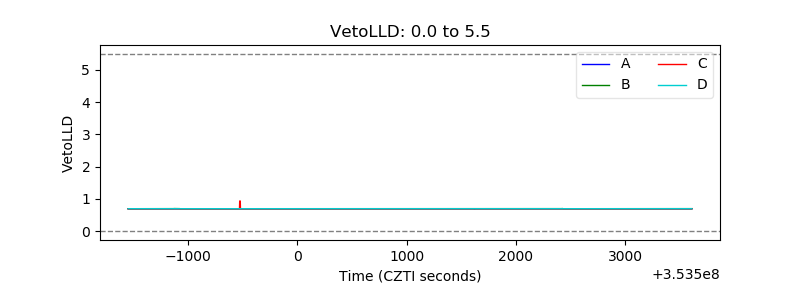 |
| Alpha Counter | 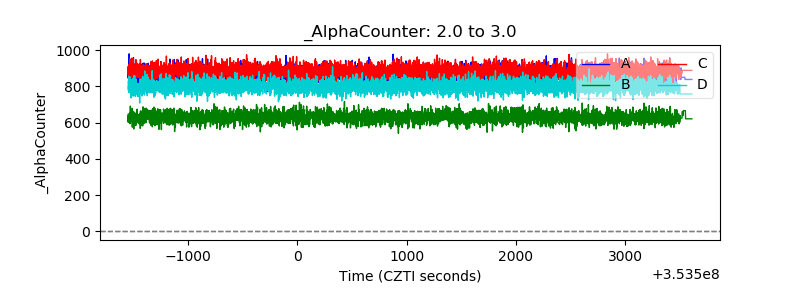 |
| _CPM_Rate | 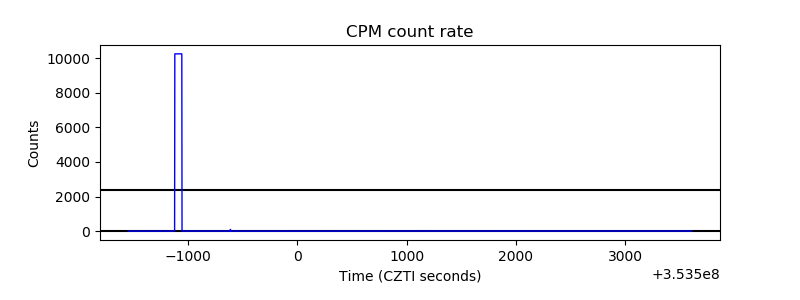 |
| CZT Counter | 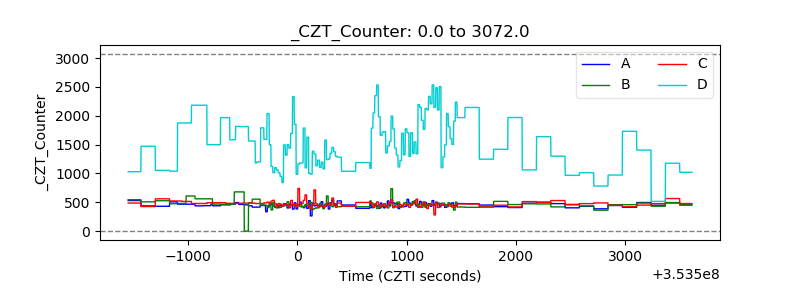 |
| +2.5 Volts monitor |  |
| +5 Volts monitor |  |
| _ROLL_ROT | 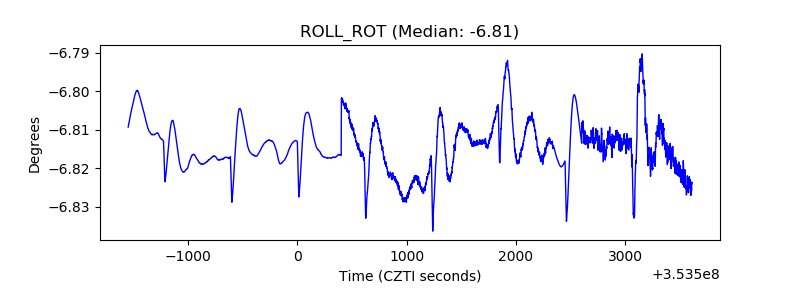 |
| _Roll_DEC | 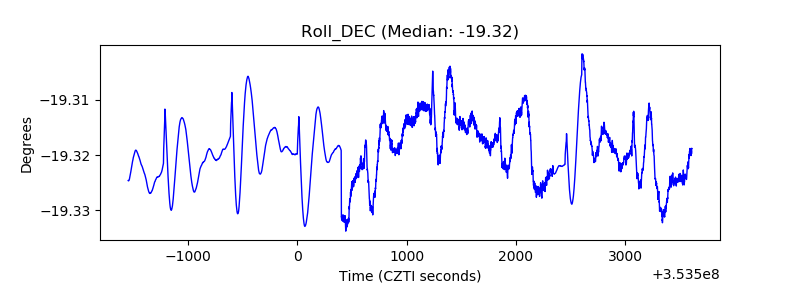 |
| _Roll_RA | 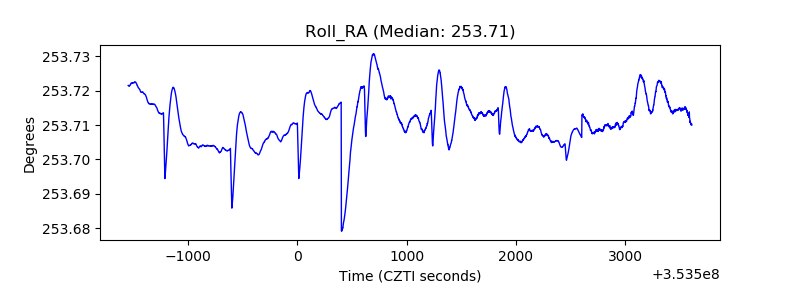 |
| Veto Counter | 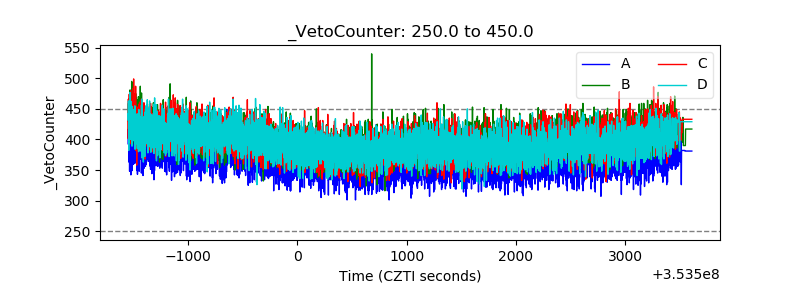 |